


0
US Dollar Index
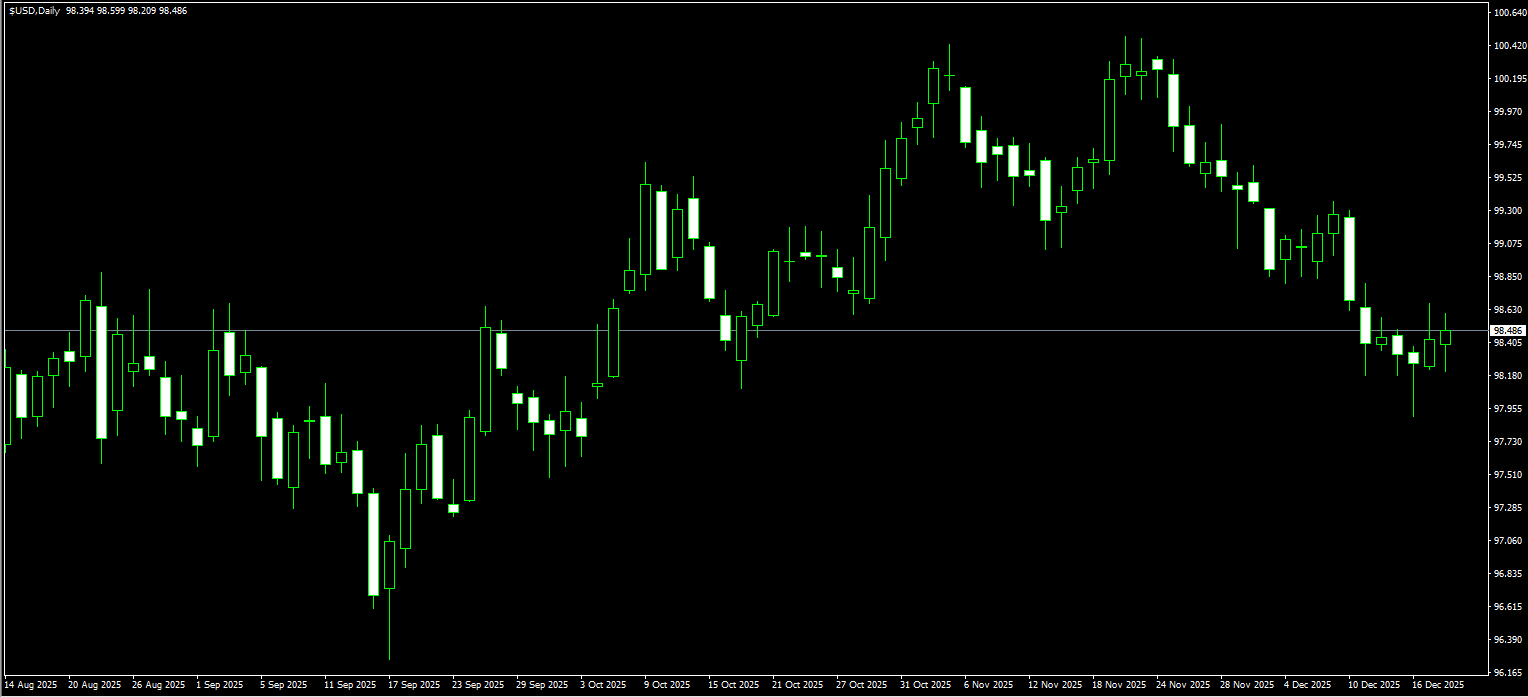
The US Dollar Index hovered around the 98.45 level on Thursday, remaining above the previous session’s gains. Mid-week trading highlighted a clear divergence in the foreign exchange market. GBP/USD fell back to around 1.3375 from a two-month high, driven primarily by an unexpectedly sharp slowdown in UK inflation. November consumer price inflation eased significantly to 3.2% year-on-year from 3.6% in October, marking the lowest level since March. As a result, traders have almost fully priced in a 25-basis-point rate cut from the Bank of England. Meanwhile, the Dollar Index rose 0.16% to 98.37, supported in part by its safe-haven appeal as investors adopted a cautious stance ahead of upcoming interest-rate decisions from several major global central banks. Markets broadly expect the Bank of Japan to announce a rate hike on Friday. At the same time, internal divisions among Federal Reserve officials have become a focal point, with Governor Waller suggesting that the Fed still has room to cut rates amid signs of labor-market weakness, while also indicating that no further policy easing is expected beyond 2026.
Ongoing softening in the labor market, combined with expectations that the Federal Reserve could shift toward a more accommodative policy stance in early 2026, continues to weigh on the US dollar. If the Dollar Index breaks below the key retracement zone between 97.87, last week’s low, and the 98.00 psychological level, selling pressure could intensify and drive the index lower toward 97.46, the October 1 low. However, should upcoming consumer price inflation data surprise to the upside, the dollar may stage a technical rebound toward 98.79, the 38.2% Fibonacci retracement of the move from 96.22 to 100.39. A sustained break above this level would open the door toward the 99.07 area, which coincides with the 20-day simple moving average. Until the inflation outlook becomes clearer, the broader downside bias in the dollar is likely to persist, with limited confidence in a sustained recovery.
WTI Spot Crude Oil
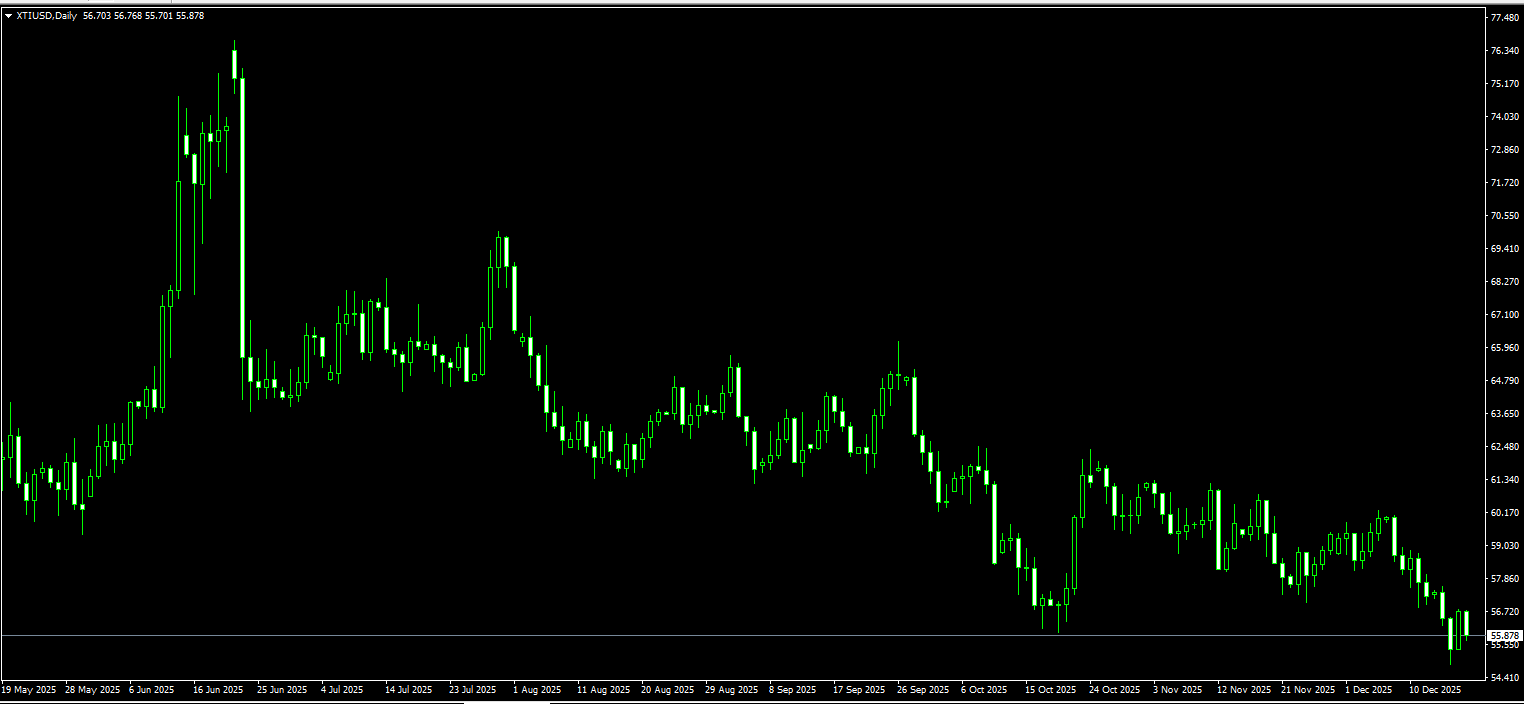
WTI crude oil is trading near 56.30 dollars per barrel after rising nearly three percent on Wednesday. The rebound was driven by heightened geopolitical tensions following the Trump administration’s latest actions targeting Venezuela, which provided short-term support to oil prices. Despite the market volatility triggered by the news, investors remain skeptical about its fundamental impact. These measures alone are unlikely to materially tighten the global supply-demand balance or sustain higher oil prices, as Venezuelan crude accounts for only around one percent of global supply and some shipping routes may bypass sanctions. On the other hand, data from the US Energy Information Administration showed larger-than-expected increases in gasoline and distillate inventories last week, limiting further upside in crude prices. Oil prices have remained under pressure in recent weeks, mainly due to weak global demand and expectations that a potential peace agreement could lead to the lifting of sanctions on Russia, releasing additional supply. As such, the durability of this geopolitically driven rebound remains uncertain.
The core narrative in the oil market has shifted from fears of supply disruptions to expectations of supply releases. Ceasefire prospects have eroded the geopolitical risk premium, while high inventories, weak refining margins, and speculative short positioning have combined to create systematic downside pressure on prices. In the absence of a strong demand-side catalyst, crude oil is more likely to remain in a weak trading environment, with any rebound potentially viewed as a corrective move within a broader medium-term downtrend. Front-month WTI contracts are currently trading within the 55.00 to 58.00 dollar range, having already broken below a previous consolidation zone. Further downside could see prices test the short-term support near the 11-month low of 54.88, and a decisive break would likely open the door toward the 54.00 level. On the upside, resistance is seen near 58.16, the 20-day simple moving average, with a break above that level potentially targeting the 60.00 psychological threshold.
Spot Gold
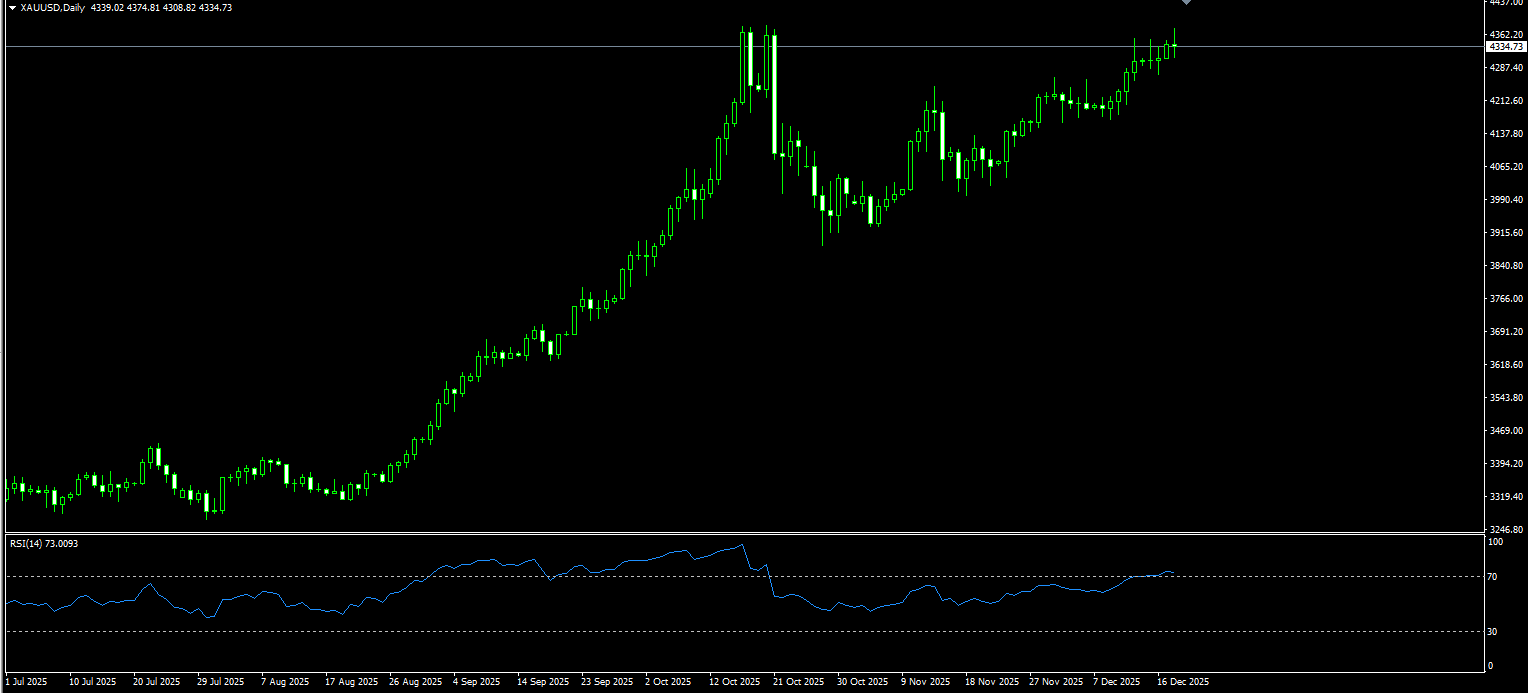
Mid-week, spot gold surged to trade near record highs around 4,336 dollars per ounce, as precious metals broadly rallied on Wednesday. Gold rose nearly one percent intraday, while spot silver jumped almost four percent, breaking above 66 dollars per ounce for the first time and reaching an all-time high of 66.86. The rally was fueled by weaker US labor data, which strengthened expectations for Federal Reserve rate cuts, as well as escalating tensions between the United States and Venezuela. US data released on Tuesday showed the unemployment rate rising to 4.6% in November, the highest level since September 2021, despite stronger-than-expected job creation. Signs of labor-market weakness reinforced market expectations for Fed easing, boosting demand for precious metals. Beyond economic data, worsening global geopolitical conditions also provided strong support for gold. President Trump ordered the blockade of all sanctioned Venezuelan oil tankers earlier this week, intensifying pressure on the Maduro government and further escalating US-Venezuela tensions. The associated risk of potential military action quickly triggered a surge in risk-averse sentiment, driving investors toward safe-haven assets such as gold.
After completing a corrective pullback, gold prices have regained momentum and recently moved back above the 4,300 dollar level. On the daily chart, the previous low was established at 3,886.51, followed by a trend-based recovery that formed a clear support base near 4,200. Resistance is now concentrated around the 4,350 level, corresponding to the December 15 high, with additional supply evident near 4,381.20 and the 4,400 psychological level. This price behavior suggests ongoing profit-taking and repeated attempts to push higher at elevated levels. From a structural perspective, the 4,200 area represents a key cost zone where bullish and bearish forces converge, while levels above 4,350 are more closely tied to market sentiment. Price action between these two zones will determine whether the next move develops into trend continuation or range-bound consolidation. On the downside, initial support is located at the 4,300 psychological level, followed by the December 16 low at 4,271, with the next key battleground near the 14-day simple moving average at 4,255.
AUD/USD
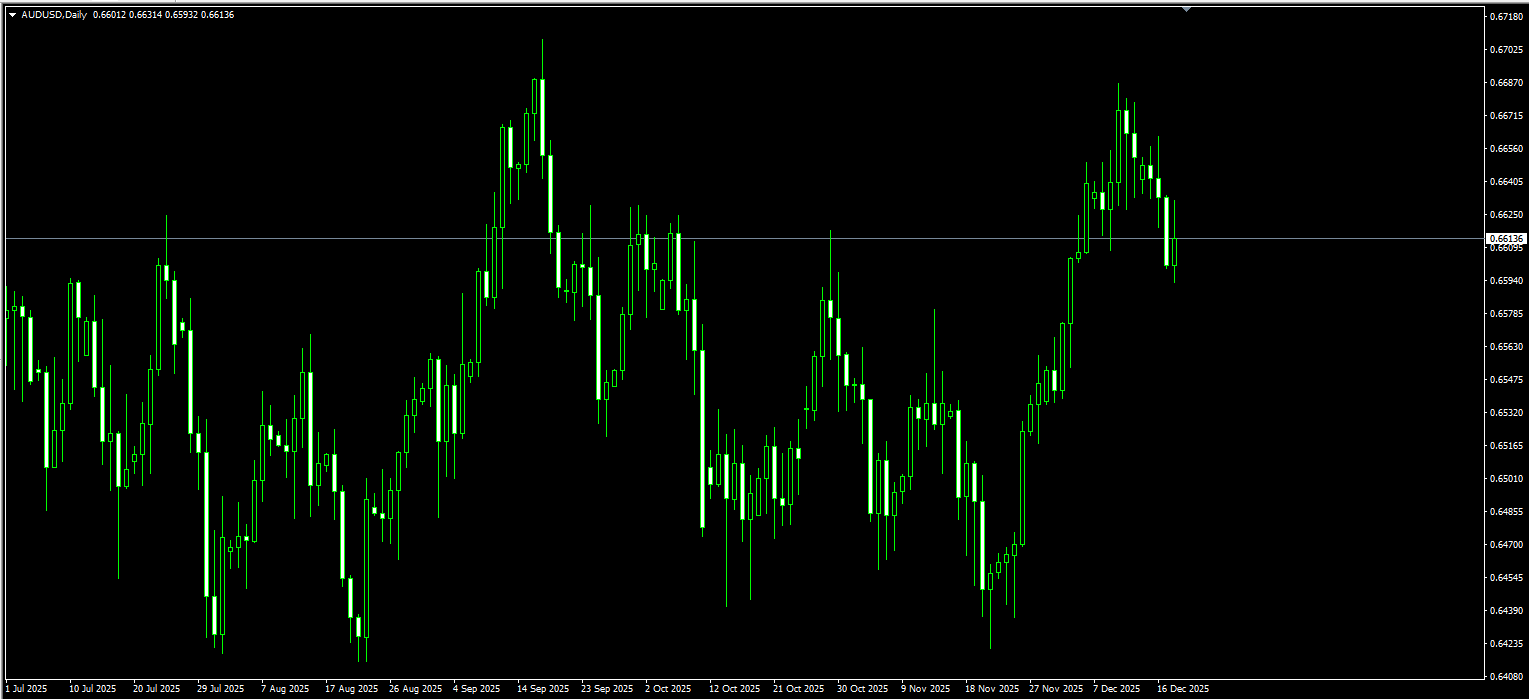
The Australian dollar weakened against the US dollar for a sixth consecutive session on Thursday. However, the release of Australian consumer inflation expectations may offer some support, as expectations rose to 4.7% in December from a three-month low of 4.5% in November. This increase reinforces the Reserve Bank of Australia’s hawkish stance. As concerns grow that the RBA could raise rates as early as February, the Australian dollar may begin to find a floor. Commonwealth Bank of Australia and National Australia Bank now expect the RBA to begin tightening policy earlier than previously anticipated, citing persistent inflation in a capacity-constrained economy. These forecasts follow the central bank’s hawkish hold at its final policy meeting of 2025. In the swaps market, the probability of a rate hike is priced at 28% for February, nearly 41% for March, and almost fully priced in by August.
AUD/USD briefly slipped below the 0.6600 level during Thursday’s session. Technical analysis on the daily chart shows the pair trading below the lower boundary of an ascending channel, signaling a weakening bullish bias. The pair is also trading below the nine-day exponential moving average at 0.6636, indicating subdued short-term momentum. On the downside, AUD/USD may test initial support at 0.6552, the 89-day simple moving average, with a break opening the way toward the 0.6500 psychological level. On the upside, a recovery could see the pair retest this week’s high at 0.6661, potentially restoring bullish momentum toward the three-month high at 0.6685, followed by the October 2024 peak at 0.6707.
GBP/USD
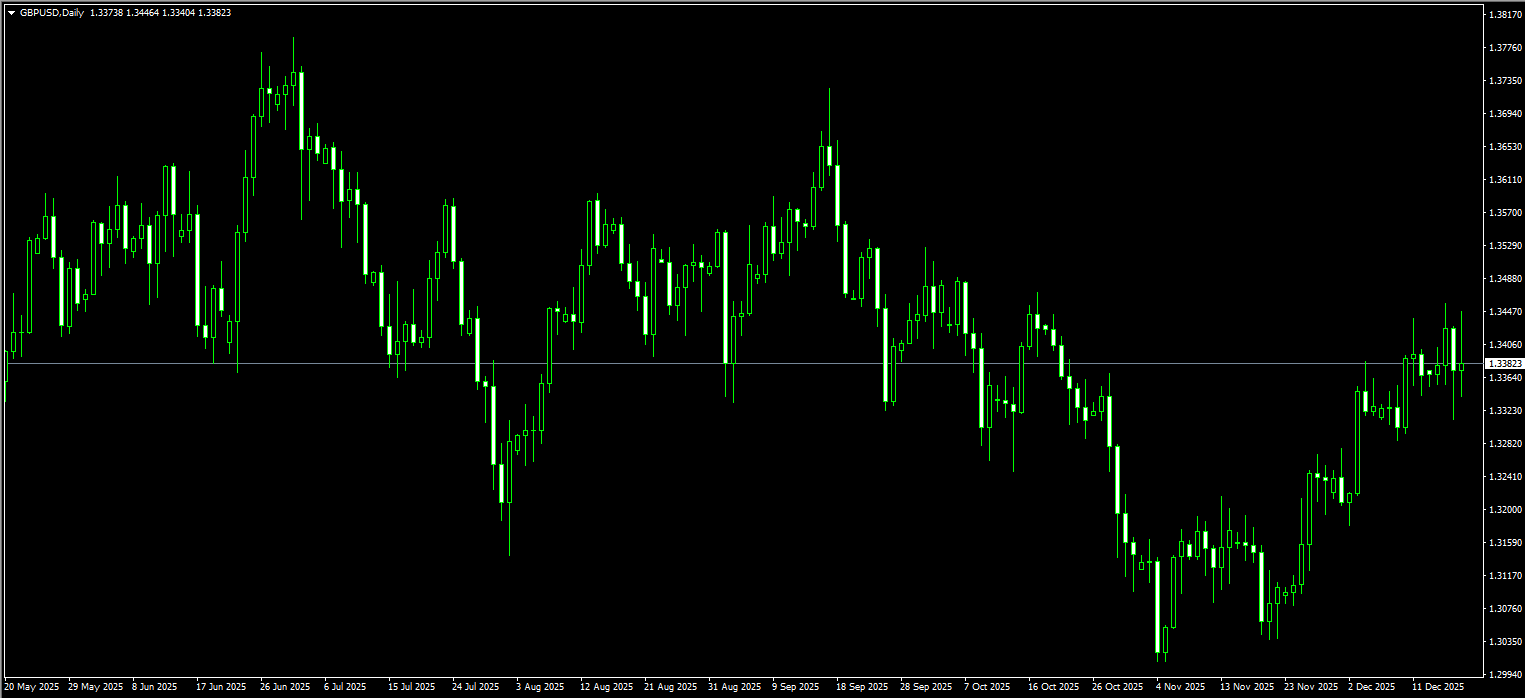
GBP/USD attempted to recover from the 1.3310 region, near a one-week low, during Thursday’s session and has since traded within a narrow range. Spot prices are currently hovering around the 1.3370 area. Meanwhile, the UK unemployment rate has risen to its highest level since early 2021, providing room for the Bank of England to further ease monetary policy. However, sterling bears appear reluctant to commit aggressively, opting to wait for clearer guidance on the BoE’s policy path. In addition, the absence of sustained US dollar buying has offered some support to the pair. Despite the Federal Reserve’s cautious stance, traders continue to price in the possibility of two additional rate cuts in 2026, as clear signs of labor-market softening emerge in the US. Expectations that the Fed Chair could be succeeded by a more dovish candidate have failed to provide lasting support for the dollar, reinforcing the need for caution when positioning for deeper losses in GBP/USD.
The short-term bias in GBP/USD remains neutral to mildly bullish, although softer inflation data pushed the pair down to this week’s low at 1.3311 before some losses were trimmed. While near-term momentum appears slightly bearish, the 14-day relative strength index on the daily chart remains in bullish territory, suggesting further upside potential. A sustained close back above the 1.3400 level could open the way toward 1.3472, the October 17 high, followed by the 1.3500 psychological barrier. Conversely, a break below 1.3327, the 210-day simple moving average, could expose the pair to a retest of the 1.3311 weekly low and the 1.3300 area, with further downside toward the 230-day simple moving average at 1.3258.
USD/JPY
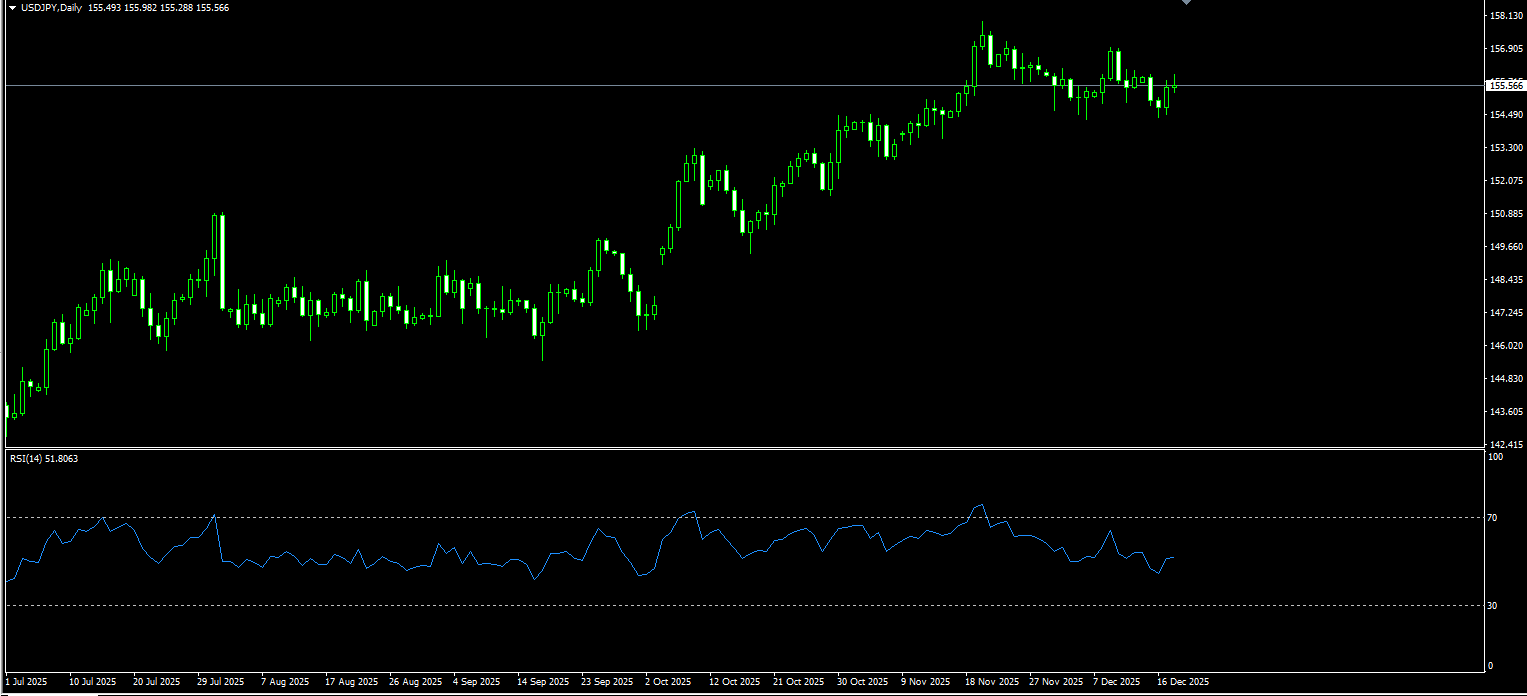
USD/JPY rose to around 155.70 during early Asian trading on Thursday, supported by cautious remarks from Federal Reserve Governor Christopher Waller. Waller stated on Wednesday that the US central bank is not in a hurry to cut interest rates, offering near-term support to the dollar. At the same time, growing acceptance of expectations that the Bank of Japan will raise rates has limited upside in the pair. The BoJ is widely expected to raise its policy rate from 0.5% to 0.75% at the conclusion of its two-day meeting on Friday, which would mark the highest benchmark rate in three decades. BoJ Governor Kazuo Ueda reiterated last week that the probability of achieving the central bank’s economic and price outlook is steadily increasing, adding that Japan is moving closer to its inflation target.
USD/JPY is likely to remain closely tied to movements in Japanese government bond yields. As long as yields do not decline sharply, the pair should find underlying support. From a technical perspective, the pair has gradually drifted lower from recent highs over the past week, forming a short-term bearish consolidation pattern. Daily oscillators have begun to turn negative, indicating that downside pressure is gradually building. The pair is currently finding support near the 154.30 monthly low, and a decisive break below 154.00 would signal the start of a new downward leg, opening the door to lower levels. On the upside, resistance is located near 156.48, the November 27 high, where any short-term rebound may stall. A break above this level could trigger short-covering toward the 157.00 monthly high. Overall, USD/JPY remains range-bound with a downward bias ahead of the Bank of Japan’s policy decision.
EUR/USD
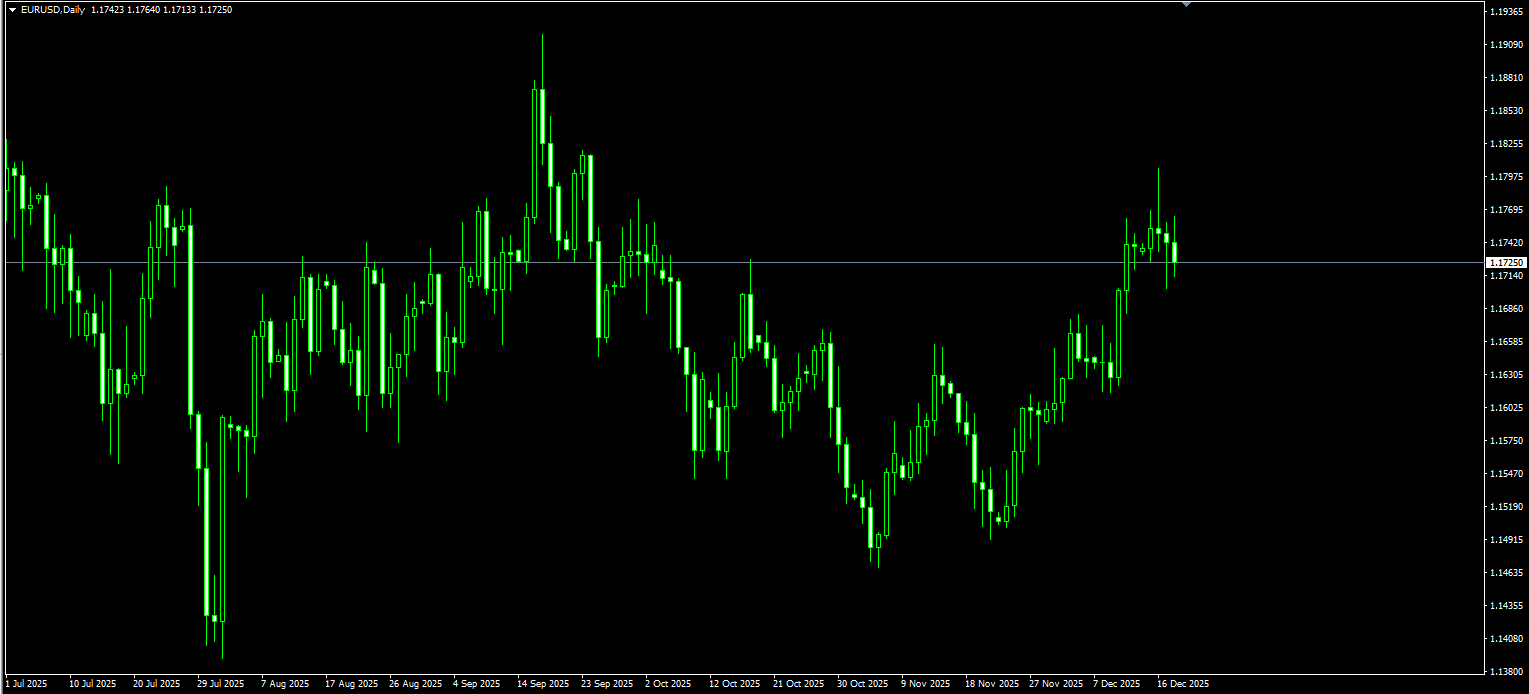
Earlier this week, EUR/USD briefly broke above the 1.1800 level, marking its highest point since late September, before losing momentum and retreating to just above 1.1700 during early European trading. While the short-term price action appears to reflect a classic spike-and-pullback pattern, it is underpinned by two competing themes. The first is a recalibration of US rate expectations following recent employment data, while the second is growing caution ahead of the European Central Bank’s upcoming interest-rate decision and updated macroeconomic projections. The latest data showed that US nonfarm payrolls fell by 105,000 in October before rebounding by 64,000 in November. At first glance, the sharp October decline raised concerns about economic cooling and weighed on the dollar. However, the dollar’s swift stabilization suggests that traders are focusing more on the composition and sustainability of the data rather than a single monthly print. In this context, the employment data appears to have delivered only a short-lived shock to the dollar rather than a structural turning point.
EUR/USD is currently consolidating in the middle of the 1.1700 to 1.1800 range. The 14-day relative strength index on the daily chart remains bullish, indicating that buyers retain control. However, failure to break decisively above the 1.1800 psychological level could pave the way for further downside. A clear breakout above 1.1800 would likely see the pair test the 1.1850 area, with scope to extend toward the annual high at 1.1918. Conversely, a break below the 10-day simple moving average at 1.1705, followed by a move below the 1.1700 psychological level, would expose the pair to a test of the 89-day simple moving average near 1.1654, and potentially the 1.1600 level.
更多報導


風險披露:衍生品在場外交易,採用保證金交易,意味著具有高風險水平,有可能會損失所有投資。這些產品並不適合所有投資者。在進行交易之前,請確保您充分了解風險,並仔細考慮您的財務狀況和交易經驗。如有必要,請在與BCR開設帳戶之前諮詢獨立的財務顧問。
BCR Co Pty Ltd(公司編號1975046)是一家依據英屬維京群島法律註冊成立的公司,註冊地址為英屬維京群島托爾托拉島羅德鎮Wickham’s Cay 1的Trident Chambers,並受英屬維京群島金融服務委員會監管,牌照號碼為SIBA/L/19/1122。
Open Bridge Limited(公司編號16701394)是一家依據2006年《公司法》註冊成立並在英格蘭及威爾斯註冊的公司,註冊地址為 Kemp House, 160 City Road, London, City Road, London, England, EC1V 2NX. 本公司僅作為付款處理方,並不提供任何交易或投資服務。

 English
 简体中文
简体中文
 繁體中文
繁體中文
 Bahasa
Melayu
Bahasa
Melayu
 Tiếng
Việt
Tiếng
Việt
 ไทย
ไทย
 日本語
日本語
 한국어
한국어
 ភាសាខ្មែរ
 español