0
Currency & Commodity Analysis:
US Dollar Index
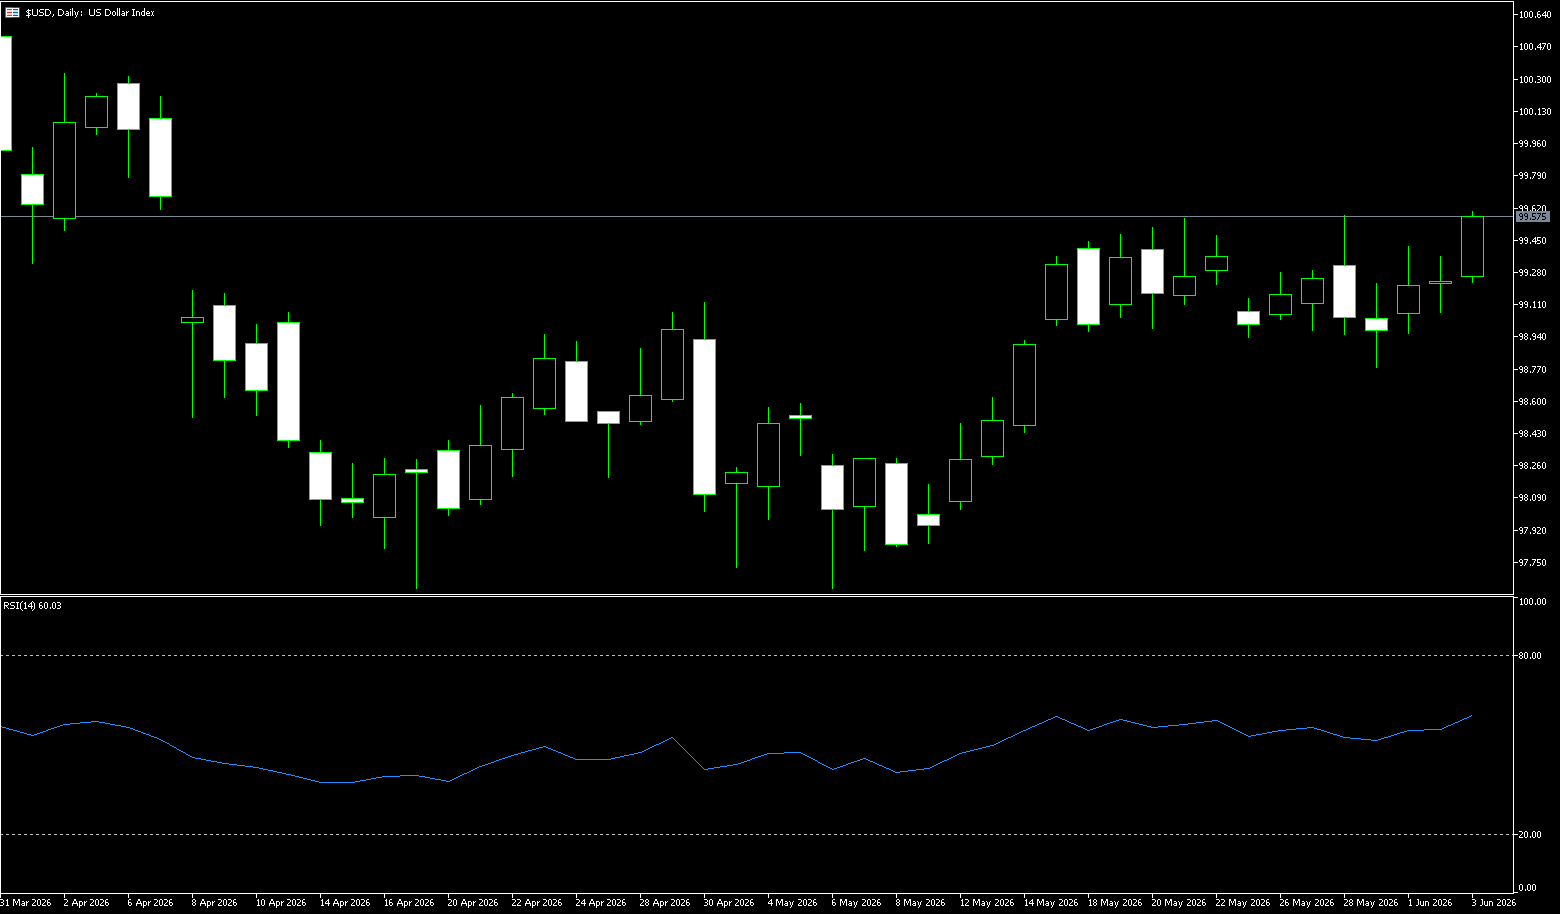
The US dollar index rose further to 99.50 on Wednesday, reaching its highest level in nearly two months, after an ADP report showed that the private sector added 122,000 jobs in May, exceeding expectations and reaching a new high since January 2025. The data shows a continued strengthening labor market, further solidifying market expectations that the Fed may raise interest rates later this year. Earlier this week, Jolts data showed that job openings in April rose to their highest level since November 2024, further highlighting the resilience of labor demand. The dollar has been supported by escalating tensions in the Middle East, and oil prices rose for the third consecutive trading day, exacerbating concerns about inflationary pressures. The market currently estimates an 85% probability of the Federal Reserve raising interest rates by 25 basis points before the end of the year, up from 60% a week ago.
The US dollar index is trending slightly higher on the daily chart, currently trading above 99.30 and holding above all moving averages. Short-term resistance is seen at the previous high of 99.55, with medium-term resistance at 100.00 (a psychological level). Support lies at the 20-day and 50-day moving averages and the previous low of 97.63. The MACD remains above the zero line, with the DIFF above the DEA, indicating a slight continuation of bullish momentum. The RSI is between 55 and 60, above the 50 level, suggesting bulls are in control but not yet overbought. The moving average system is bullish, with the medium-term center of gravity steadily rising. Short-term consolidation is seen due to resistance at the previous high. The market is trending slightly higher, supported by moving averages. Key levels to watch are the 99.55-100.00 (psychological resistance) level and the 99.00-98.58 (200-day moving average) level.
Today, consider shorting the US Dollar Index at 99.60, with a stop-loss at 99.70 and targets at 99.20 and 99.10.
WTI Crude Oil
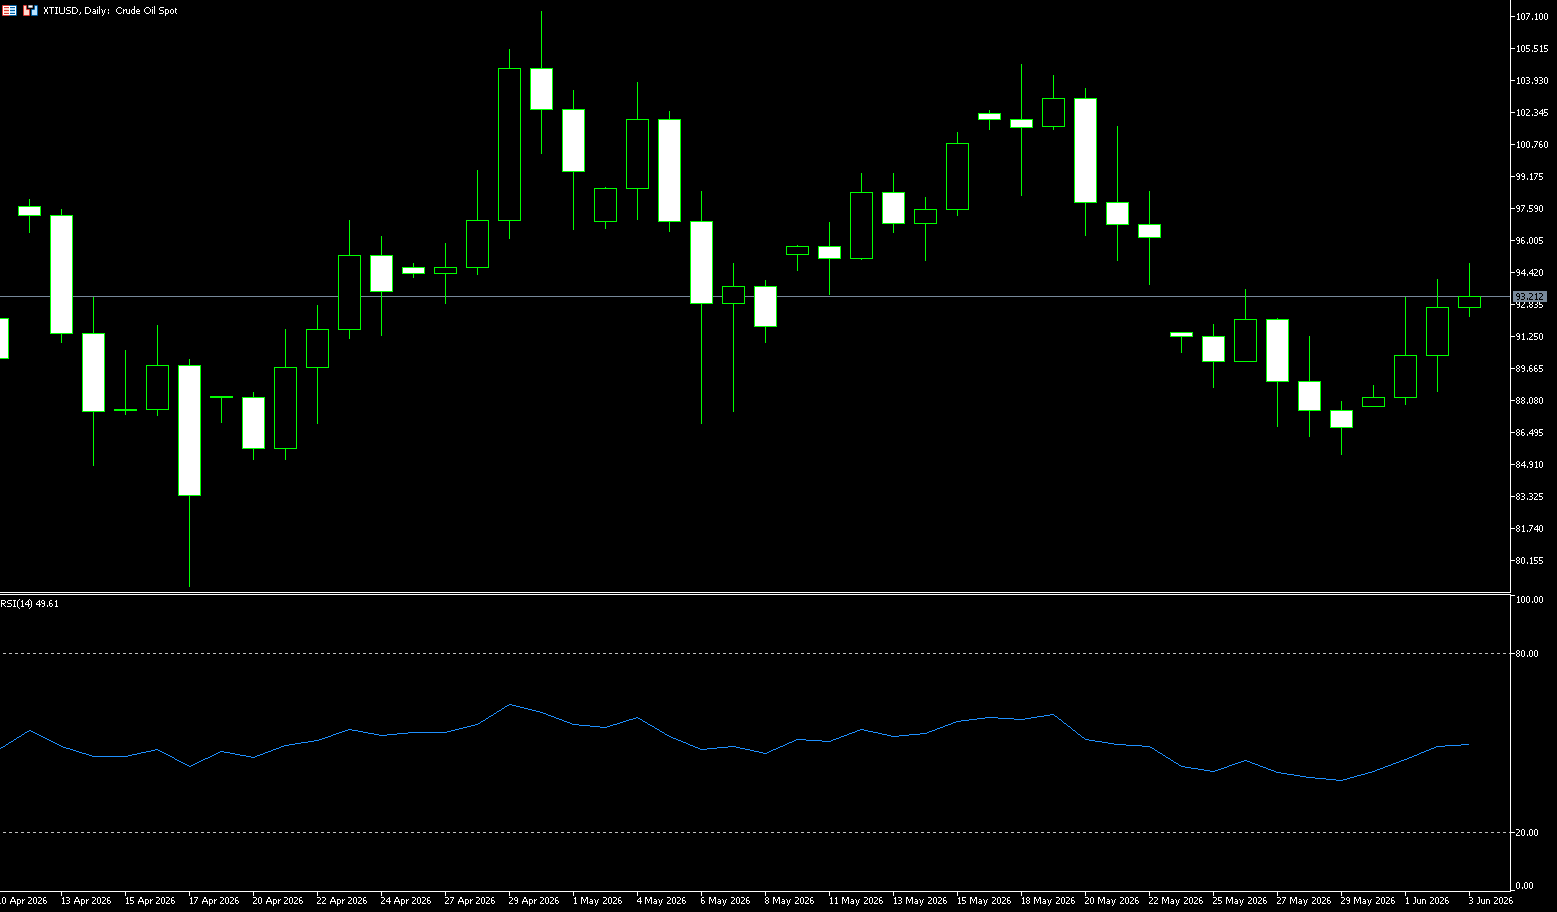
WTI crude oil rose above $94 a barrel on Wednesday, marking its third consecutive day of gains, as uncertainty surrounding the US-Iran peace talks maintained a geopolitical risk premium in the oil market. In late May, US crude oil prices experienced a dramatic plunge. From a high of $107.35 at the end of April, it plummeted to a low of $85.40, a drop of nearly 20%. This sharp drop was entirely driven by geopolitical events, with three waves of major negative news hitting in quick succession, giving bulls almost no chance to breathe. In the first half of the week, oil prices rebounded strongly, with a single-day increase reaching 8%. This surge was mainly due to the unexpected major news from Iran, representing profit-taking by short sellers and a technical rebound from oversold conditions. As the situation quickly cooled down, the upward momentum failed to continue. The market quickly realized that the overall context of conflict resolution and de-escalation remained unchanged. Although Israel stated it would continue military operations, unless there is a larger-scale unexpected escalation, it is unlikely to create a shock strong enough to reverse the trend.
From the 4-hour candlestick chart, the current price is fluctuating wildly around $90.99 (the 0.236 Fibonacci retracement level). Although yesterday's rebound briefly broke through the 0.382 Fibonacci retracement level (approximately $93.86), it quickly returned to that range, indicating heavy upward pressure. Multiple moving averages (MA20, MA50, MA100) continue to firmly suppress the price, forming layers of resistance. In terms of technical indicators, MACD (26,12,9) is still running below the zero axis, DIFF-1.92, DEA-1.86. Although the bearish momentum has weakened slightly, the overall trend has not reversed. RSI (14) is hovering around 48, oscillating at a low level but not yet entering deep oversold territory, and there is still room for adjustment in the short term. Upward resistance is considered at 94.94 {50-day moving average} and 100 {market psychological level}; downward support is at 90.00 {market psychological level} and 87.82 {this week's low}.
Today, consider going long on crude oil at 94.00, with a stop loss at 93.80 and targets at 96.00 and 97.00.
Spot Gold
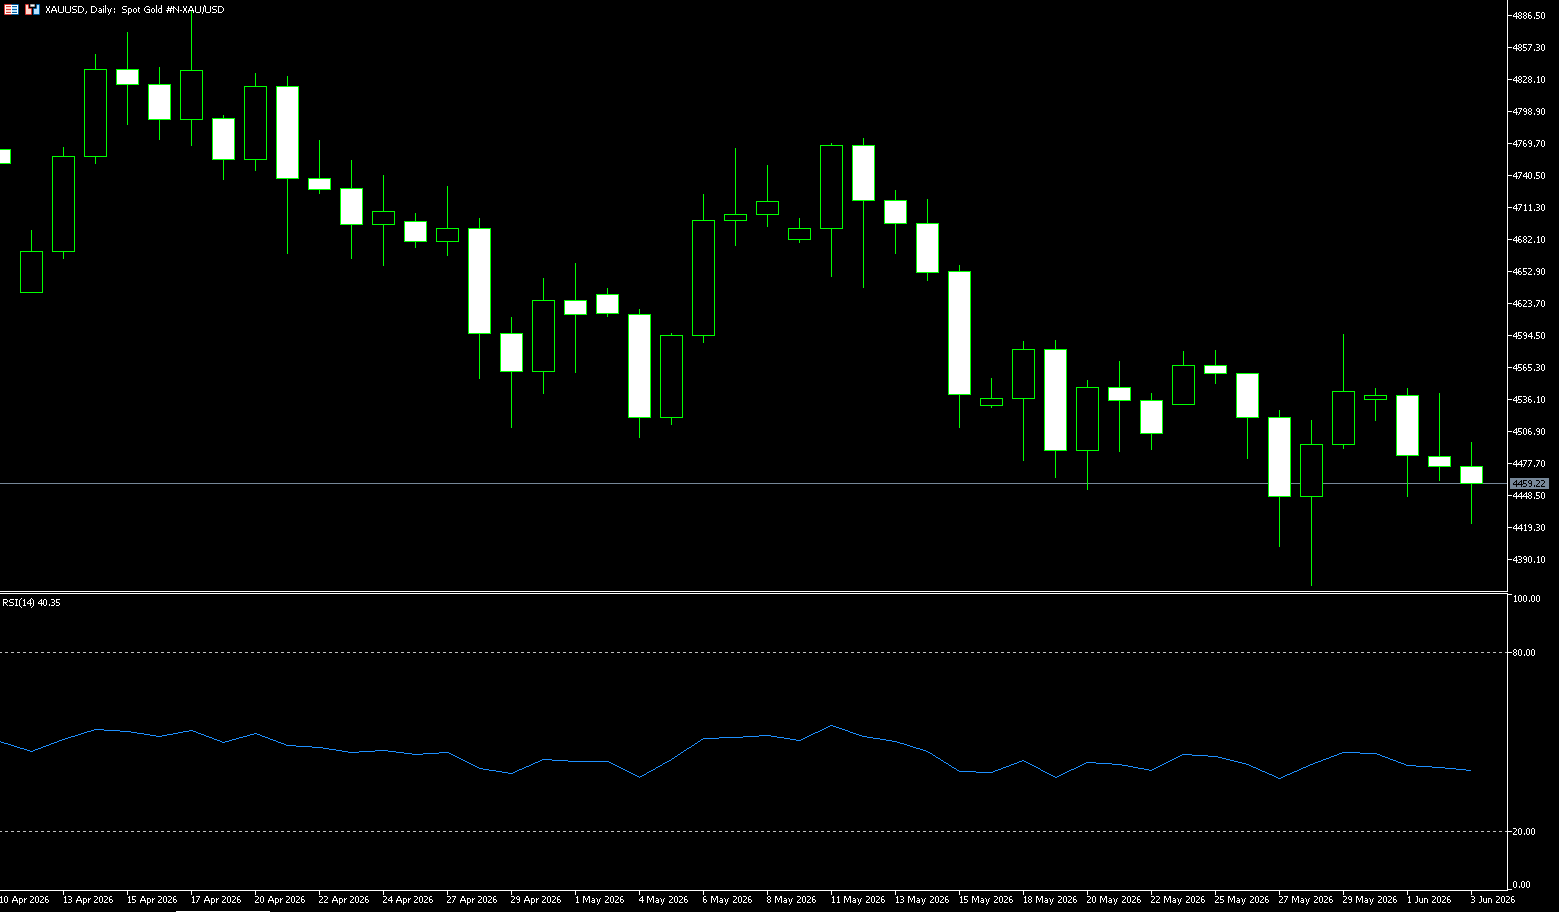
On Wednesday, gold prices fell below $4,450 per ounce, gradually approaching the March low reached last week, as the market anticipated that central banks might need to take a more hawkish stance and keep interest rates at higher levels for a longer period. The continued uncertainty surrounding a potential agreement between the US and Iran to end the conflict has also weighed on market sentiment. Meanwhile, rising oil prices have further exacerbated concerns about inflationary pressures. In the US, recent labor market data indicates accelerating job growth, consistent with earlier ADP and Jolts reports. Therefore, the market expects the European Central Bank to raise borrowing costs next week, and traders also anticipate a further 25 basis point rate hike in September. Although gold is generally considered a safe-haven asset against inflation, its appeal as a non-yielding asset tends to diminish when interest rates are high.
Overall, gold is expected to maintain a high-level consolidation pattern in the short term. Further escalation of the Middle East conflict or a substantial breakthrough in negotiations could trigger significant price volatility. Investors should remain cautious at this juncture, closely monitoring the latest geopolitical developments and changes in Federal Reserve policy signals. From the daily chart, gold has entered a low-level consolidation phase after a double bottom. The price is trading below the Bollinger Band middle line at 4,570, near the lower band at 4,388.50, and the narrowing bandwidth indicates reduced volatility. The MACD indicator shows a bearish bias, but momentum is clearly weakening, and a bullish divergence is emerging. Key support is between 4,422 (200-day moving average) and 4,400 (psychological level); resistance is primarily at 4,570 (Bolligate midline, a key level for bulls and bears) and the 4,500 level.
Today, consider going long on gold at 4,428, with a stop-loss at 4,424 and targets at 4,470 and 4,480.
AUD/USD
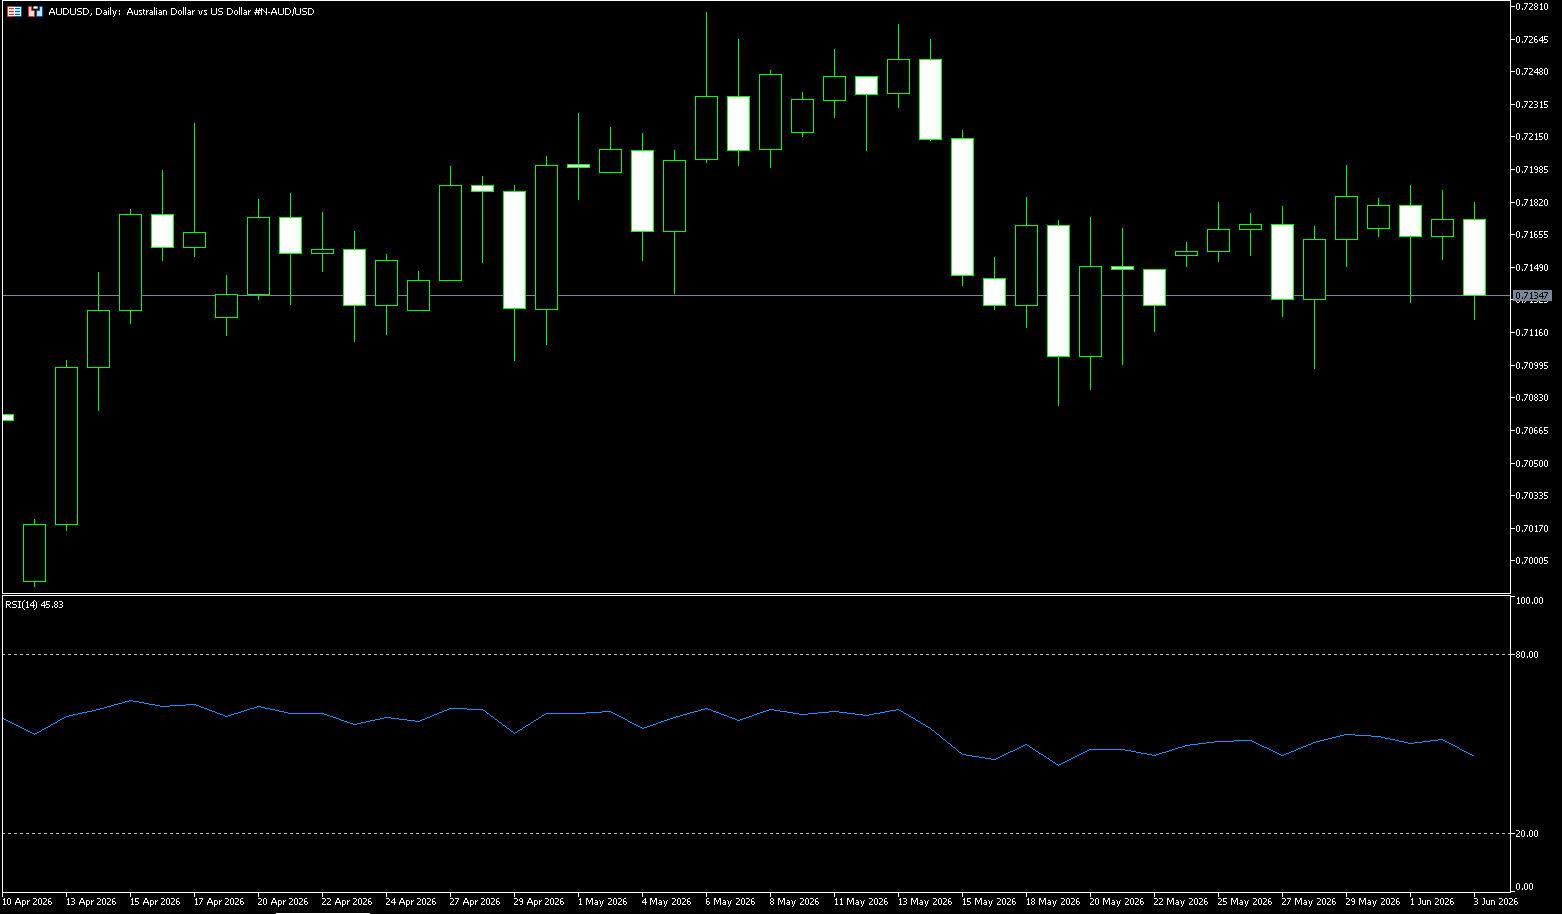
Data released by the Australian Bureau of Statistics (ABS) on Wednesday showed that Australia's GDP grew at a quarterly rate of 0.3% in the first quarter of 2026 (Q1), lower than the 0.8% growth in the fourth quarter of 2025. This figure was weaker than the market expectation of 0.5% growth. The annualized GDP growth rate in the fourth quarter was 2.5%, down from 2.6% in the previous quarter and below the market consensus of 2.7%. The weaker-than-expected Australian GDP report caused an immediate decline in the Australian dollar. The AUD/USD pair traded at 0.7175, down 0.04% on the day. The pair is slightly lower than Monday's closing price of 0.7180. The central bank has already raised interest rates three times this year, and recent disappointing employment and inflation data have significantly reduced investors' bets on another rate hike in June, currently pricing in only about a 5% probability. Meanwhile, global oil prices continued to rise, and the safe-haven US dollar strengthened as a ceasefire agreement between the US and Iran remained elusive, tensions in the Middle East remained high, and efforts to reopen the Strait of Hormuz made little progress.
The Australian dollar/US dollar pair is trading around 0.7130 on the daily chart. The pair maintains a constructive short-term bias, with the price well above the 100-day simple moving average (0.7062), indicating that the overall uptrend remains supported despite recent consolidation. The 14-day Relative Strength Index (RSI) is around 52, maintaining a neutral-to-bullish tone, suggesting that bullish momentum is moderate and still present, rather than excessive. On the downside, initial support lies near the psychological level of 0.7100; if this level holds, a deeper pullback could attract bargain hunters again at the 100-day simple moving average around 0.7062. With no clear resistance levels in the current data, traders are likely to focus more on price action and momentum changes around the 0.7200 level and the recent high of 0.7270 to determine whether the pair will continue its upward trend or pull back to its moving average support.
Consider going long on the Australian dollar at 0.7120 today, with a stop loss at 0.7110 and targets at 0.7180 and 0.7190.
GBP/USD
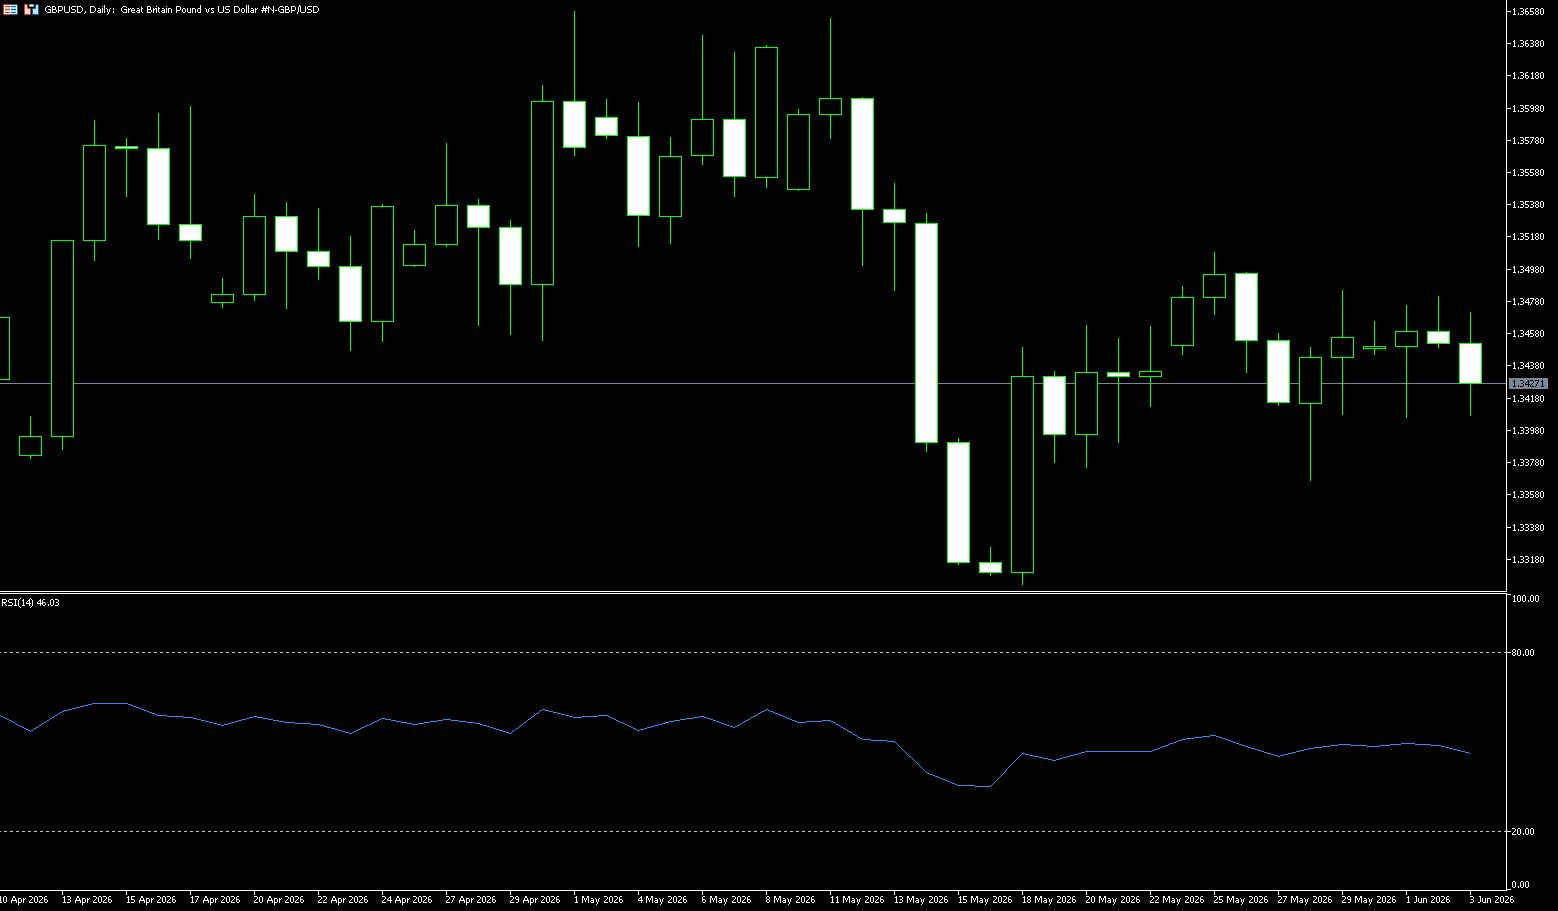
The GBP/USD pair traded modestly after four consecutive days of gains, hovering around 1.3420 during Wednesday's Asian session. The pair stabilized as the US dollar remained strong, supporting safe-haven demand, due to stalled US-Iran peace talks and renewed tensions in the Middle East. Further evidence of a strong economy emerged in the labor market, with job openings surging to a near two-year high of 7.6118 million in April, according to JOLTS data, while layoffs decreased. Strong manufacturing and employment data have complicated the inflation outlook, and investors are now anxiously awaiting Friday's non-farm payroll report for clearer clues about the future direction of monetary policy. Bank of England policymakers maintained a firm stance on inflation. Policymaker Megan Green delivered hawkish comments, suggesting a growing case for raising interest rates and emphasizing that "the speed of the response may be just as important as the magnitude." Her remarks followed comments from Bank of England Governor Andrew Bailey, who stressed the crucial importance of public confidence in the central bank's commitment to restoring inflation to its 2% target.
From a technical perspective, spot prices are below the 200-period simple moving average (1.3495) on the 4-hour chart and below the 50.0% Fibonacci retracement level of the decline from the May swing high, indicating limited upward movement. Nevertheless, the MACD histogram is slightly positive, and the Relative Strength Index (RSI) is around 55, suggesting slight bullish momentum. However, momentum indicators are insufficient to recover the retracement and trend resistance above, making any upward attempts appear fragile for the time being. Initial resistance is located at the 200-period simple moving average (1.3495) and the psychological level of 1.3500; followed by the 61.8% Fibonacci retracement level at 1.3517, then 1.3576 and 1.3600. On the downside, support is first at the psychological level of 1.3400 and the 23.6% Fibonacci retracement level at 1.3384.
Consider going long on GBP/USD today at 1.3410, with a stop-loss at 1.3400 and targets at 1.3470 and 1.3460.
USD/JPY
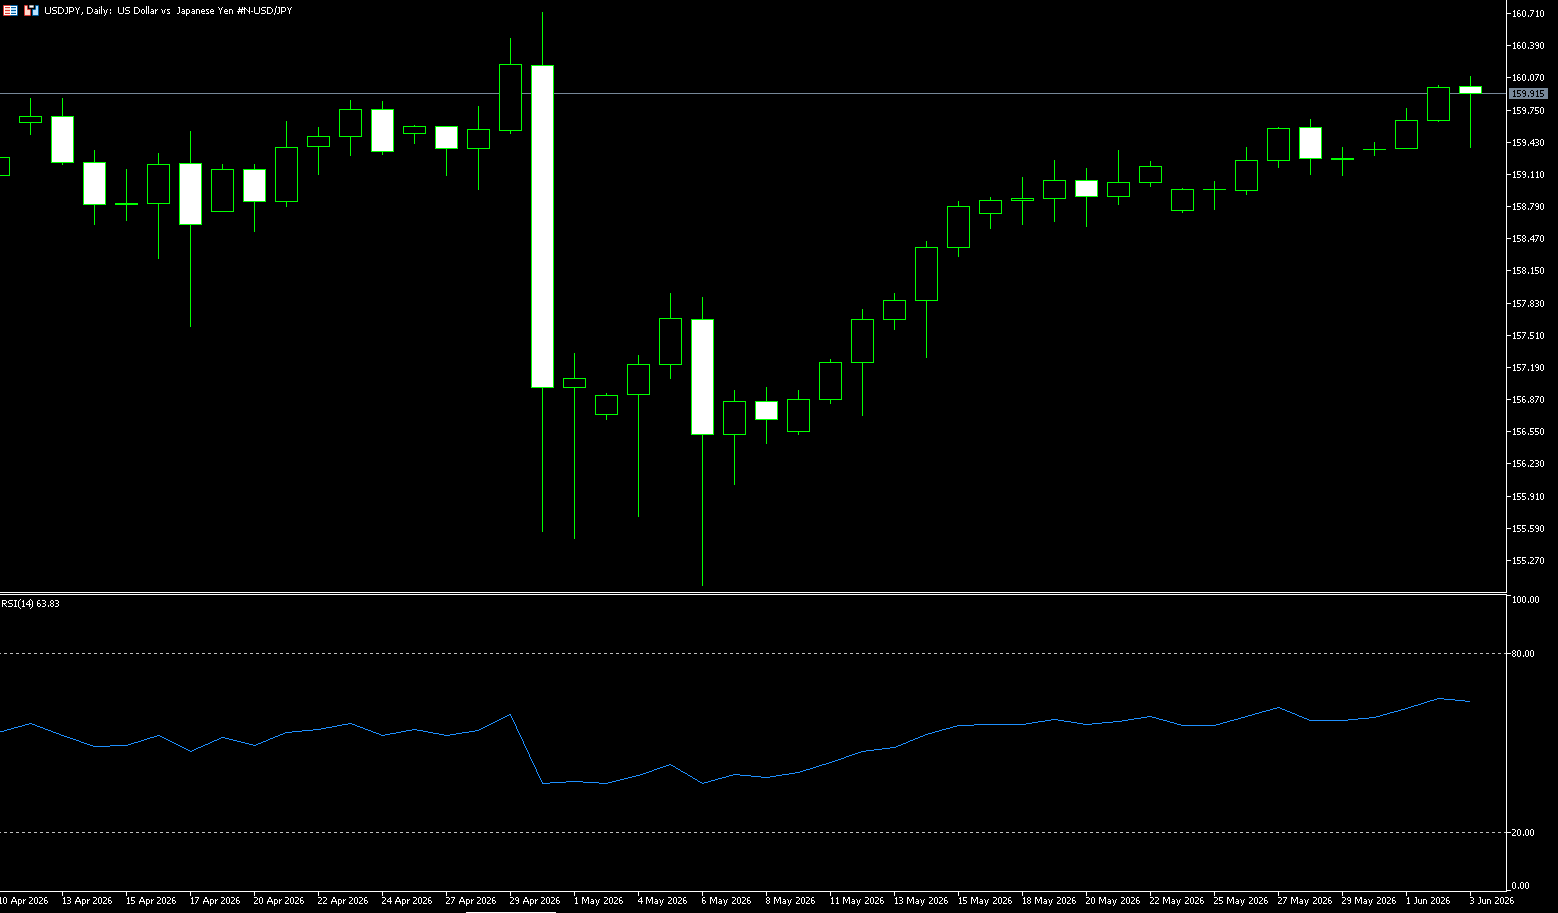
The yen weakened on Wednesday towards the 160 yen per dollar level, nearing the level that previously triggered official intervention and prompting renewed warnings from Japanese authorities. Finance Minister Satsuki Katayama reiterated that the government is prepared to take appropriate action in the foreign exchange market to address excessive currency volatility. Despite Tokyo spending ¥11.7 trillion on monetary intervention between April 28 and May 27, the yen's latest decline highlights ongoing pressure on the Japanese currency. This renewed weakness has also strengthened market expectations that the Bank of Japan may raise interest rates again later this month, as policymakers grapple with rising energy costs due to Middle East tensions. Market participants are now focused on a speech by Bank of Japan Governor Kazuo Ueda, scheduled for later Wednesday.
From the 4-hour candlestick chart, the USD/JPY pair entered a consolidation and upward trend after hitting a low of 155.05 in early May, rising above 159.99 by June 2nd, approaching the previous consolidation platform. Current Bollinger Band parameters show the middle band at 158.70, the upper band at 160.57, and the lower band at 156.83. The Bollinger Bands are narrowing, indicating that the price is about to face a directional choice. The MACD indicator is above the zero line in bullish territory, but volume is moderate, with no significant increase in volume. The MACD is rising in tandem with the price rebound, but has not yet broken through the peak area corresponding to the previous high, indicating a weakening of bullish momentum. On the downside, watch the 159 (psychological level) and 158.47 (75-day moving average); on the upside, consider 160.57 (upper Bollinger Band) and the 161.00 level.
Today, consider shorting the US dollar at 160.20, with a stop loss at 160.40 and targets at 159.30 and 159.20.
EUR/USD
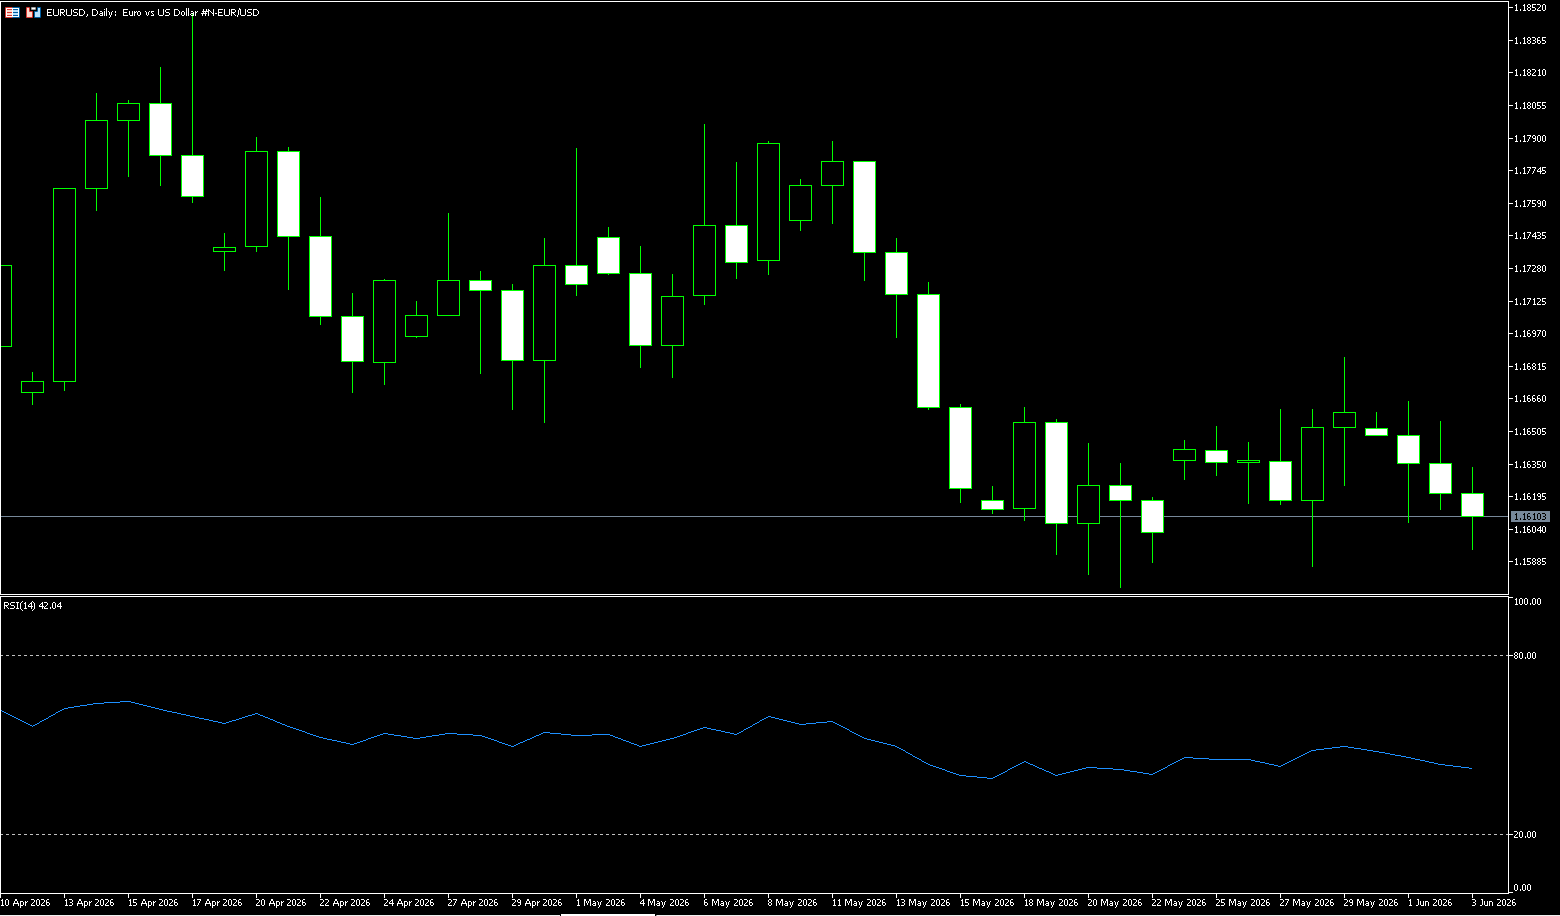
The euro remains around $1.1600, as investors digest mixed signals from eurozone inflation data and the Middle East conflict. Eurozone inflation climbed to 3.2% in May, the highest level in two and a half years, mainly driven by soaring war-related energy costs. However, core inflation accelerated to 2.5%, exceeding expectations, while services inflation rose to 3.5%, indicating that price pressures extended beyond the energy sector. This data release comes ahead of next week's European Central Bank meeting, with the market pricing in a 95% probability of a 25 basis point rate hike and expecting two or possibly three rate hikes this year. Meanwhile, ECB President Isabel Schnabel warned on Monday that it is too early to determine how many rate hikes are needed, while Lithuania's Gediminas Szymkus stated that another rate hike after June is highly likely. Elsewhere, oil prices fell due to conflicting reports from US President Trump and Israeli Prime Minister Netanyahu regarding negotiations in Lebanon, and Iran suspended talks with the US until the conflict ceases.
Looking at the daily chart, the euro/dollar pair remains below the Bollinger Band middle line at 1.1662, with the upper band around 1.1771 and the lower band around 1.1553. The exchange rate has repeatedly attempted to return to the 1.1660-1.1685 area but failed to establish a firm foothold, indicating that the upper resistance level is not simply a price level resistance, but rather a densely traded area after previous exchanges between bulls and bears. On the MACD side, the DIFF is around -0.0015, the DEA around -0.0014, and the histogram around -0.0002, showing signs of weakening bearish momentum, but without a clear positive expansion. In other words, the market is not experiencing a strong one-sided decline, but rather a low-level correction after a downtrend. The low near 1.1575 and the lower Bollinger Band at 1.1553 form a short-term risk boundary, while the high near 1.1685 and the psychological level of 1.1700 form a rebound confirmation zone.
Today, consider going long on the Euro at 1.1585, with a stop loss at 1.1585 and targets at 1.1640 and 1.1650.
Stock Analysis:
Australian ASX 200 Stock Index
Basic Market Overview:
The Australian ASX 200 index rose 61 points, or 0.7%, to close at 8786 on Wednesday, recovering from the weakness of the previous two days and reaching its highest level in a month. Meanwhile, weak first-quarter GDP data reinforced market views that the central bank may pause further policy tightening, after raising interest rates three times so far this year amid persistent inflationary pressures. The gains were mainly driven by manufacturing, non-energy mining, and processing sectors, outperforming the weakness in consumer, healthcare, and business services stocks.
Sector Performance:
Leading Gains: 1. Information Technology (XIJ, weekly gain +3.1%, strongest in the market)
Driven by: Spillover effect from the surge in US AI technology stocks, improved earnings expectations for domestic SaaS companies;
Leading Stocks: WiseTech, Xero, SiteMinder, with weekly gains of 7%~11%, software services sector strengthened across the board.
2. Raw Materials/Mining (XMJ, Weekly +2.25%)
Drivers: Copper, gold, and iron ore prices rebounded, with BHP and Rio Tinto hitting record highs; lithium and rare earth minor metals also rose.
Weighted Stocks: BHP rose 2.5% weekly, Rio Tinto +1.9%, and gold stock Northern Star +4%.
3. Energy (XEJ, Weekly +1.3%)
Drivers: Repeated geopolitical fluctuations in the Middle East disrupted oil prices, leading to a surge in the uranium mining sector (Paladin rose over 11% weekly), with leading oil and gas companies trending upwards.
Lagging Stocks: 1. Communication Services (XTJ, Weekly -1.75%, Weakest for the Week)
Drag: Classifieds stocks REA, Seek, and automotive e-commerce Carsales continued to weaken, with sluggish consumer spending suppressing valuations.
2. Consumer Discretionary Goods (XDJ, Weekly -1.12%)
Logic: High mortgage payments and high oil prices squeezed consumer discretionary spending, leading to a general pullback in retail, home furnishing, and gaming stocks.
3. Utilities (XUJ, Weekly -0.78%)
Characteristics: A defensive sector sensitive to interest rates; funds were cashing out before the interest rate cut was implemented, putting pressure on power and water utilities.
Outstanding Stocks: BHP Billiton rose 2.5%, hitting a new high, due to rising copper and iron ore prices. Rio Tinto rose 1.9%, also reaching a new high. Northern Star Resources surged 4% after Morningstar highlighted the possibility of selling the gold mining company.
Technical Analysis:
ASX200 Index intraday range: 8722.3-8801.2, with a slight pullback after the initial surge, closing below the 8800 level, forming a medium-sized bullish candlestick with a lower shadow, indicating a bottoming-out and rebound pattern. The index has stabilized above all moving averages across various timeframes, indicating a healthy short-term bullish structure. The ASX200 index rebounded sharply on Wednesday after testing the 50-day moving average, which has now become strong support, while the 200-day moving average serves as a mid-term bull-bear dividing line. The RSI (14) has risen steadily from the 50 level to 60, not yet entering the overbought 70 range, indicating ample upward momentum and further upside potential. The MACD's DIFF is approaching the DEA and about to form a golden cross, suggesting a potential shift from a bearish to a bullish trend. The ATR volatility is 24.8, indicating mild intraday fluctuations without extreme volume spikes, suggesting a solid upward trend. The Williams %R indicator is -9.5, nearing the short-term overbought edge, indicating potential for repeated consolidation near 8800. Meanwhile, the Reserve Bank of Australia (RBA) will hold its interest rate meeting on June 16th. If a hawkish rate hike signal is released, resources will be resilient while financial and consumer sectors will face pressure, likely leading to a high-level pullback in the index.
Trading Strategy:
Bullish Structure: A sustained move above 8750 initially targets the 8800 level; a breakout with significant volume above 8800 targets 8870-8900. Risk Signal: A close below 8710 (50-day moving average) suggests a short-term pullback to the 8680-8700 range.
Trading Approach: A bullish bias above 8750 is recommended; caution is advised near 8800, as a pullback after a surge is possible.
Key Risk Warnings:
Interest rate cut expectations benefit resource and technology growth sectors, while the lingering effects of high interest rates continue to weigh on consumer discretionary and defensive sectors like telecommunications.
Shanghai Composite Index
Basic Market Overview:
The Shanghai Composite Index rose 0.22% on Wednesday, closing at 4083 points, while the Shenzhen Component Index rose 0.73% to 15705 points. Both benchmark indices continued their upward trend from the previous trading day, with semiconductor and technology stocks continuing to support market sentiment. Investors largely ignored concerns about overvaluation of AI-related stocks, buoyed by expectations of strong earnings growth. On the economic front, a private survey showed that China's composite PMI climbed to a three-month high of 54.0 in May, primarily driven by a three-month high in the services PMI of 54.4. However, the manufacturing PMI fell to 51.8 from a five-year high of 52.2 in April, highlighting the unevenness of the country's economic momentum.
Sector Performance:
Leading Gainers: 1. Telecommunications (Optical Communication, Fiber Optic Cables, Communication Equipment) | Weekly Gain +5.5%~7%
Catalysts: Expansion of global computing power and optical cable infrastructure, overseas optical module orders, and accelerated domestic fiber optic substitution; Sub-sectors: Continued concentrated investment in optical cables, high-speed connectors, and optical devices.
2. Coal + Oil & Gas + Utilities (High-Dividend Energy) | Weekly Gain +5%~6.7%
Catalysts: Peak summer electricity demand, rising coking coal futures prices, implementation of energy supply guarantee policies, and a surge of high-dividend safe-haven funds, leading to a broad rally in thermal power and thermal coal.
3. Superhard Materials / Lab-grown Diamonds + Minor Metals (Tungsten, Industrial Raw Materials) | Weekly Gain +5%~6%
Demand for downstream industrial consumables is recovering, and overseas manufacturing is restocking, leading to a cyclical rebound in low-priced resources.
Lagging Sectors: 1. High-priced Hard Technology: Computing Servers, Semiconductors, Military Industry | Weekly Loss -5.5%~-7.6%
Profit-taking after previous consecutive gains and institutional selling at high levels led to a collective pullback in hard computing and memory chips, with funds shifting from hardware to AI software applications.
2. Leisure Consumption: Cinemas, Airports, Cultural Tourism, Education | Weekly Decline -3.5%~5%
Dragon Boat Festival peak season expectations materialized, and profit-taking led to continued weak fluctuations in the consumer services sector, lacking incremental funds.
3. Previously Popular Lithium Mines and Some Non-ferrous Metals | High-Level Retreat, Funds Shift to Lower-Level Cycles.
Technical Analysis:
The domestic A-share market in the past three days (June 1st) showed: June 1st bearish doji → June 2nd long lower shadow bullish candlestick → June 3rd small bullish candlestick with a pullback after a rise. The two consecutive lower shadow candlesticks formed a low-level bottoming pattern, indicating weakening momentum from the previous continuous correction and reduced selling pressure, suggesting a short-term consolidation and recovery phase. On June 3rd, the market tested the 4107 resistance level before falling back, constrained by overhead resistance, and the rebound was not a strong one-sided upward movement. The 5/10/20/30-day moving averages are in a bearish alignment, putting downward pressure on the index, indicating significant short-term pressure. The 60-day moving average (around 4055 points) and the 120-day moving average (around 4030 points) form a strong medium-term support zone. The index has repeatedly tested this range and quickly recovered, making it the current lifeline for both bulls and bears. Currently, there is extreme structural divergence: heavyweight stocks are supporting the index, while most small and mid-cap stocks are weak. Index fluctuations do not equate to a broad-based rally. Funds are concentrated in heavyweight sectors such as power, coal, telecommunications, and low-priced hardware, while small-cap stocks are still consolidating at low levels.
Trading Strategy (Primarily Short-Term):
The Shanghai Composite Index has strong support at 4050 points and strong short-term resistance at 4110 points. Reduce overall positions if it falls below 4050, and add small positions if it breaks above 4110. No single stock position should exceed 15% of total funds; avoid full positions in a single sector. Do not open new positions in high-priced speculative stocks (short-term gains exceeding 30%); only realize profits and exit.
Risk Warning:
Early June will see a continuation of the high-low rotation: high-flying technology stocks will consolidate to digest profit-taking, while low-flying resource, telecommunications, and consumer blue-chip stocks will continue their rotational recovery; after the Fed's interest rate decision in mid-June, the market will choose its direction, with a predominantly volatile pattern and unlikely to see any unilateral surges or plunges.
Disclaimer: The information contained herein (1) is proprietary to BCR and/or its content providers; (2) may not be copied or distributed; (3) is not warranted to be accurate, complete or timely; and, (4) does not constitute advice or a recommendation by BCR or its content providers in respect of the investment in financial instruments. Neither BCR or its content providers are responsible for any damages or losses arising from any use of this information. Past performance is no guarantee of future results.
Lebih Liputan


Pendedahan Risiko:Instrumen derivatif diniagakan di luar bursa dengan margin, yang bermakna ia membawa tahap risiko yang tinggi dan terdapat kemungkinan anda boleh kehilangan seluruh pelaburan anda. Produk-produk ini tidak sesuai untuk semua pelabur. Pastikan anda memahami sepenuhnya risiko dan pertimbangkan dengan teliti keadaan kewangan dan pengalaman dagangan anda sebelum berdagang. Cari nasihat kewangan bebas jika perlu sebelum membuka akaun dengan BCR.
BCR Co Pty Ltd (No. Syarikat 1975046) ialah syarikat yang diperbadankan di bawah undang-undang British Virgin Islands, dengan pejabat berdaftar di Trident Chambers, Wickham’s Cay 1, Road Town, Tortola, British Virgin Islands, dan dilesenkan serta dikawal selia oleh Suruhanjaya Perkhidmatan Kewangan British Virgin Islands di bawah Lesen No. SIBA/L/19/1122.
Open Bridge Limited (No. Syarikat 16701394) ialah syarikat yang diperbadankan di bawah Akta Syarikat 2006 dan berdaftar di England dan Wales, dengan alamat berdaftar di Kemp House, 160 City Road, London, England, EC1V 2NX. Open Bridge Limited bertindak semata-mata sebagai pemproses pembayaran untuk BCR Co Pty Ltd dan tidak menyediakan sebarang perkhidmatan kewangan, perdagangan atau pelaburan bagi pihaknya. Peranan Open Bridge Limited adalah terhad kepada pemprosesan pembayaran.

 English
 简体中文
简体中文
 繁體中文
繁體中文
 Bahasa
Melayu
Bahasa
Melayu
 Tiếng
Việt
Tiếng
Việt
 ไทย
ไทย
 日本語
日本語
 한국어
한국어
 ភាសាខ្មែរ
 español