


0
US Dollar Index
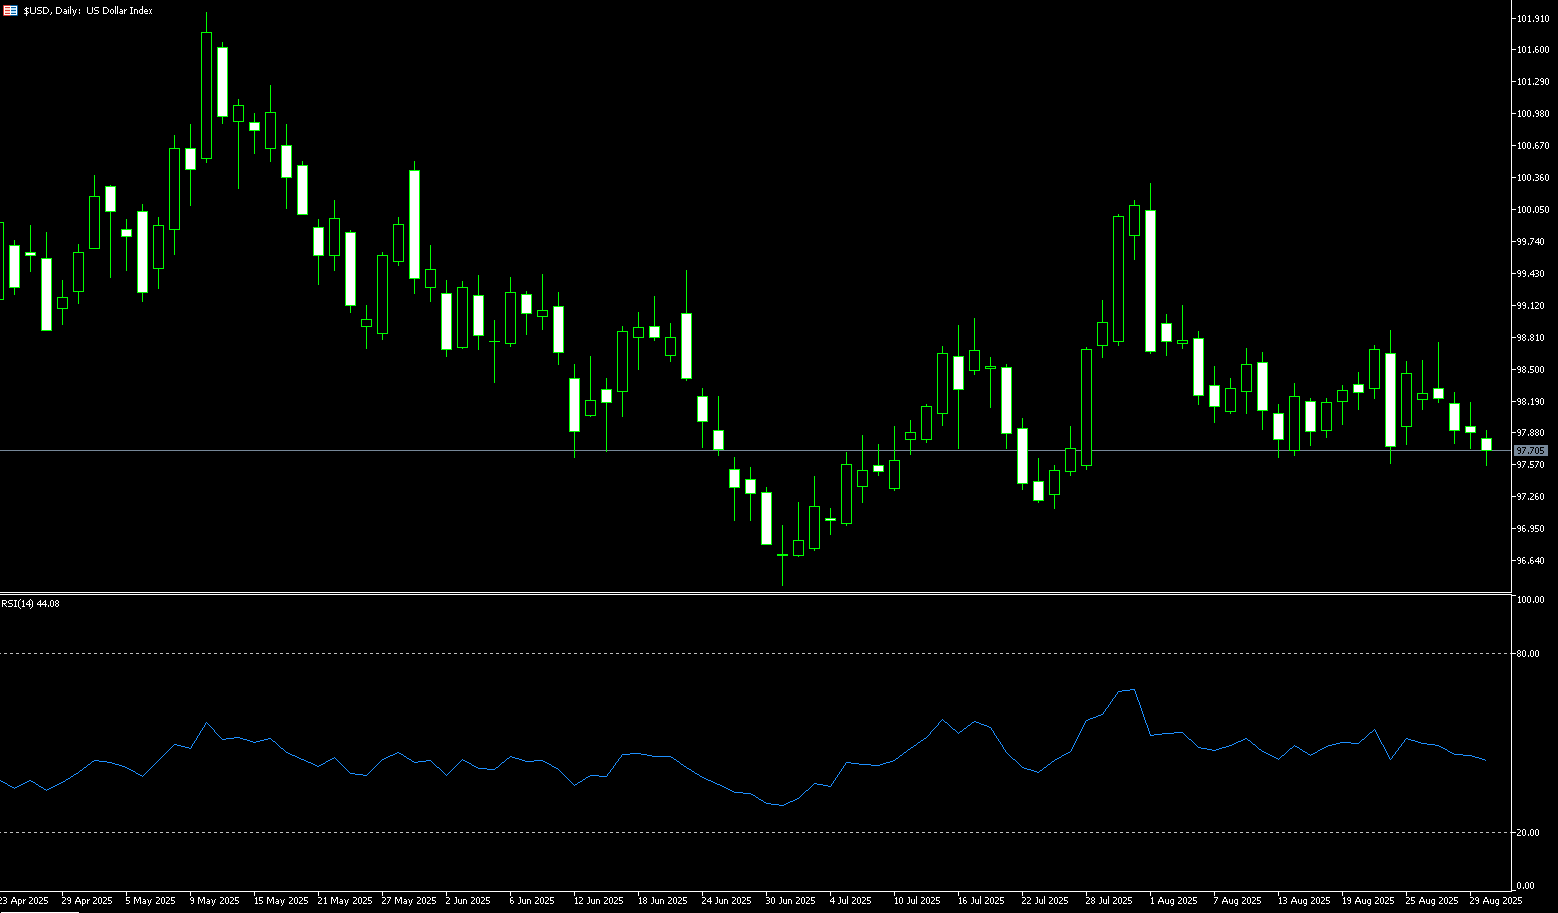
The US dollar index fell to around 97.60 on Monday, sliding towards a one-month low, as traders awaited a slew of labor market data this week that could shape the Federal Reserve's next policy decision. Key reports include Friday's August employment data, as well as data on the unemployment rate, job openings, and private payrolls. Investors also weighed Friday's PCE price index, which confirmed ongoing price increases and added uncertainty to the outlook for rate cuts. Nevertheless, the market is pricing in a roughly 88% probability of a 25 basis point rate cut by the Federal Reserve later this month. On the trade front, a federal appeals court ruled that most of President Trump's tariffs were illegal, giving the government until October 14th to appeal to the U.S. Supreme Court. Trading activity is expected to be limited as U.S. markets will be closed for the Labor Day holiday.
The US dollar index chart is not bullish for the greenback. If the index falls below the multi-year low of 96.38 reached on July 1, the next steps could be 95.13 and 94.62. On the other hand, the 100-day simple moving average at 98.76 presents the first major hurdle. A clean breakout would pave the way for the 90.00 round-figure mark. Currently, the index remains below its 100-day and 9-day simple moving averages, at 98.76 and 98.17, respectively, maintaining its overall downside bias. Technical indicators support this view: the Relative Strength Index (RSI) has fallen to around 45, indicating waning bullish momentum, while the Average Directional Index (ADX) is near 11, suggesting a lack of a strong trend. Therefore, short-term support targets the seven-week low of 97.11 reached on July 24, followed by the 97.00 round-figure mark.
Consider shorting the US Dollar Index at 97.86 today, with a stop-loss at 97.98 and a target at 97.40 or 97.30.
WTI Spot Crude Oil
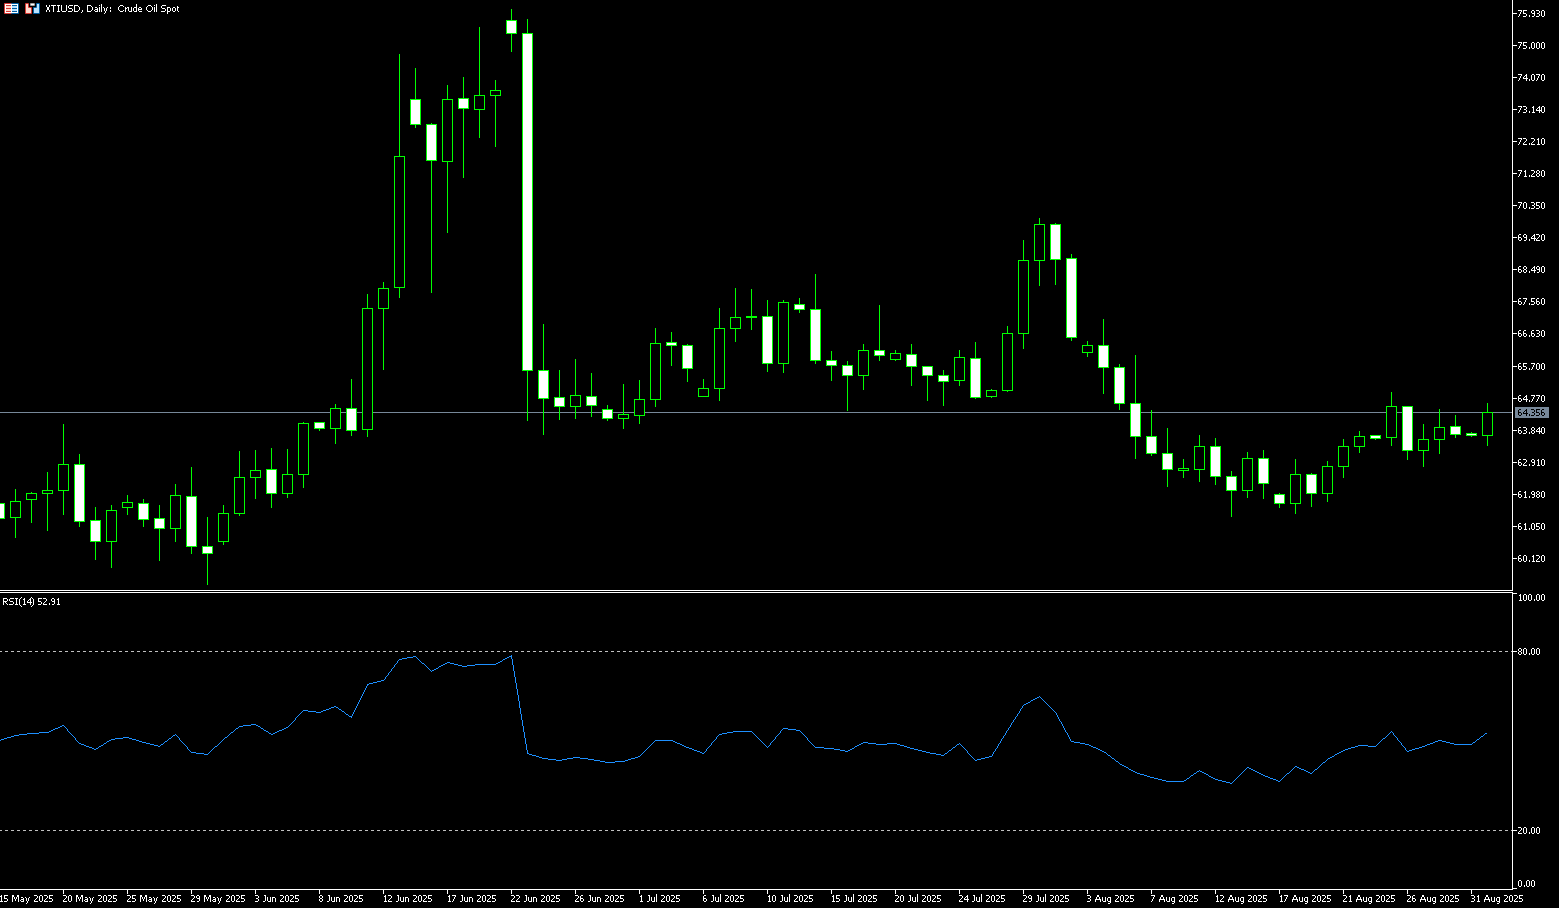
WTI crude oil futures rose to around $64.40 per barrel on Monday, rebounding from earlier losses, primarily due to concerns about supply disruptions caused by the ongoing Russia-Ukraine conflict. Ukrainian President Volodymyr Zelenskyy has pledged to expand strikes on Russian territory following a drone attack on Ukrainian power facilities, raising concerns about further disruptions to regional energy flows. Traders are also assessing whether India will succumb to US pressure and end Russian oil purchases after Washington imposed secondary tariffs on New Delhi last week. However, these geopolitical risks are being offset by potential oversupply and a weak demand outlook. Investors are awaiting the OPEC+ meeting later this week, where the group is accelerating production increases, raising the global supply outlook.
Currently, oil prices are caught in a tug-of-war: geopolitical tensions and declining Russian exports provide support, but record US production and weakening Asian economies increase downside risks. Oil prices are likely to remain range-bound in the short term, with the September OPEC+ meeting and US jobs data providing key catalysts to break the deadlock. From the daily chart, US crude oil is range-bound between $61.45 (the low on August 18) and $65.76 (the 50.0% Fibonacci retracement level between $54.78 and $76.74). The short-term medium- and short-term moving averages are converging, indicating a continued struggle between bulls and bears. The 14-day Relative Strength Index (RSI) is hovering around 47-49, suggesting a lack of clear directional momentum. If oil prices can successfully break through the $65.76 resistance level, they could potentially head towards the $67.04 (200-day moving average). However, if they fall below the $63.00 support level, they could retest the $61.45 (the low on August 18) and the $60 (a psychologically important market level).
Consider going long on crude oil at 64.20 today. Stop-loss: 64.05, target: 65.40, 65.60.
Spot Gold
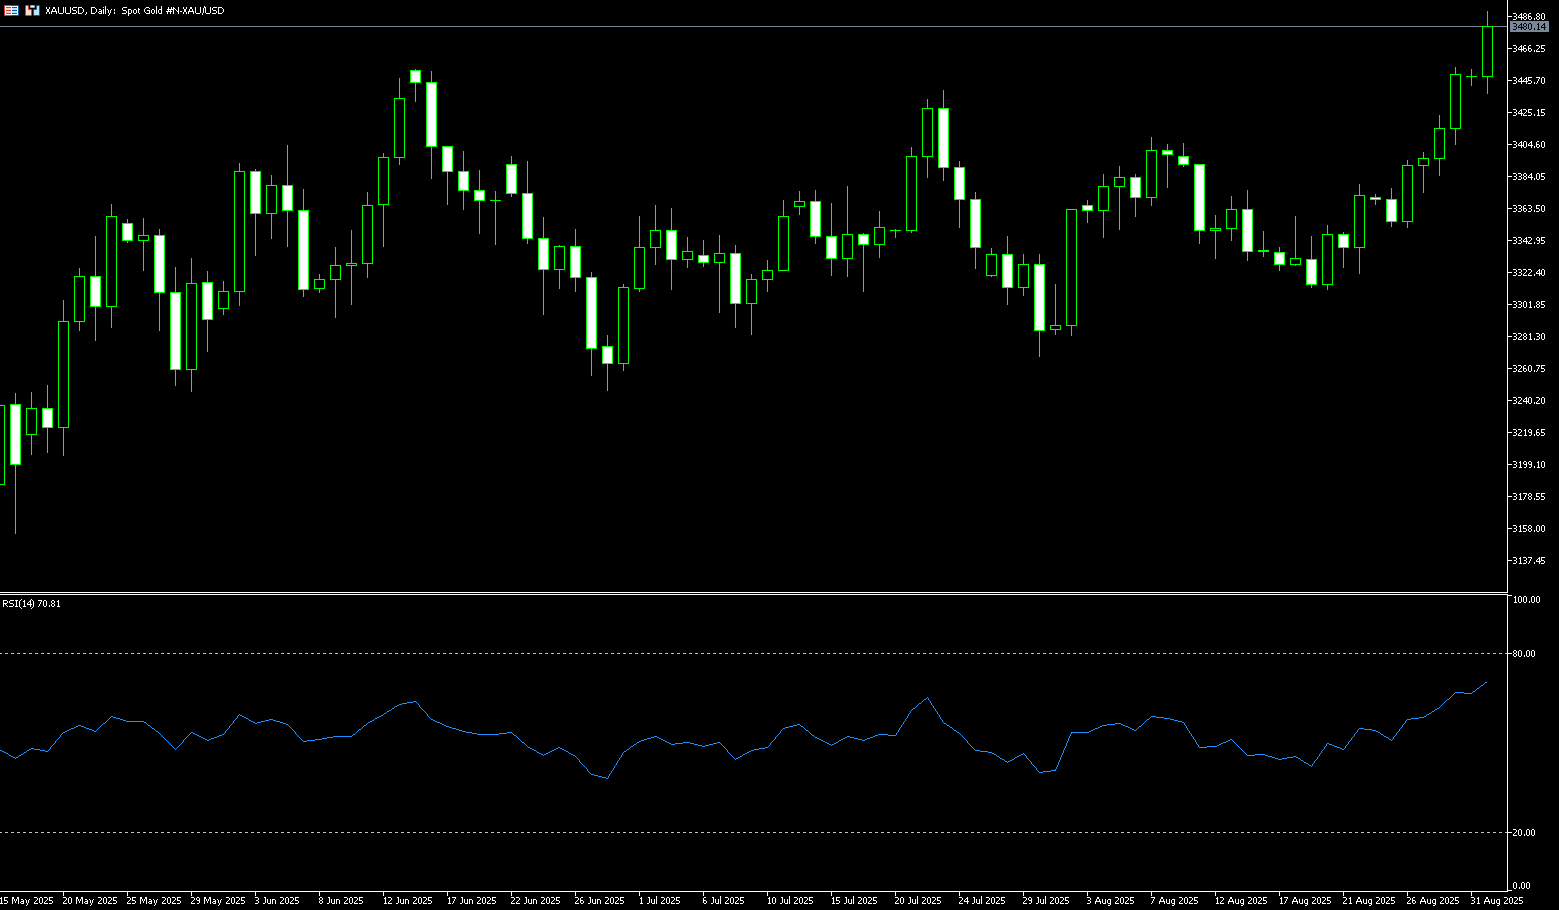
On Monday, spot gold traded around $3,476/oz. Earlier, the price reached a four-month high of $3,490.00/oz, as US inflation data reinforced expectations of a possible Federal Reserve rate cut in September. The spot gold market showed strong upward momentum, rising 4.81% in August. Market sentiment was driven by rising expectations of a Fed rate cut, a weakening US dollar, and safe-haven demand stemming from Trump's tariff policies. While tensions over the Russia-Ukraine situation briefly boosted gold prices, reports of ceasefire negotiations have eased concerns slightly. The upcoming US August non-farm payroll data will be a key focus next week and may further influence gold prices. Furthermore, Trump's imposition of a 50% tariff on Indian goods has fueled concerns about a global economic slowdown, further enhancing gold's safe-haven appeal. US PCE inflation data met expectations, solidifying expectations for a September rate cut by the Federal Reserve, providing further momentum for gold prices.
Gold pared losses last week after finding support above $3,400, rebounding to around $3,490, its highest level in over four months. Currently, the upper Bollinger Band level at $3,422.80 is acting as immediate support. Further support lies at $3,400 (round-number mark) and the 20-day simple moving average around $3,372. The 14-day Relative Strength Index (RSI) on the daily chart is hovering near 65 and remains firmly in bullish territory, suggesting continued buying as long as $3,400 support holds. On the upside, the rally extended to around $3,490, the early-week high, potentially breaking through to the previous all-time high of $3,500. Further tests of $3,550 and $3,600 are possible. Conversely, a break below $3,400 could put gold at risk of testing its 20-day simple moving average around $3,372, a range of strong technical support.
Consider a long position on gold at $3,473 today, with a stop-loss at $3,470 and a target of $3,490 or $3,495.
AUD/USD
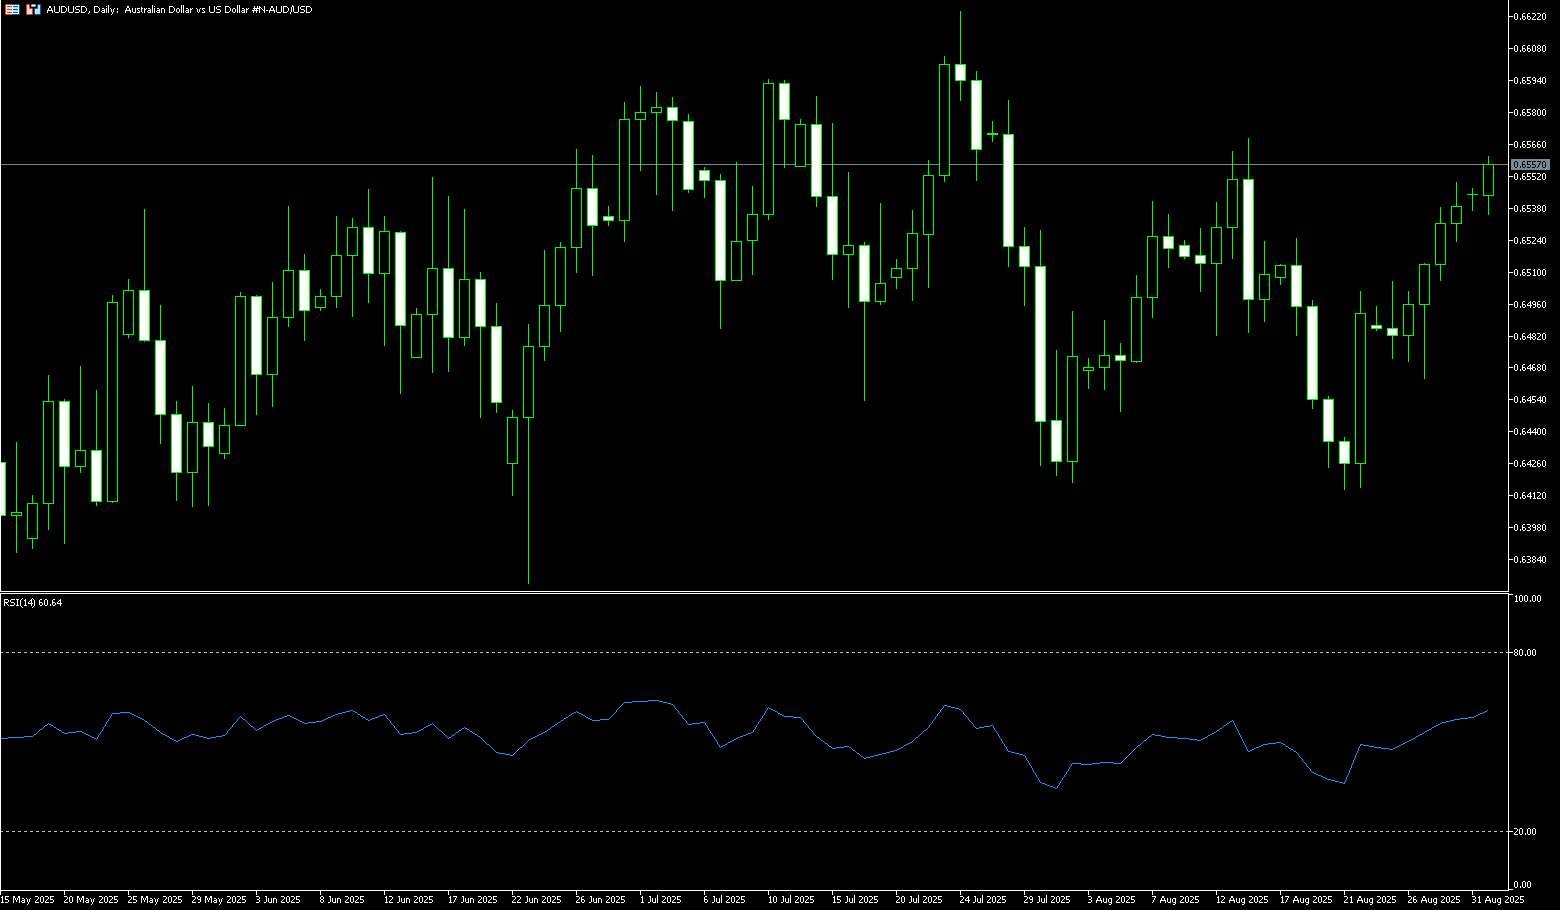
AUD/USD continued its upward trend on Monday, approaching $0.6550. Traders increased bets on a Federal Reserve rate cut at its September meeting, putting pressure on the US dollar. Data released Sunday by China's National Bureau of Statistics (NBS) showed that the manufacturing Purchasing Managers' Index (PMI) rose to 49.4 in August from 49.3 in July. This reading was lower than the market expectation of 49.5 and marked the fifth consecutive month of decline. The lack of a more pronounced rebound in the manufacturing sector raises the prospect of an economic slowdown, which could weaken the Australian dollar in Australia, a major trading partner of China. On the other hand, rising bets on a Fed rate cut and dovish rhetoric from Fed officials could drag the US dollar lower and provide support for the currency pair in the short term.
Technical analysis on the daily chart shows that AUD/USD is currently trading slightly above its ascending trendline, indicating a dominant bullish bias. Furthermore, the exchange rate is trading above the 9-day SMA of 0.6493 and the psychologically important 0.6500 level, indicating strong short-term price momentum. Meanwhile, the 14-day Relative Strength Index (RSI) is near 57, significantly above its midline, suggesting a dominant bullish bias. Therefore, on the upside, AUD/USD could test the monthly high of 0.6568 reached on August 14, and then challenge the nine-month high of 0.6625 reached on July 24. On the downside, initial support lies at 0.6500, a psychologically important level, and the 9-day SMA of 0.6493. A break below this critical support level would trigger bearish sentiment and could lead the pair to test the 110-day SMA of 0.6458.
Consider a long AUD at 0.6540 today, with a stop loss of 0.6530 and targets of 0.6585 and 0.6595.
GBP/USD
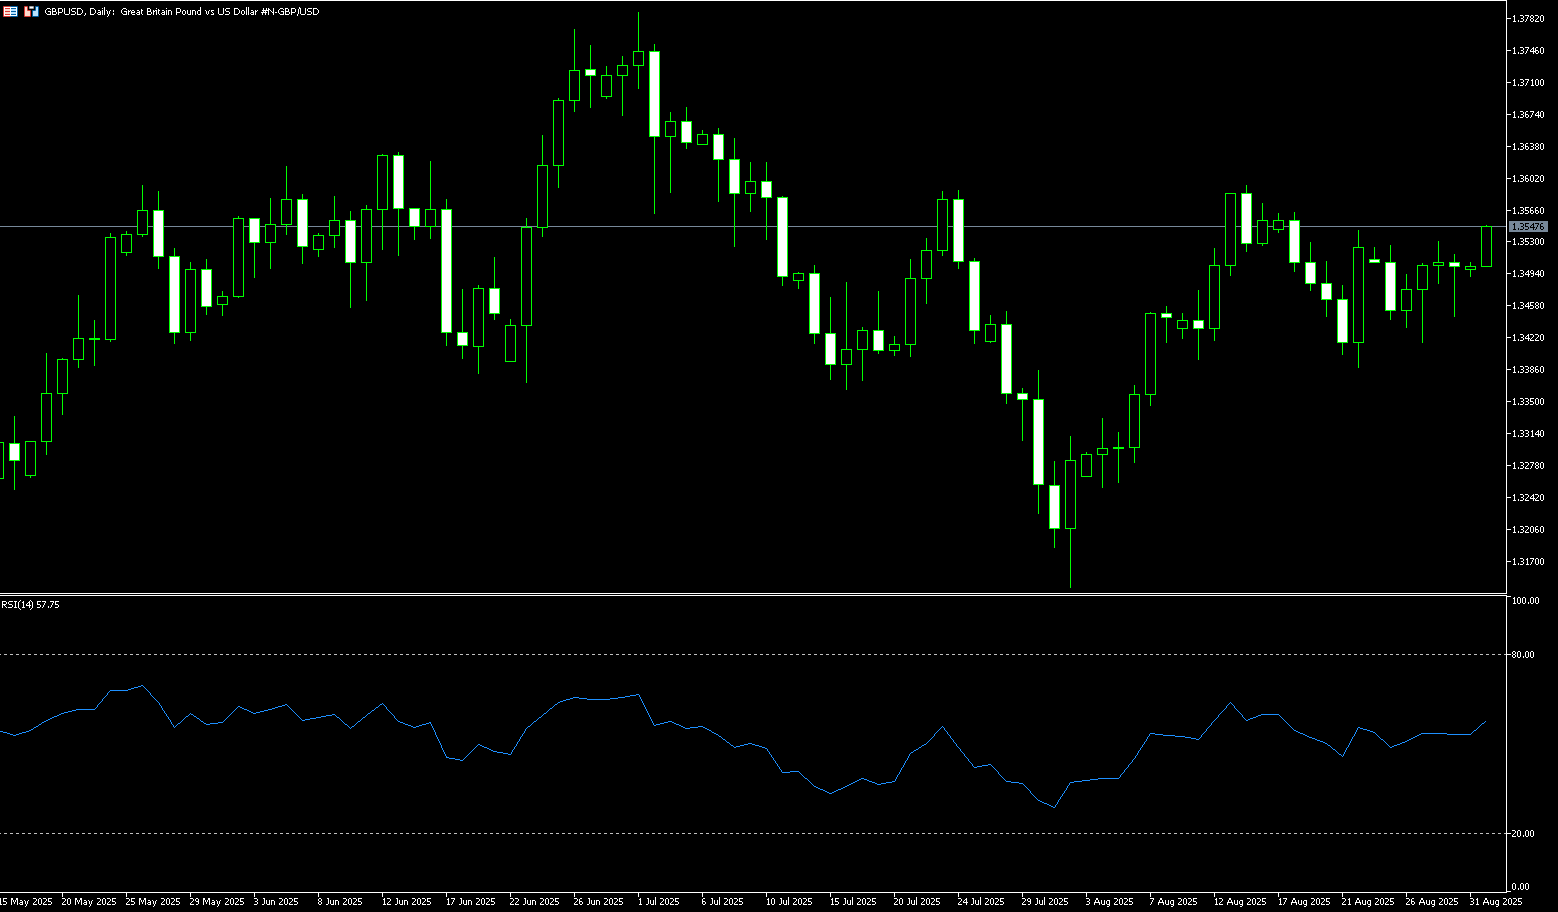
GBP/USD started the new week on a positive note, holding firmly above the psychological 1.3500 level during the Asian session. Furthermore, the fundamental backdrop suggests that the path of least resistance for spot prices lies to the upside. The Bank of England's cautious rate cut last month diverged significantly from the growing acceptance that the Federal Reserve will cut at least two rates by the end of the year. This, in turn, has been a significant factor in the pound's relative strength against its US counterpart and validated the positive short-term outlook for the GBP/USD pair. However, a modest USD rally could pose resistance to the pair. Traders also appear hesitant, opting to await the release of key US macroeconomic data early this week to confirm the next directional move. Therefore, it would be wise to wait for some follow-on buying before making new bullish bets on the GBP/USD pair and positioning for further appreciation.
GBP/USD briefly dipped to around 1.3446 late last week. At the start of this week, the overall trend was upward, retracing above the 1.3500 round-figure mark, and the pair has remained sideways at this high level. The pair is currently forming a head-and-shoulders bottom pattern on the daily chart, which often signals a bullish reversal after a correction or decline. The neckline of this pattern is currently located around 1.3580. The 14-day Relative Strength Index (RSI) has rebounded and is now hovering above 50. Initial resistance lies at 1.3580 (the neckline of the head-and-shoulders bottom), followed by 1.3600 (a psychological barrier), with a break below this level targeting 1.3662 (the July 7 high). On the downside, the August 28 low of 1.3446 will constitute key support, followed by a test of the August 11 low of 1.3400 and the August 7 low of 1.3345.
Consider going long on the British pound at 1.3533 today, with a stop loss of 1.3520 and targets of 1.3580 and 1.3590.
USD/JPY
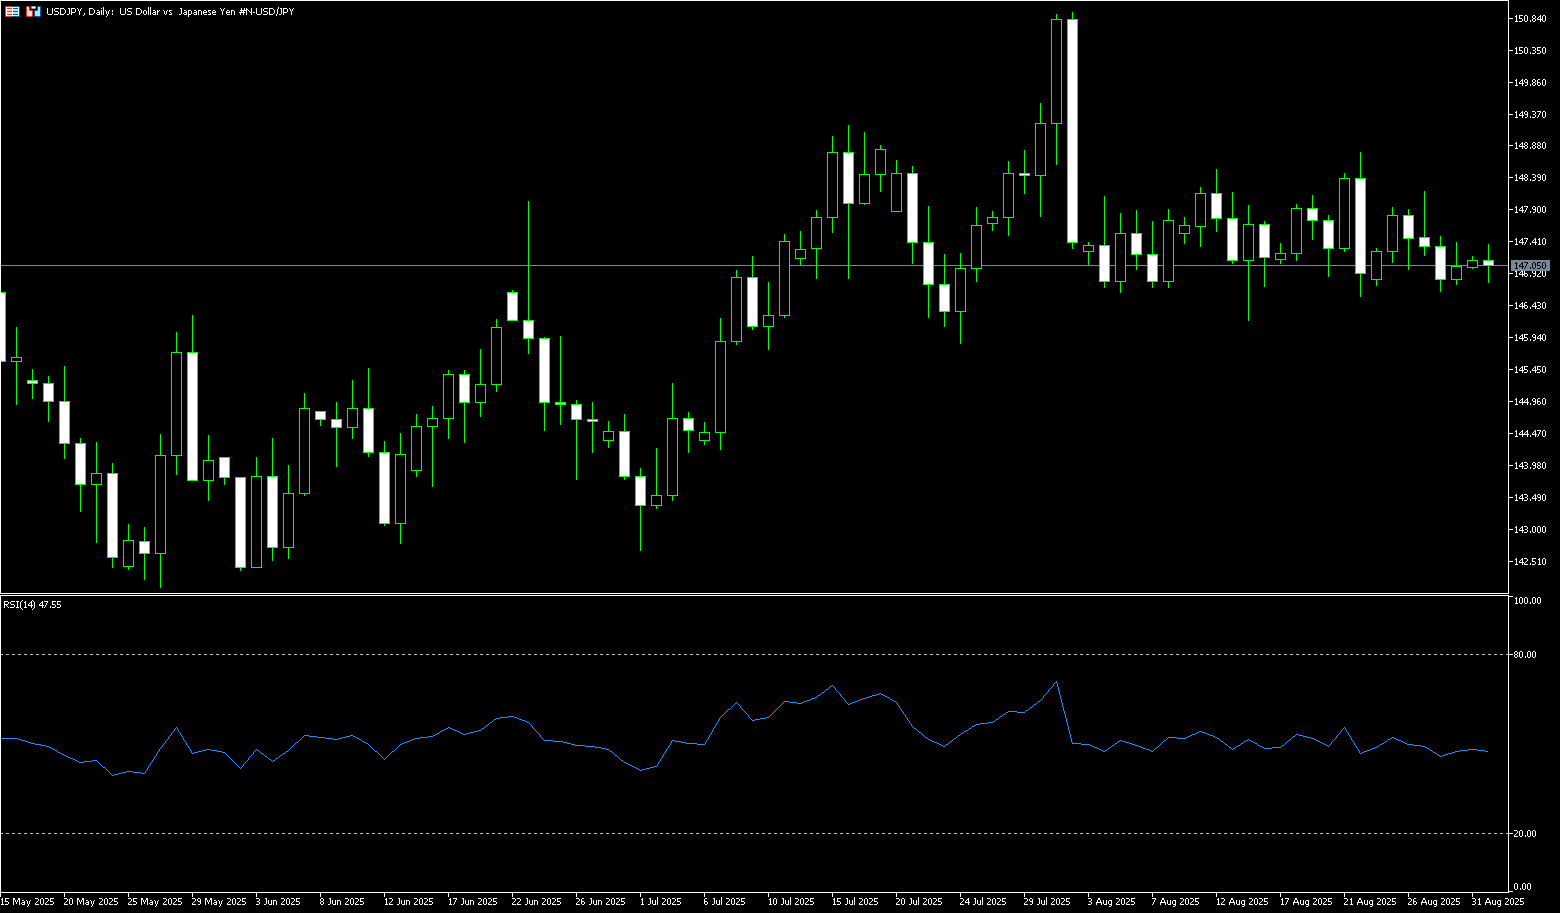
USD/JPY traded at 147.00 on Monday. The yen weakened against the dollar as inflationary pressures in Japan weakened, weakening market bets on another Bank of Japan rate hike this year. Traders awaited the release of the US ISM Manufacturing Purchasing Managers' Index (PMI) report on Tuesday, followed by the highly anticipated US non-farm payroll data. According to the Tokyo Consumer Price Index, inflation in Japan grew at a moderate pace in August. Signs of slowing inflation are prompting traders to reduce bets on a Bank of Japan rate hike, which could put pressure on the yen in the short term. On the dollar side, the US personal consumption expenditures report showed that US inflation remained stable in July, but remained above the Federal Reserve's 2% target. Expectations are increasing that the Fed will cut interest rates at its September meeting. This, in turn, could weaken the USD/JPY exchange rate.
The daily chart shows that USD/JPY is currently trading around 147, slightly below the central axis of the Bollinger Band at 147.49, reflecting a "lower edge retracement in a weak oscillation." The recent high of 150.92 and the previous low of 146.68 form the upper and lower boundaries of the medium- and long-term range. After hitting 150.920, the price retreated and entered the horizontal channel of 146-149. The MACD, one of the technical indicators, shows that the upward momentum has cooled significantly and has shown the characteristics of "continuation after a weak death cross." The momentum is bearish but not extreme. The RSI (14) is at 47, which is in the neutral and weak zone below 50. It does not constitute oversold, indicating that the selling pressure is orderly and mainly uses the "time-for-space" of the "consolidation market." Support lies at the 146.00 round-number mark and the 100-day moving average at 145.58. On the upside, Wednesday's bearish "shooting star" high of 148.18, formed earlier this month, will act as key resistance for the pair's rebound. Earlier this month, the 148.78 high (August 22) also triggered a sharp reversal. Just above this high lies the 200-day moving average at 148.92 and resistance at 149.00.
Consider shorting the US dollar at 147.38 today. Stop loss: 147.60, target: 146.40, 146.30.
EUR/USD
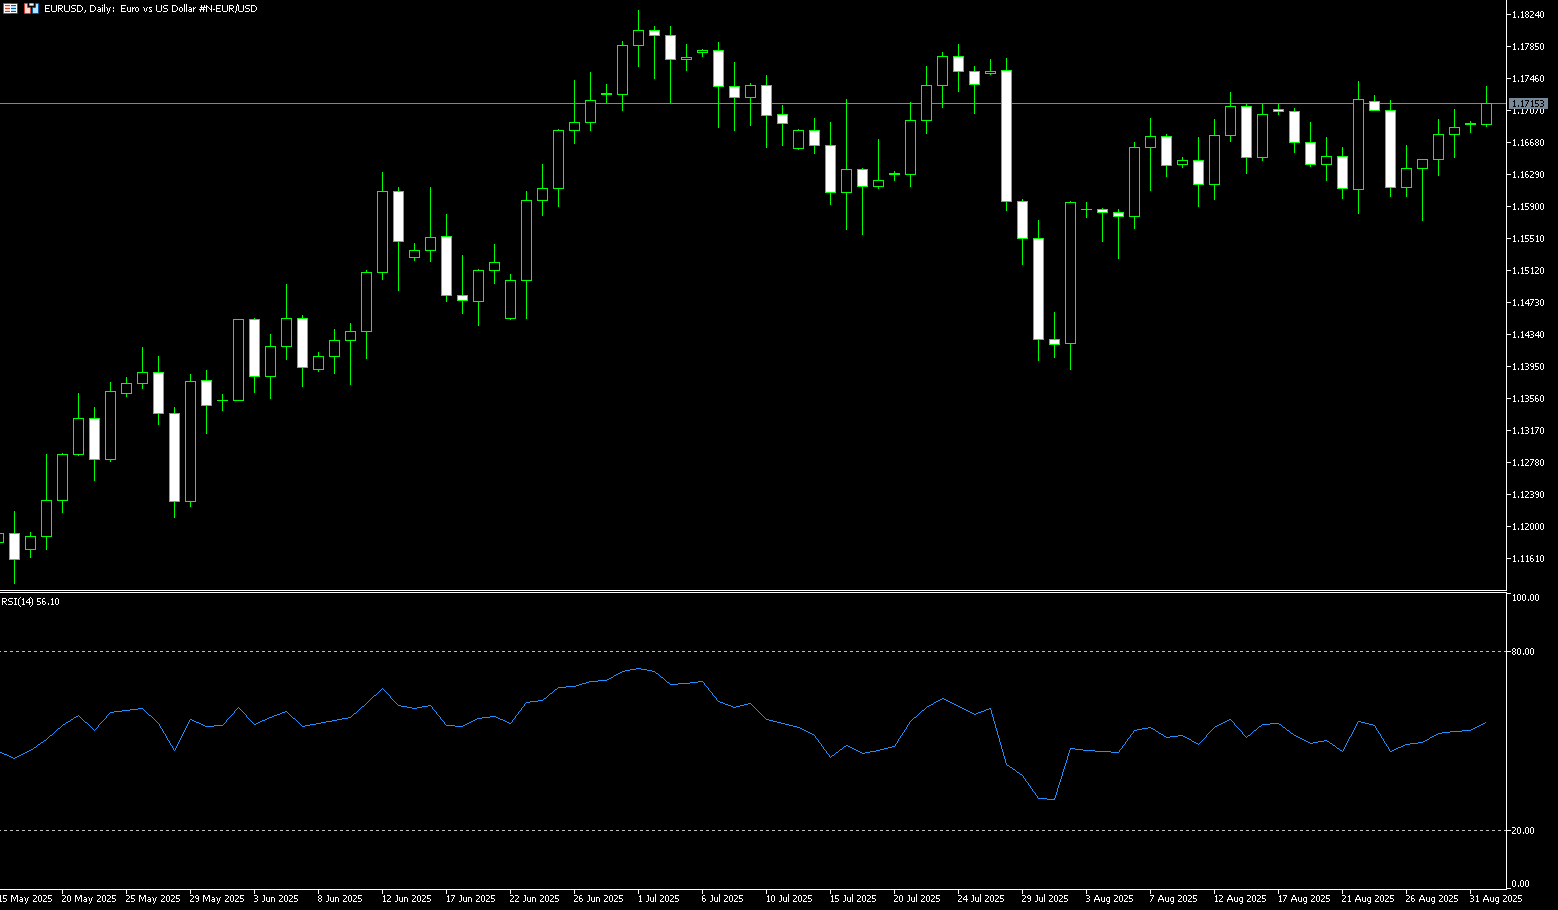
EUR/USD extended its gains for the fifth consecutive trading day on Monday, trading around 1.1700. The pair's appreciation has been fueled by rising expectations of a rate cut by the Federal Reserve at its September meeting, as the US dollar faces challenges. US markets will observe the Labor Day holiday on Monday. Furthermore, Federal Reserve Governor Christopher Waller reiterated his support for rate cuts last Thursday, indicating he would consider a deeper cut if labor market data continues to weaken. Rising expectations of a Fed rate cut and dovish rhetoric from Fed officials could drag the US dollar lower and provide support for the currency pair in the short term. Inflation faces further downside risks due to a stronger euro, falling energy prices, and slowing core inflation, compounded by the damage inflicted by trade policy on the global economy.
From a technical perspective, EUR/USD has made little progress. The daily chart shows that the 20-day simple moving average of 1.1660 provides early-week support. EUR/USD has closed above this level for most of August. A break below this level would quickly trigger renewed short-selling. This could push EUR/USD down to the 1.1600 round-figure mark, with a break targeting the 80-day simple moving average of 1.1558. The 14-day Relative Strength Index (RSI) technical indicator is hovering around 53, slightly rising within positive territory but failing to confirm a sustained uptrend. It offers no clear directional clues. The pair needs to break above 1.1742 (August 22 high). Further gains would expose 1.1830 (the yearly high).
Consider a long position on the euro at 1.1700 today, with a stop loss of 1.1688 and a target of 1.1750 or 1.1760.
Disclaimer: The information contained herein (1) is proprietary to BCR and/or its content providers; (2) may not be copied or distributed; (3) is not warranted to be accurate, complete or timely; and, (4) does not constitute advice or a recommendation by BCR or its content providers in respect of the investment in financial instruments. Neither BCR or its content providers are responsible for any damages or losses arising from any use of this information. Past performance is no guarantee of future results.
Lebih Liputan


Pendedahan Risiko:Instrumen derivatif diniagakan di luar bursa dengan margin, yang bermakna ia membawa tahap risiko yang tinggi dan terdapat kemungkinan anda boleh kehilangan seluruh pelaburan anda. Produk-produk ini tidak sesuai untuk semua pelabur. Pastikan anda memahami sepenuhnya risiko dan pertimbangkan dengan teliti keadaan kewangan dan pengalaman dagangan anda sebelum berdagang. Cari nasihat kewangan bebas jika perlu sebelum membuka akaun dengan BCR.

 English
 简体中文
简体中文
 繁體中文
繁體中文
 Bahasa
Melayu
Bahasa
Melayu
 Tiếng
Việt
Tiếng
Việt
 ไทย
ไทย
 日本語
日本語
 한국어
한국어
 ភាសាខ្មែរ
 español