


0
US Dollar Index
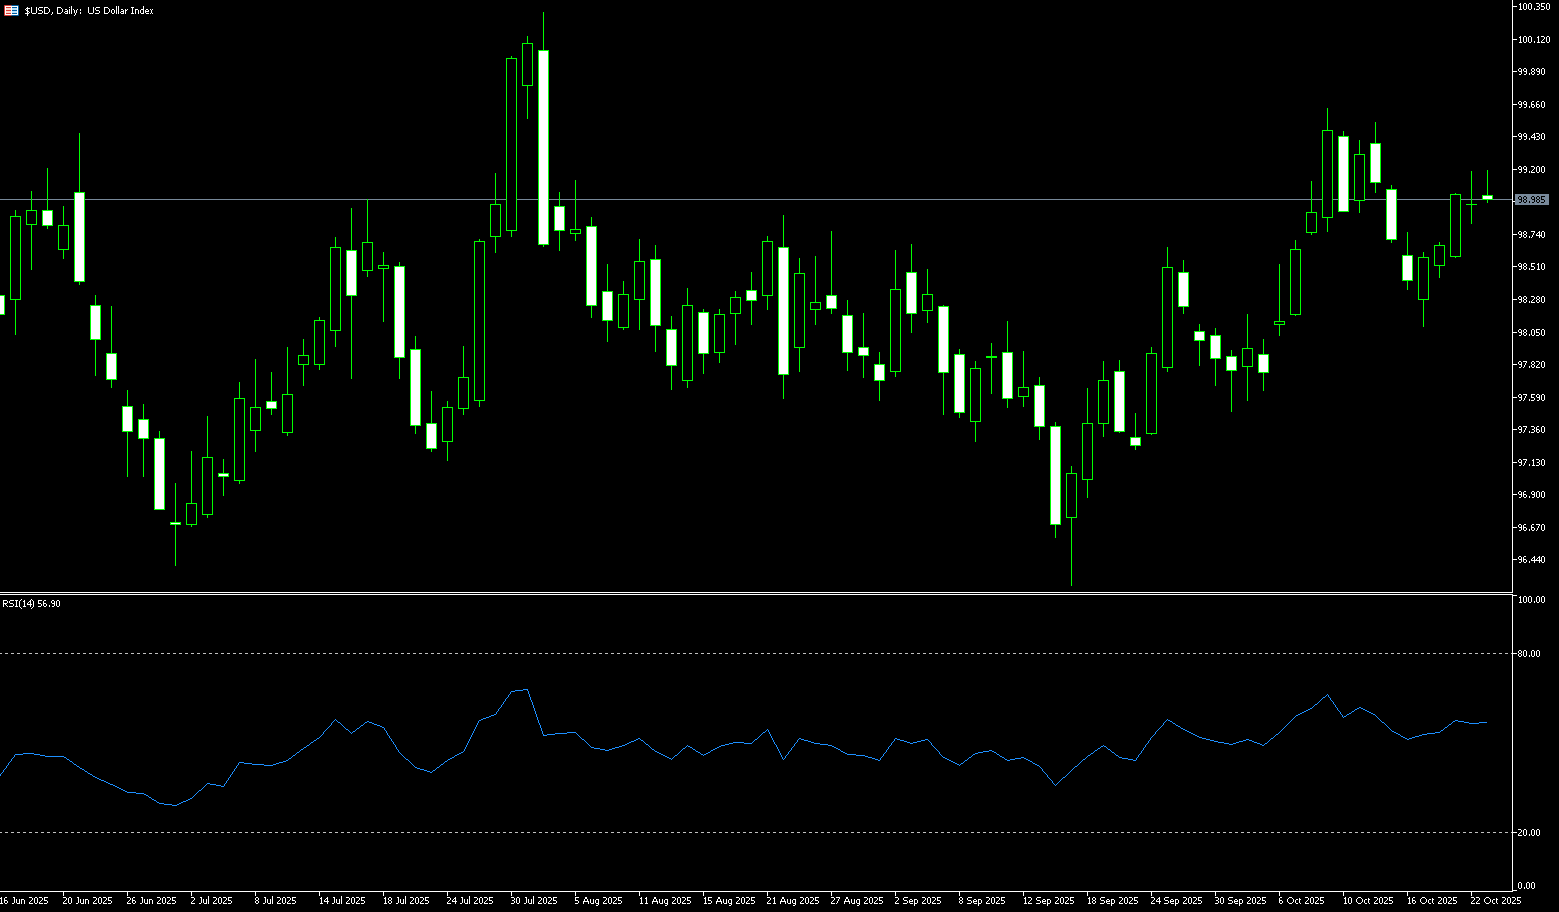
On Thursday, the US dollar index traded in a narrow range at a high level, near 99.00. The recent rally paused near key support levels. Due to the interruption of economic data releases caused by the US government shutdown, traders are cautious. Friday's delayed CPI report will be the next key factor in determining market trends. As traders adjust their positions for Friday's inflation data, US Treasury yields remain stable. The benchmark 10-year Treasury yield remained steady near 3.974%, while the 2-year and 30-year Treasury yields were flat at 3.457% and 4.549%, respectively. With all other economic reports suspended, CPI data will be the sole driver of interest rate expectations until the Federal Reserve meeting on October 29. Currently, the US dollar index remains stable above 98.00 and, with no new data to drive the market, is expected to remain range-bound. Traders will view Friday's CPI data as the next catalyst for volatility.
The US Dollar Index remains range-bound between 98.12 (100-day SMA) and 99.52 (170-day SMA), forming a tight structure. The recent rebound from 97.46, the previous high at the beginning of the month, demonstrates defensive strength, but upward progress has stalled. The US Dollar Index is balancing low volatility against unconfirmed fundamentals: a classic prelude to an eventual market rebound once clarity emerges. Therefore, upside targets include 99.52 (170-day SMA) and 100.00 (psychological level). On the downside, key levels to watch include 98.52 (20-day SMA) and 98.12 (100-day SMA).
Consider shorting the US Dollar Index at 99.08 today. Stop-loss: 99.20. Targets: 98.50, 98.45.
WTI Spot Crude Oil
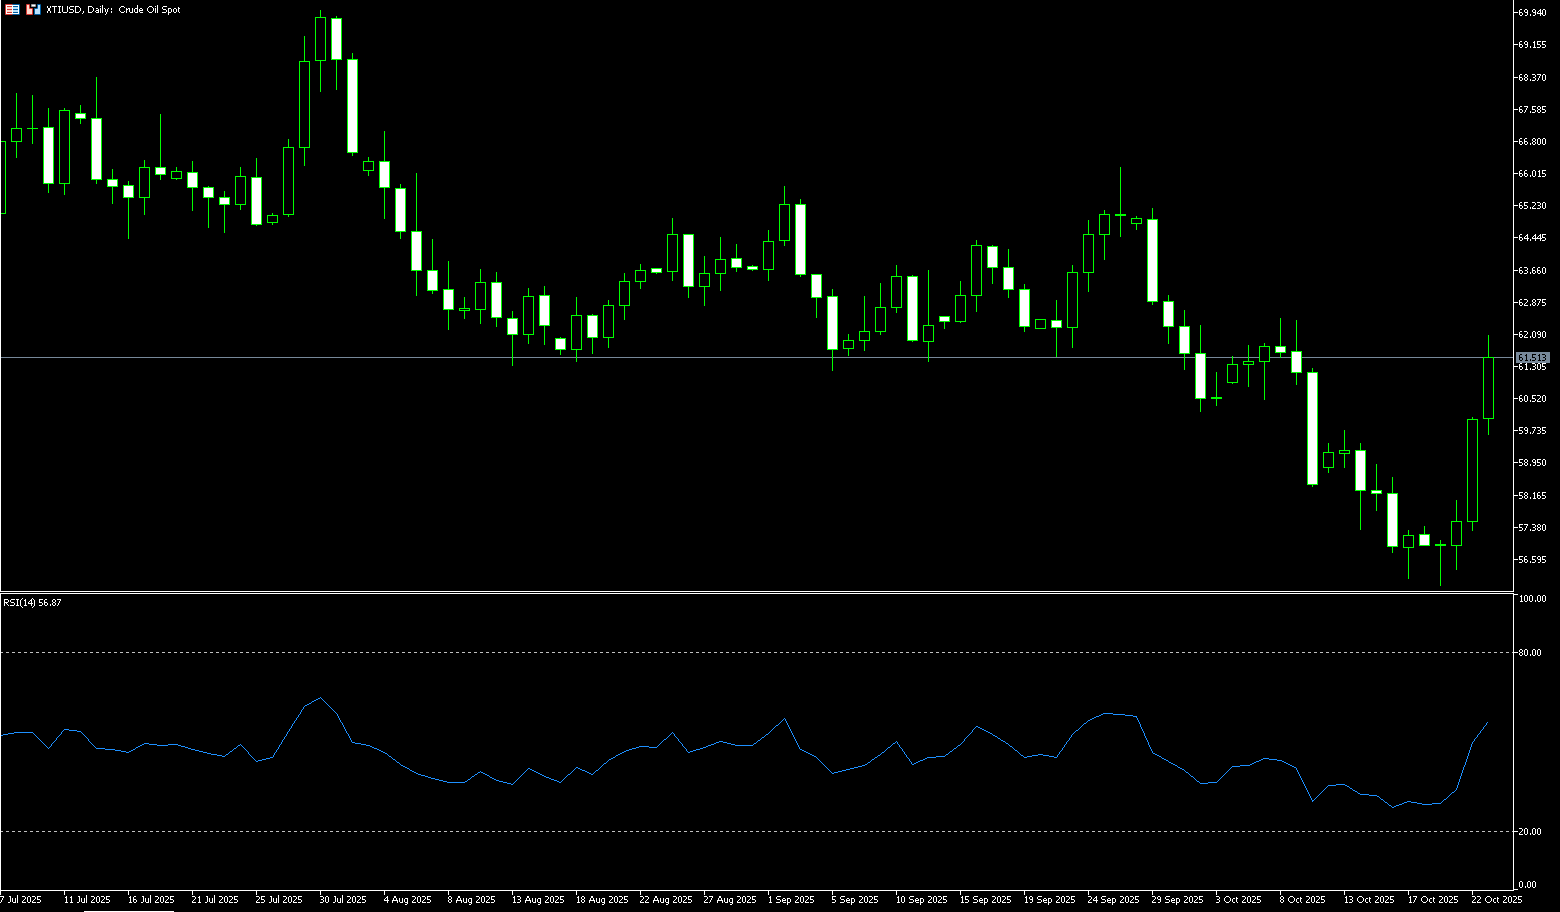
WTI crude oil rose over 4.5% on Thursday to over $61.50 per barrel, reaching a two-week high, after the United States announced sanctions on major Russian oil companies. These sanctions are intended to increase pressure on the Kremlin to fulfill its commitments regarding Ukraine. Rosneft and Lukoil, led by Putin ally Igor Sechin, together account for nearly half of Russia's oil exports, approximately 2.2 million barrels per day, and oil and gas revenues account for approximately a quarter of the federal budget. Following the sanctions, Trump stated he would pressure major buyers and planned to discuss Russian oil imports with Chinese President Xi Jinping next week, reiterating that India would reduce purchases. EU member states have approved their 19th round of sanctions against Russia, including a ban on Russian liquefied natural gas imports.
The trend of US crude oil is consistent with previous analysis. Looking at the 8-hour chart, after falling to the lower limit of the price range at $56, prices began to rebound. They have now rebounded above the upper resistance level of the price range at around $58.90, mirroring the trend seen from April to June. If prices break above the $58.90 (upper limit) to $59.00 (round mark), they are expected to rebound to $61.36 (the 100-period simple moving average on the 8-hour chart). Short-term targets include $62.50 (the high on October 8), and then $63.00 (the round mark). Downward support areas include $60.00 (a psychological barrier) and $59.59 (Thursday's low).
Consider going long on crude oil at 61.30 today. Stop-loss: 61.15, target: 62.00, 62.30.
Spot Gold
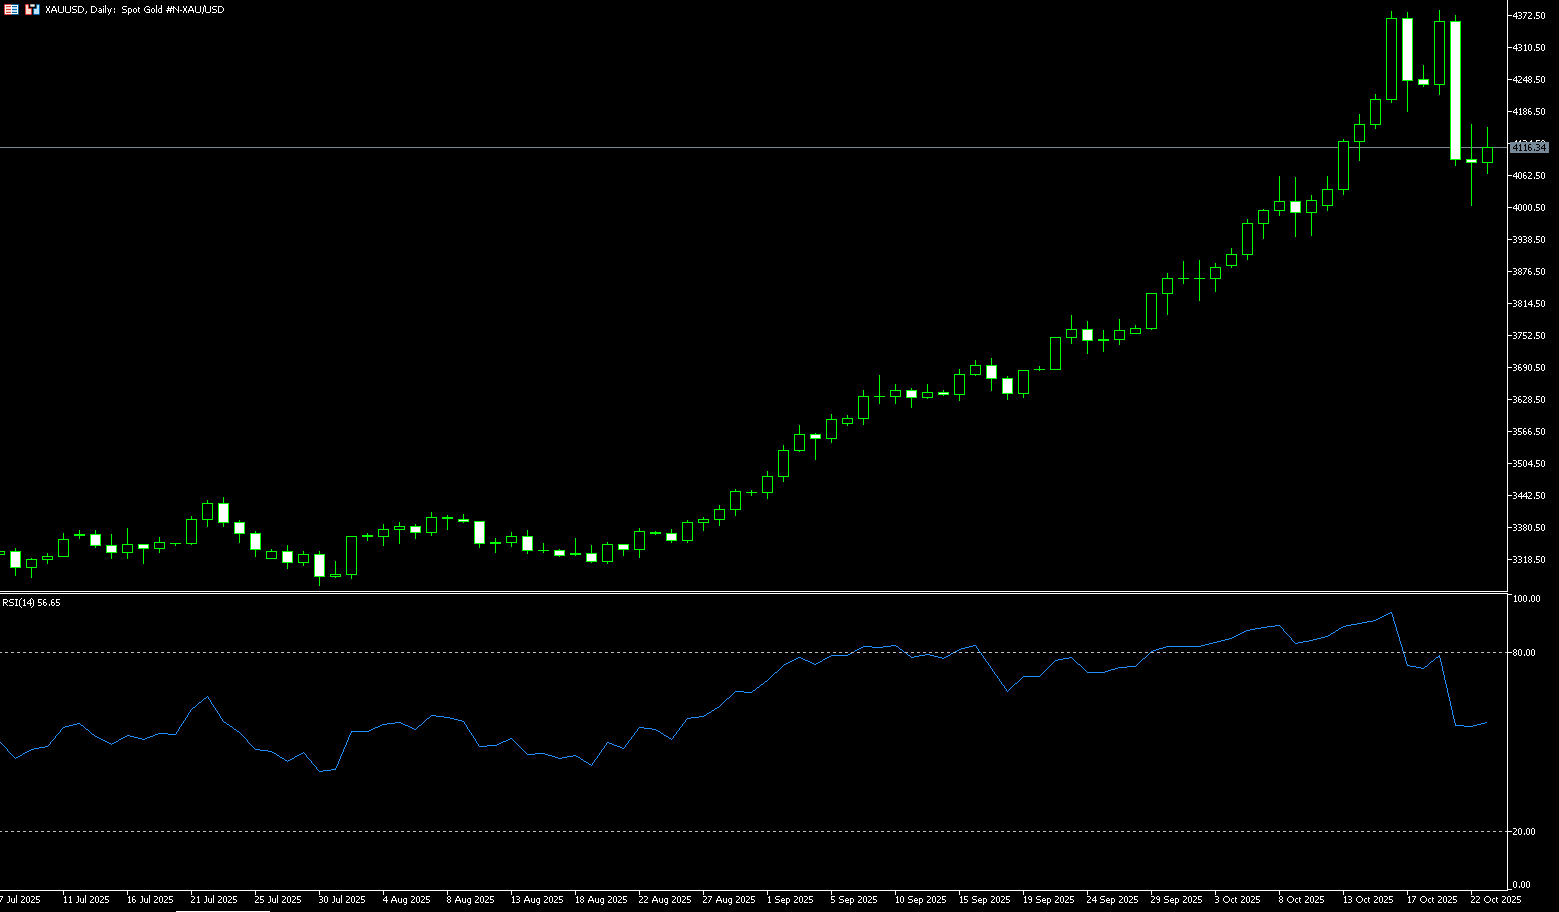
Gold prices rebounded to around $4,120 per ounce on Thursday, snapping a three-day losing streak following continued selling pressure after hitting multiple record highs in recent weeks. The metal is now down about 6% from its peak, its biggest weekly drop in more than five years. Optimism about the increased likelihood of a US-China trade deal and the upcoming meeting between Presidents Trump and Xi Jinping, coupled with Trump's recent more conciliatory rhetoric toward China, has reduced gold's safe-haven appeal. Despite this, gold is still up about 55% this year and over 5% this month, supported by market expectations that the Federal Reserve will implement two interest rate cuts by the end of the year. Geopolitical tensions also continued to support the market after the US announced new sanctions against Russia following reports that the Trump-Putin summit was scheduled to be postponed due to Moscow's rejection of a ceasefire in Ukraine.
Overall, the gold market is currently facing a complex environment fraught with multiple factors. In the short term, profit-taking and technical adjustments may continue to weigh on gold prices, but expectations of a Fed rate cut, geopolitical risks, and uncertainty surrounding the US government shutdown are providing a bottom line for gold prices. Technically, the 23-day simple moving average of $4,001 and the psychologically important $4,000 level will serve as key support. If gold can hold above these levels, a new uptrend to $4,121 (the 14-day simple moving average) is possible in the near term. Next up is $4,186.60, which also forms the neckline of the "double top" pattern of $4,380 and $4,391. Further support lies at the $4,200 level. On the downside, the 23-day simple moving average of $4,001 and the psychologically important $4,000 level will serve as key support. The next level is the 25-day simple moving average of $3,977.
Consider going long on gold at 4,114 today. Stop-loss: 4,110. Target: 4,160, 4.150.
AUD/USD
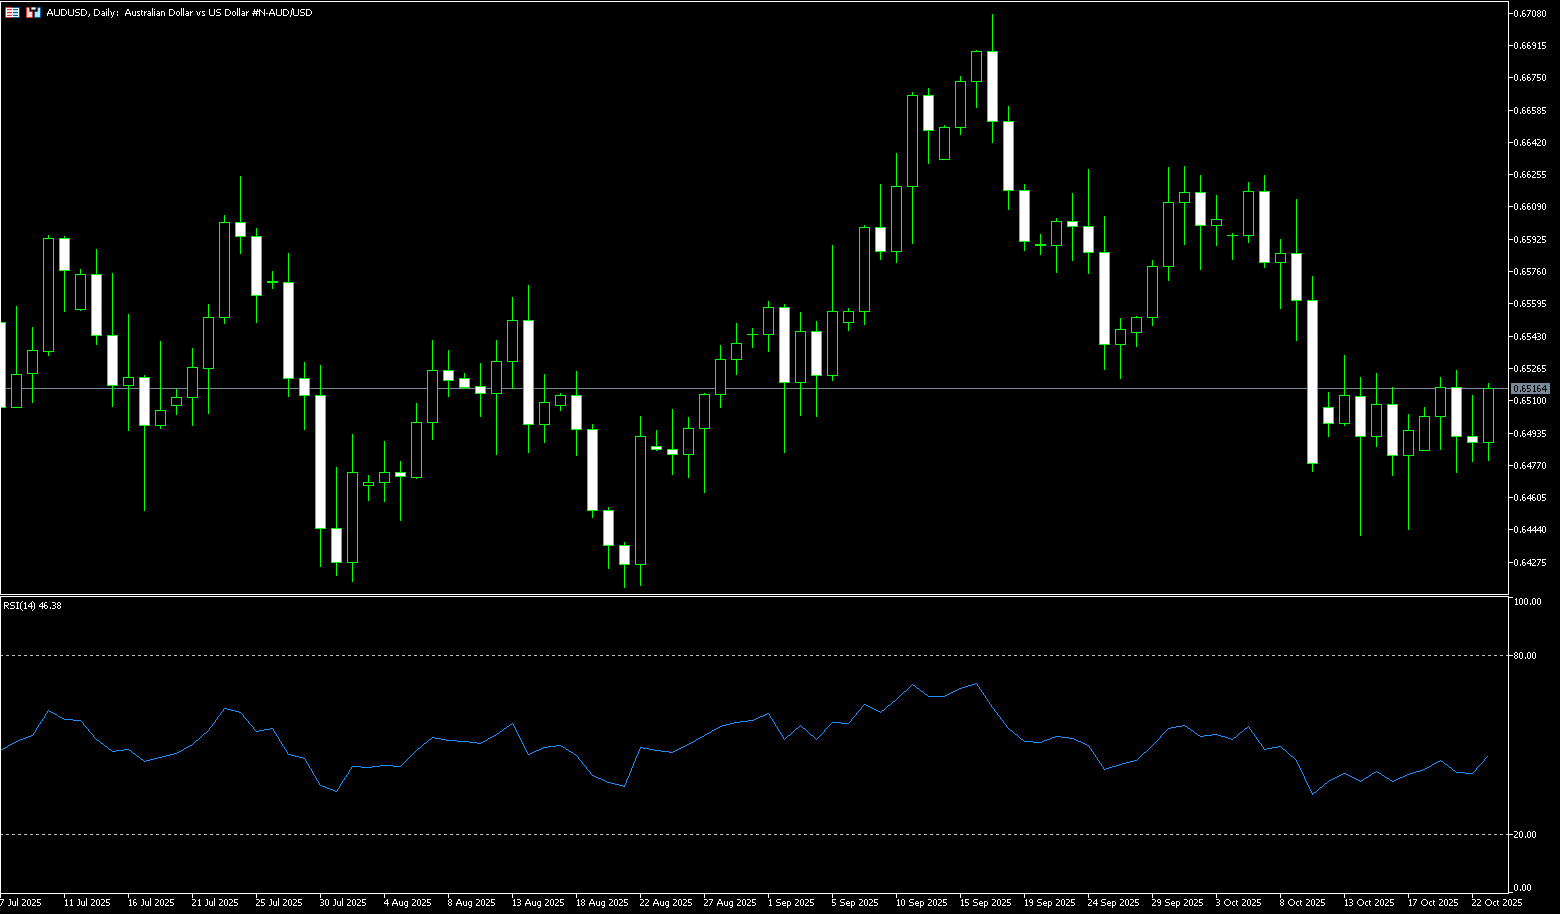
The Australian dollar (AUD/USD) remained under pressure around $0.6500 on Thursday as bets grew that the Reserve Bank of Australia (RBA) might cut interest rates in the near future. Recent data showed an unexpected rise in the unemployment rate to a near four-year high in September, pushing the market to price in a 70% probability of a 25 basis point rate cut, up from around 40% last week. Focus now shifts to upcoming economic data for signals on the central bank's November action, including this week's flash Purchasing Managers' Index data and next week's key third-quarter Consumer Price Index report. Meanwhile, the Australian dollar's downside may be limited following a breakthrough between US President Donald Trump and Australian Prime Minister Anthony Albanese, who signed a critical minerals agreement aimed at reducing dependence on China and potentially investing billions of dollars in local mining projects.
The AUD/USD exchange rate remains in a consolidation phase, with the downside trend currently appearing to be supported by the key 200-day simple moving average around 0.6434. Bullish attempts are expected to face initial resistance at the interim 100-day and 55-day simple moving averages (0.6534 and 0.6547, respectively). A break above this area could bring the psychological barrier of 0.6600 and the October high of 0.6629 (October 1) back into view, followed by the 2025 high of 0.6707 (September 17). On the other hand, a break of the key 200-day moving average at 0.6431 would be a key target, followed by the August low of 0.6414 (August 21). Below this is the June trough of 0.6372 (June 23).
Consider a long position on the Australian dollar at 0.6500 today, with a stop-loss at 0.6490 and targets at 0.6550 and 0.6560.
GBP/USD
GBP/USD entered its third consecutive bearish session on Wednesday, losing momentum and falling back to just before the 1.3300 level. The pound faced strong selling pressure against major currencies following Wednesday's release of UK Consumer Price Index data. The Office for National Statistics (ONS) reported that the core CPI, which excludes volatile components such as food, energy, alcohol, and tobacco, rose by 3.5% year-over-year, below expectations. Economists forecast a 3.7% increase in underlying price pressures, compared to the previous reading of 3.6%. Headline inflation rose steadily by 3.8% year-over-year, below expectations of 4.0%. On a monthly basis, prices remained stable after rising 0.3% in August. Services inflation, a closely watched indicator by the Bank of England, remained unchanged at 4.7%. Signs of easing price pressures will bolster market expectations for further interest rate cuts from the Bank of England throughout the year. Last week, with the release of employment data for the three months ending in August, which showed rising unemployment and slowing wage growth, market expectations for a dovish Bank of England grew.
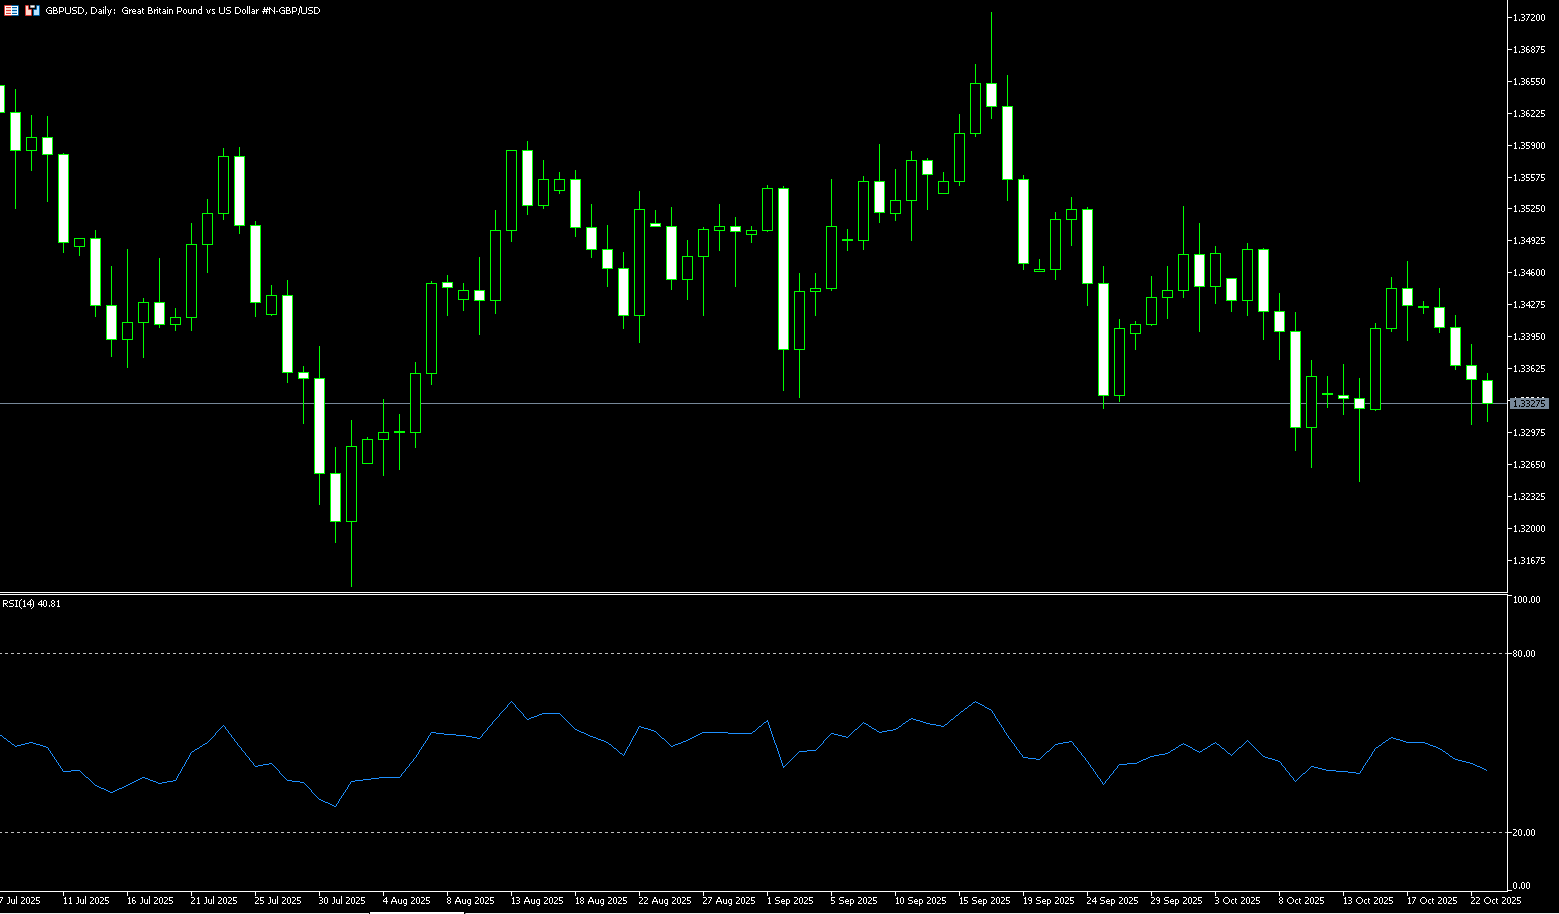
The daily chart shows GBP/USD trading just above 1.3320. Recent price action suggests a period of consolidation following a series of lower highs and higher lows. The pair remains trapped between its 50-day simple moving average (SMA) of 1.3468 and its 200-day SMA of 1.3215, a range that reflects hesitation among traders. The 14-day relative strength index (RSI) is currently hovering near 40, indicating a slightly bearish momentum bias but not yet entering oversold territory. This suggests sellers have the upper hand. The pair has repeatedly tested 1.3248 (October 15 low) and its 200-day SMA of 1.3215, indicating that these levels continue to serve as key dynamic support. Meanwhile, a rebound attempt towards the 1.3400 level and the 50-day simple moving average at 1.3468 failed to gain traction, highlighting the importance of these levels as near-term resistance.
Consider a long position on the British pound at 1.3310 today, with a stop-loss at 1.3300 and targets at 1.3360 and 1.3370.
USD/JPY
The USD/JPY exchange rate attracted some buying during early Asian trading on Wednesday, rising to around 152.50 for the first time in six days. The yen weakened against the greenback following the election of dovish Taro Aso as Japanese Prime Minister. Japan's parliament on Tuesday elected the far-right conservative Aso as the country's first female prime minister. Aso pledged to strengthen Japan's economy and defense and deepen ties with the United States. Her election was the result of an alliance between the ruling Liberal Democratic Party and the Japan Innovation Party, which reportedly signed a coalition agreement over the weekend. Aso's support for fiscal stimulus and loose monetary policy kept traders on edge and added uncertainty to the Bank of Japan's path for interest rate hikes. Markets generally expect the Bank of Japan to further delay its rate hikes, which could put pressure on the yen and favor cross-currency pairs in the short term.
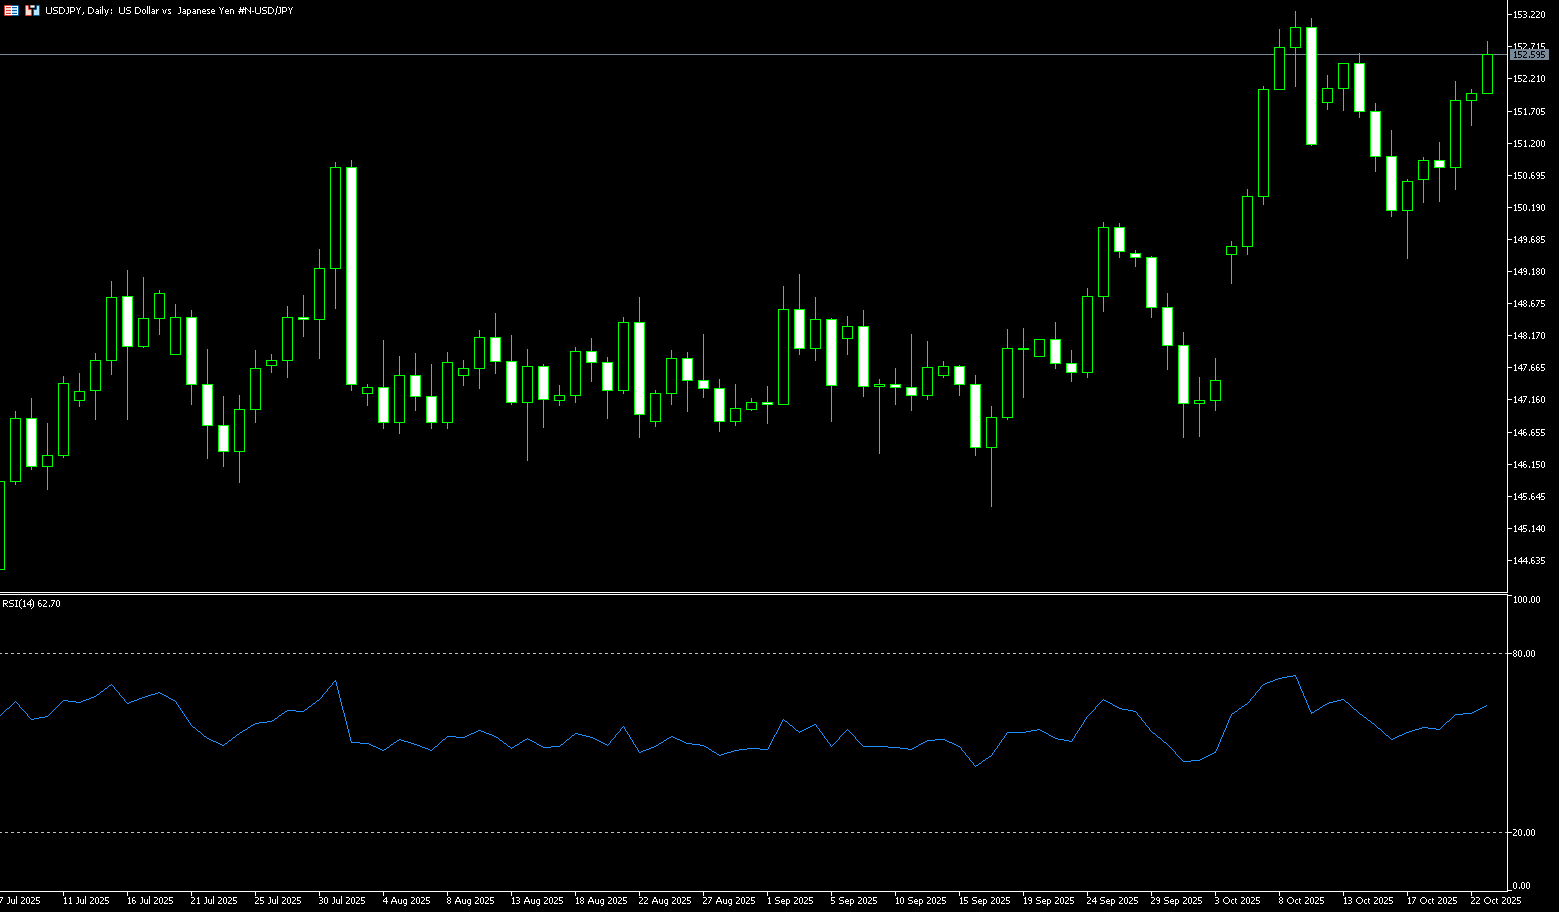
The daily chart shows that USD/JPY experienced a slight technical pullback to 151.80 midweek. Technical analysis on the daily chart suggests that the pair's bullish bias remains intact. On the upside, initial resistance lies at 152.75, the recent high set on October 14. A break above this level would support the pair's move towards the psychological level of 153.00 and the eight-month high of 153.27 set on October 10. Immediate support lies at 151.45 (the 20-period moving average on the 12-hour chart). A break below this level would weaken short-term price momentum and prompt USD/JPY to test the psychological level of around 150.00.
Consider shorting the US dollar at 153.00 today. Stop loss: 153.20, target: 151.80, 151.50.
EUR/USD
After three days of decline, the EUR/USD pair attempted to stabilize around 1.1600 during Wednesday's European session. The major currency pair faced challenges finding support as the US dollar maintained its recent upward trend, which came amid easing US-China trade tensions. Another factor driving the dollar's strength is growing market expectations for a potential reopening of the federal government after a nearly three-week shutdown. On Monday, White House economic advisor Kevin Hassett stated that he believed the shutdown could end sometime this week. Meanwhile, the euro remained cautious ahead of speeches by ECB President Christine Lagarde and Vice President Luis de Guindos, the latter scheduled for early North American trading. The next major trigger for the euro will be the ECB's monetary policy announcement scheduled for next week.
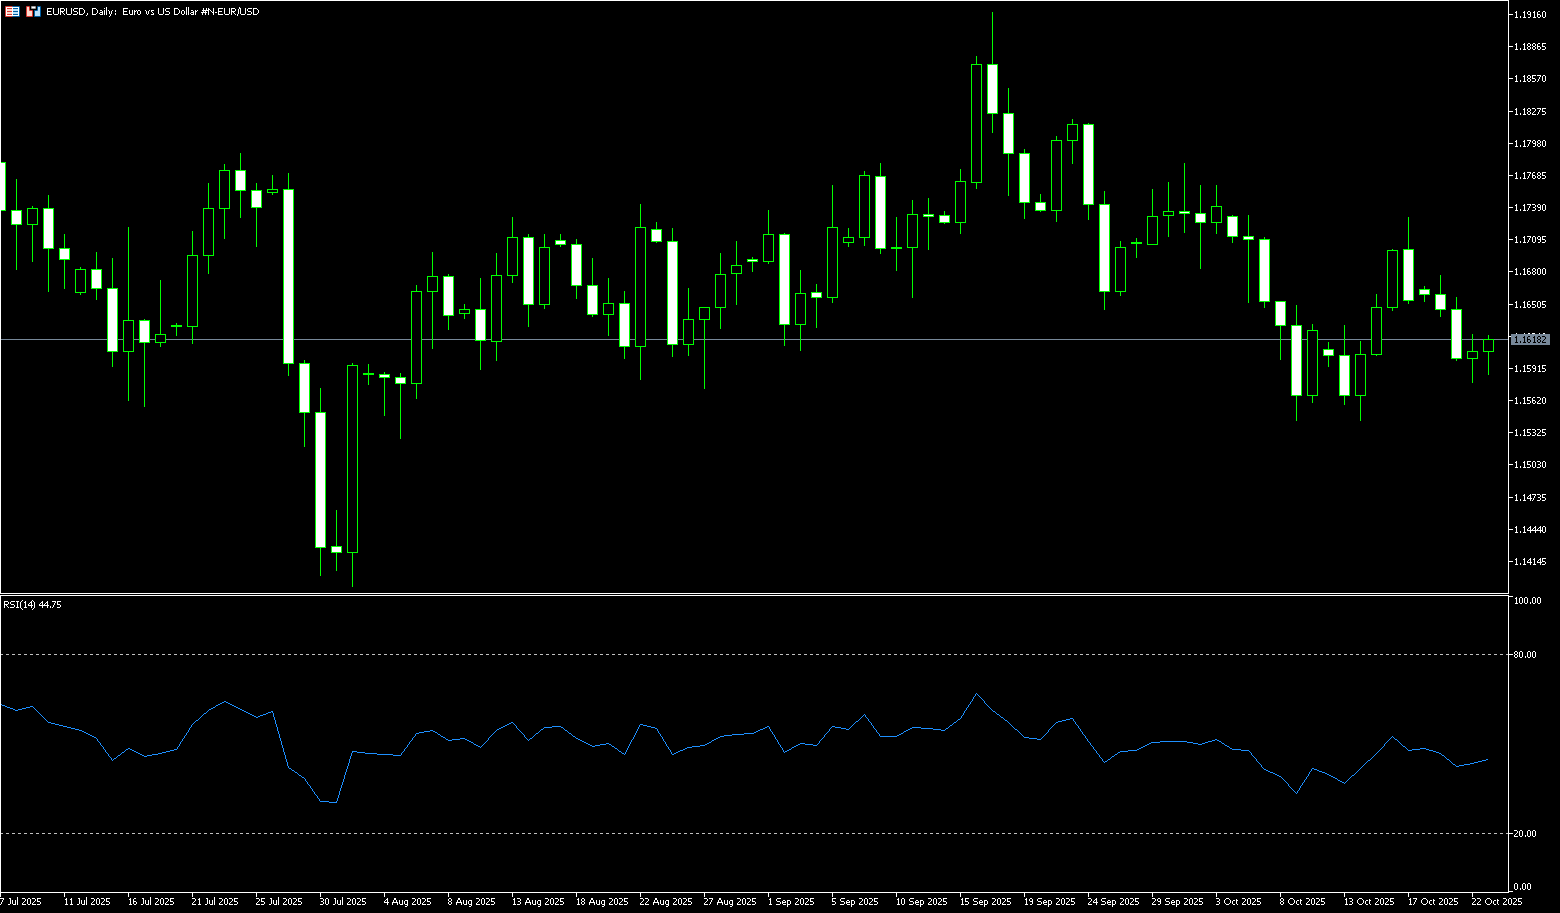
EUR/USD has maintained its negative performance so far this week. Momentum indicators are showing some weakness: the Relative Strength Index (RSI) has fallen to around 44, suggesting additional losses are still on the horizon. Furthermore, the Average Directional Index (ADX) is below 16, indicating a lack of trend strength. A continuation of the current downtrend could open the door to a potential "double bottom" low at 1.1542 (October 9 and 14), followed by 1.1500 (round number), and the key 165-day simple moving average at 1.1450. A deeper decline would expose a retracement to the round number at 1.1400. Bulls, on the other hand, are looking for immediate targets at the Bollinger Band 1.1668, followed by 1.1728 (October 17 high), followed by another minor hurdle at the monthly high of 1.1778 (October 1). A break above the latter could bring the 1.1800 mark back into view.
Today, you can consider going long on EUR at 1.1600, stop loss: 1.1590, target: 1.1660; 1.1650
Disclaimer: The information contained herein (1) is proprietary to BCR and/or its content providers; (2) may not be copied or distributed; (3) is not warranted to be accurate, complete or timely; and, (4) does not constitute advice or a recommendation by BCR or its content providers in respect of the investment in financial instruments. Neither BCR or its content providers are responsible for any damages or losses arising from any use of this information. Past performance is no guarantee of future results.
Lebih Liputan


Pendedahan Risiko:Instrumen derivatif diniagakan di luar bursa dengan margin, yang bermakna ia membawa tahap risiko yang tinggi dan terdapat kemungkinan anda boleh kehilangan seluruh pelaburan anda. Produk-produk ini tidak sesuai untuk semua pelabur. Pastikan anda memahami sepenuhnya risiko dan pertimbangkan dengan teliti keadaan kewangan dan pengalaman dagangan anda sebelum berdagang. Cari nasihat kewangan bebas jika perlu sebelum membuka akaun dengan BCR.

 English
 简体中文
简体中文
 繁體中文
繁體中文
 Bahasa
Melayu
Bahasa
Melayu
 Tiếng
Việt
Tiếng
Việt
 ไทย
ไทย
 日本語
日本語
 한국어
한국어
 ភាសាខ្មែរ
 español