


0
US Dollar Index
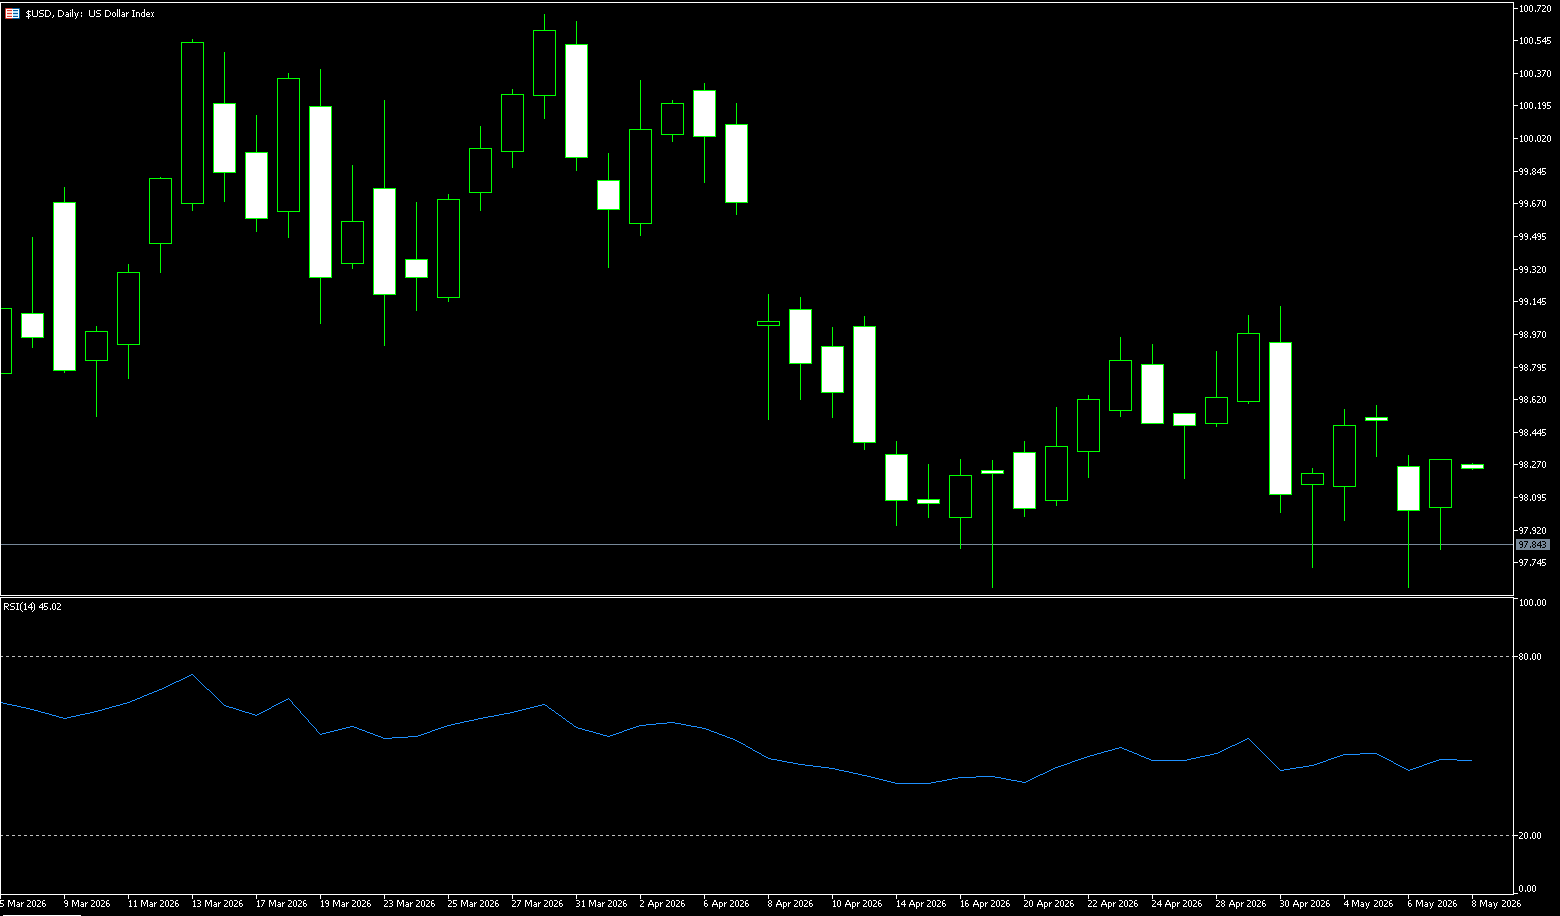
The US dollar index hovered around 98.80 on Thursday, having risen sharply this week as accelerating US inflation related to the Iran war strengthened market expectations that the Federal Reserve will maintain higher interest rates for a longer period or may raise rates. Data released on Wednesday showed that US wholesale inflation climbed at its fastest pace since 2022 in April, after a report on Tuesday showed that consumer inflation rose to 3.8% last month, the highest level since May 2023. The market has now completely eliminated the possibility of a Fed rate cut this year and is increasingly raising the probability of a rate hike this year. Meanwhile, the US Senate narrowly confirmed Kevin Warsh as Federal Reserve Chairman on Wednesday, and investors are assessing whether he will maintain the central bank's independence. Elsewhere, President Trump plans to meet with Chinese President Xi Jinping, with discussions expected to focus on trade relations rather than the ongoing Iran conflict.
Technically, the US dollar index briefly tested the 98.60 level after the data release before retreating, indicating intensified short-term bullish and bearish competition. Rising US Treasury yields reflect adjustments in interest rate expectations, but the yield curve remains positive. Stock and futures markets reacted relatively restrainedly, with the technology sector showing some resilience, but overall indices remained under pressure, reflecting the market's valuation sensitivity under high interest rate expectations. The daily chart of the US dollar index shows a slightly positive MACD histogram, indicating some easing of short-term selling pressure, but overall momentum remains weak. The candlestick pattern shows alternating green and red bars, with a rebound after a low of 97.62. Significant resistance was encountered around the 99.00 level, while 99.26 represents previous high resistance. Traders are watching the effectiveness of the 98.25 support level and the difficulty of breaking through the 98 level. Overall, the technical picture shows a volatile trend, with limited short-term rebound strength, requiring confirmation of trend continuation based on fundamental data.
Today, consider shorting the US Dollar Index at 98.96, with a stop-loss at 99.06 and targets at 98.50 and 98.40.
WTI Crude Oil
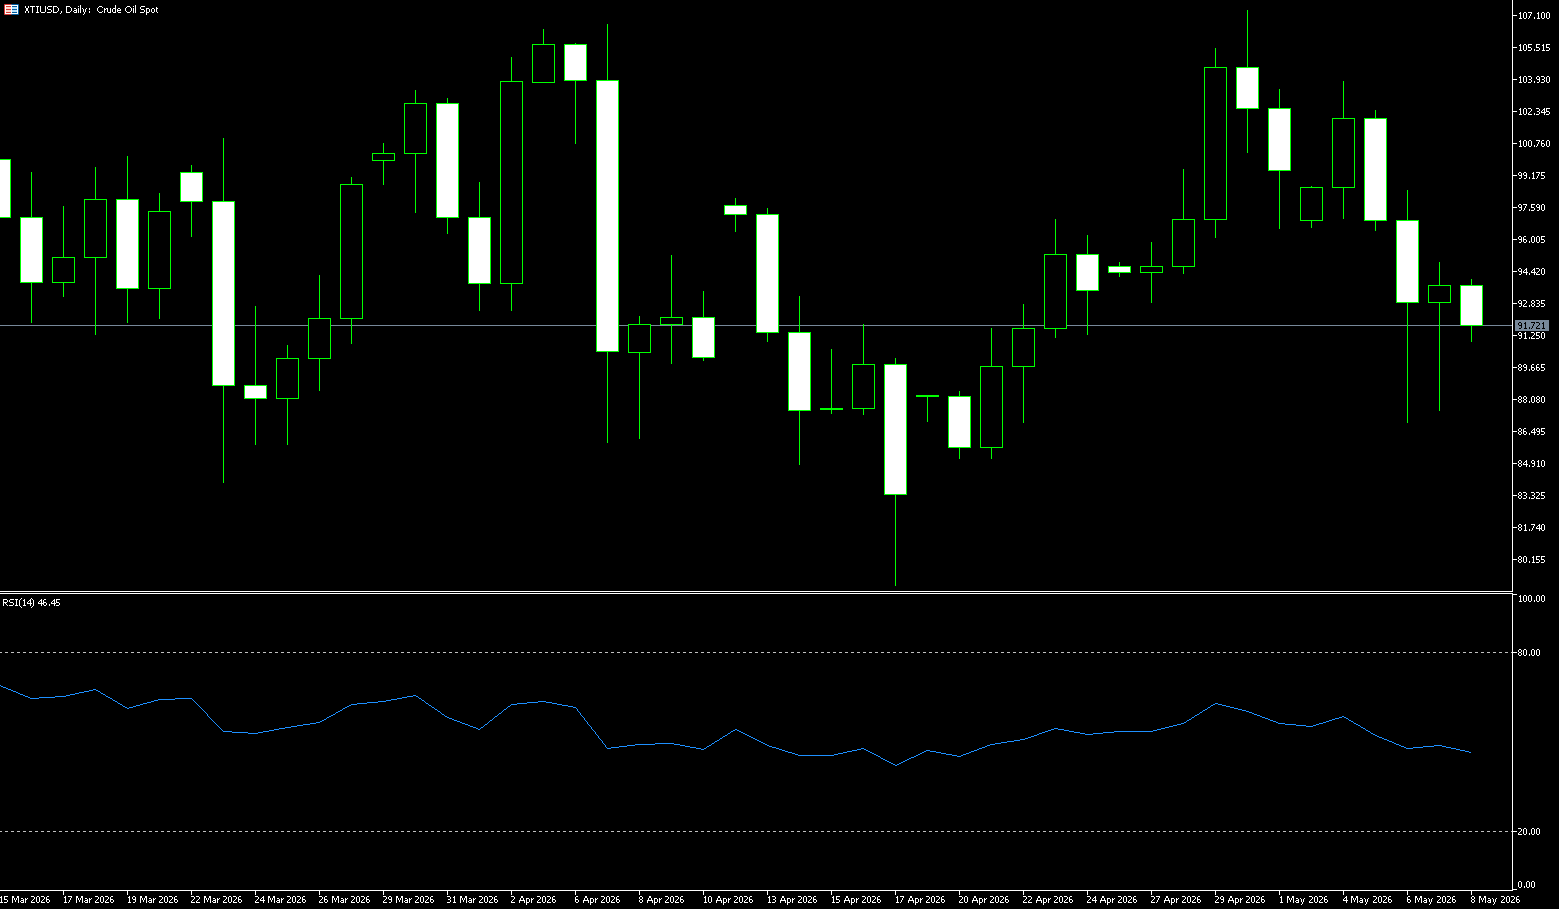
WTI crude oil futures stabilized at around $97.80 per barrel on Thursday, pausing recent gains as investors focused on the upcoming meeting between US President Donald Trump and Chinese President Xi Jinping. The two leaders are expected to prioritize trade over tensions surrounding the war with Iran, despite Washington's recent pressure on Tehran, its largest importer, through threats against banks and new sanctions against entities involved in Iranian crude oil sales to China. Meanwhile, the US Energy Information Administration reported that crude oil and fuel flows through the Strait of Hormuz fell by nearly 6 million barrels per day in the first quarter since the conflict erupted in the Middle East in late February. The International Energy Agency also warned that the global oil market could remain severely undersupplied until October, even if the conflict ends next month, while Saudi Arabia notified OPEC that its oil production has fallen to its lowest level since 1990.
From an overall technical perspective, crude oil is currently in a consolidation phase within an upward trend. The previous high near 113.28, along with the multiple trendline resistance zones formed by the upper and lower edges of the upward and downward trends, will be key points to watch for short-term price movements. From a trading perspective, if the price can effectively break through and hold the $100 psychological level, accompanied by a moderate increase in trading volume, it may break the current consolidation pattern and open up further upside potential to $107.35 (the high of April 30th). Conversely, if the price is resisted by multiple resistance levels and falls below the $95 support level, there is a risk of a pullback to $90 (a psychological level) or even lower, potentially shifting the short-term trend to a downward consolidation.
Today, consider going long on crude oil at 97.60, with a stop-loss at 97.50 and targets at 100.00 and 99.00.
Spot Gold
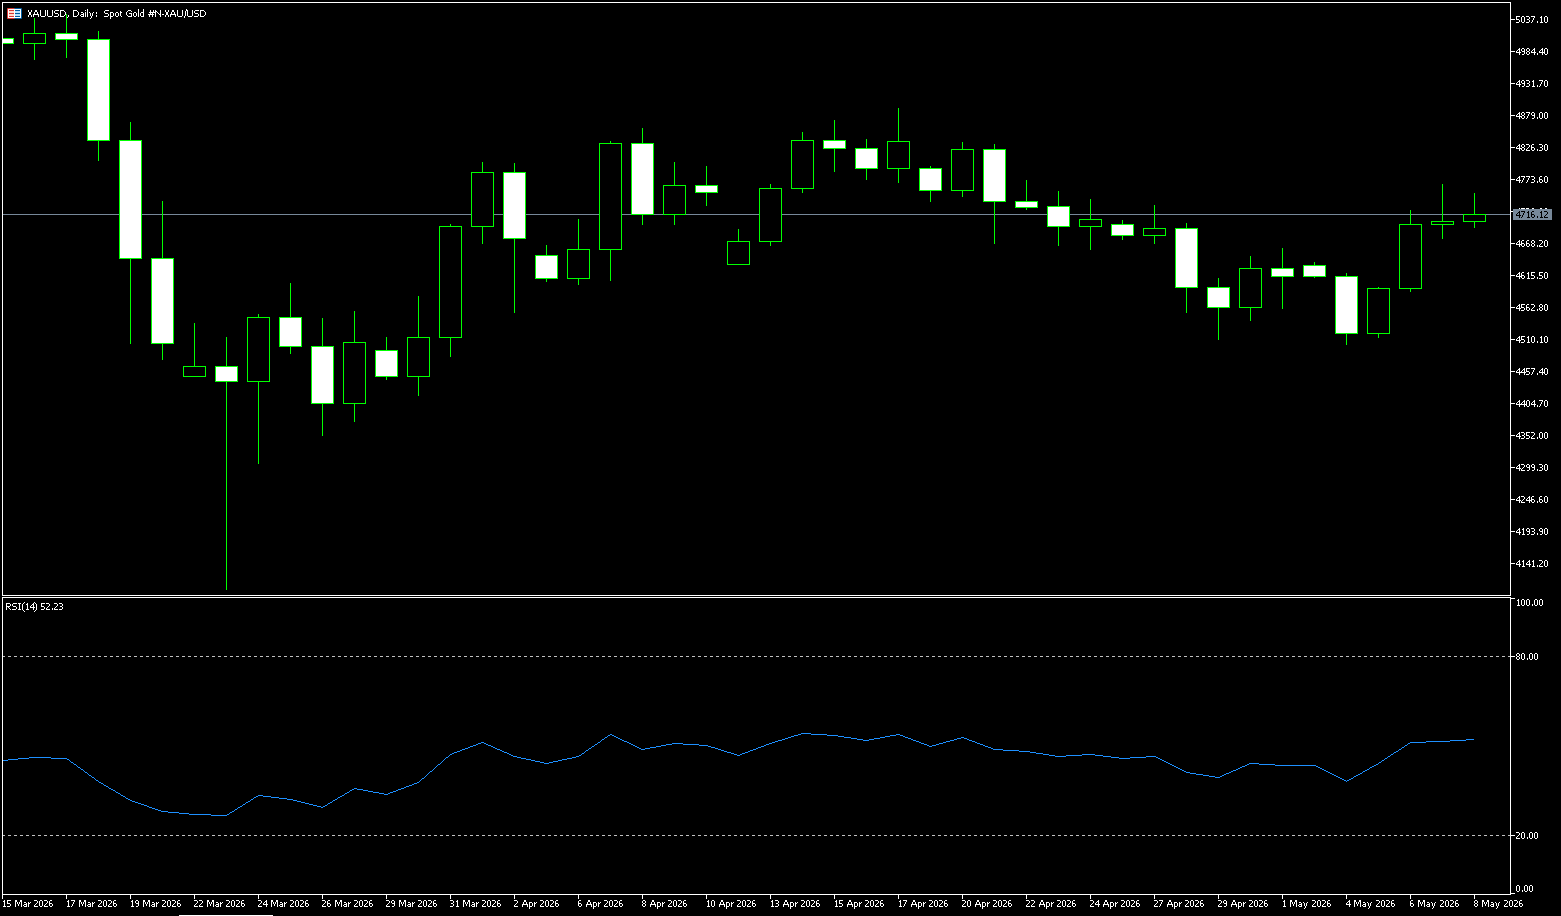
Gold prices fell below $4,700 per ounce on Thursday, marking a second consecutive day of declines, as rising US inflation fueled market expectations that the Federal Reserve might maintain higher interest rates for an extended period or even raise rates. Data released Wednesday showed that US wholesale inflation accelerated to its fastest pace since 2022 in April, primarily driven by rising trade and energy costs related to the war with Iran. The report followed Tuesday's data, showing consumer inflation climbed to 3.8% last month, the highest level since May 2023. Investors have now completely ruled out the possibility of a Fed rate cut this year, while increasingly expecting another rate hike before the end of the year. Although gold is traditionally seen as a safe-haven asset against inflation, higher interest rates tend to put pressure on this non-yielding asset. Meanwhile, the market is also closely watching President Trump's visit to China for signs of progress in the fragile trade truce and developments related to the conflict with Iran.
On the daily chart, gold is trading below $4,700, maintaining a slightly bearish short-term tone as it hovers below the 50-day simple moving average around $4,749. This level traps spot gold below a layer of medium-term resistance, with the longer-term 100-day moving average around $4,788 reinforcing the supply zone above, while the 14-day Relative Strength Index (RSI) is near neutral 50, indicating only mild directional confidence at present. Near-term resistance lies at the 50-day moving average around $4,749, followed by the 100-day moving average around $4,788, and the broader downtrend line that continues to suppress rallies. Initial support is provided near the market around $4,620, with more substantial support appearing around the psychological level of $4,600, where long-term buyers may regain control if the current consolidation breaks downwards.
Consider going long on gold at 4,647 today, with a stop loss at 4,642 and targets at 4,680 and 4,700.
AUD/USD
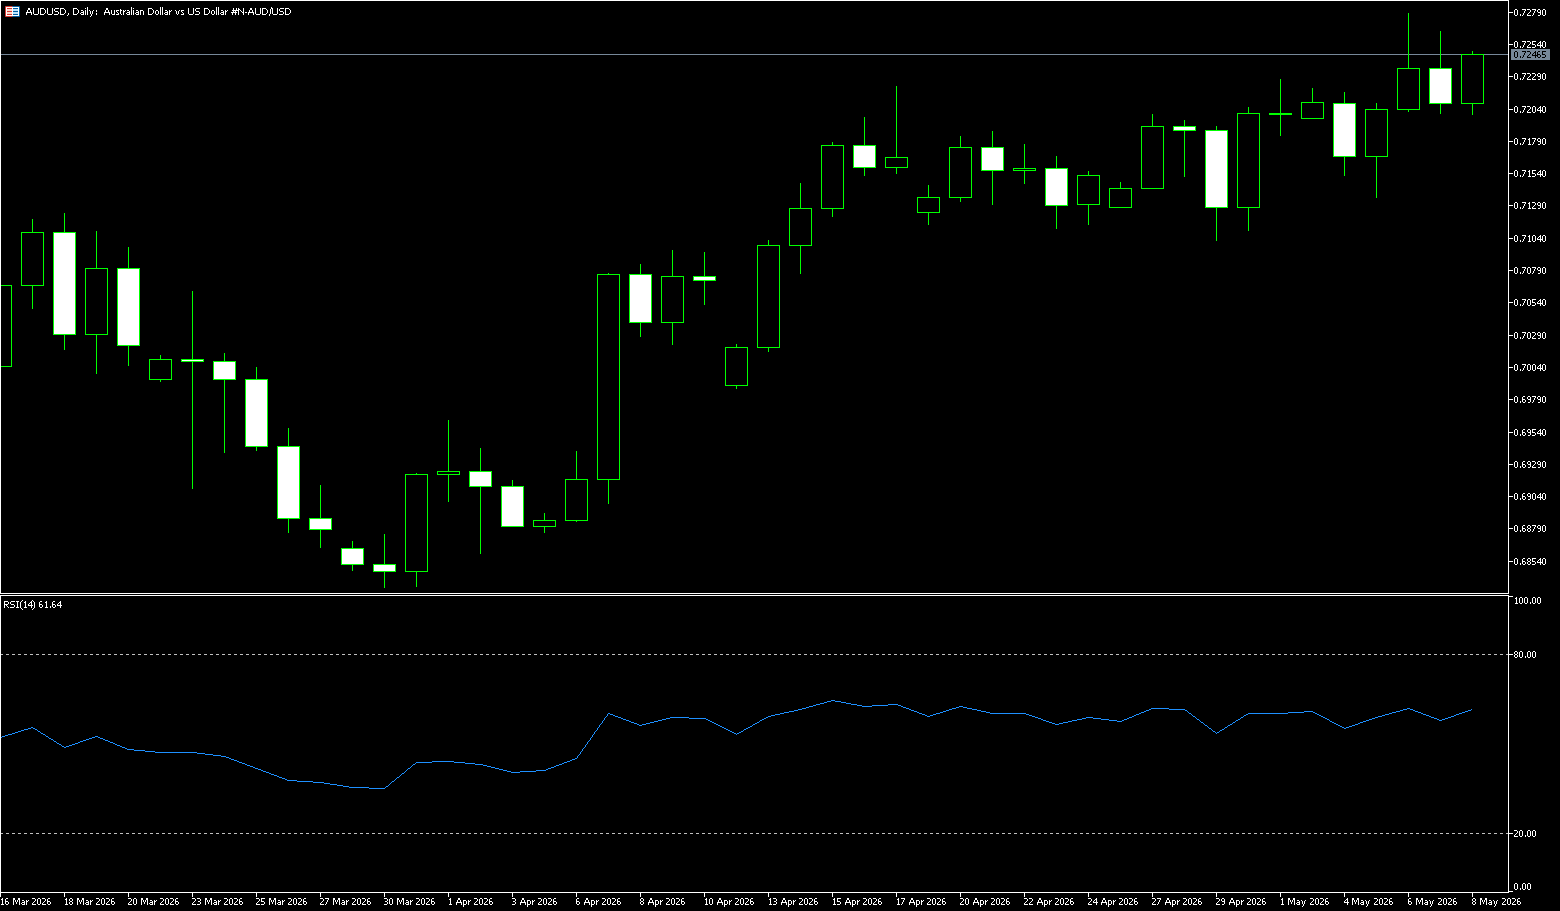
The AUD/USD pair fell to near 0.7220 during Thursday's trading session. Higher-than-expected US inflation data provided some support for the US dollar against the Australian dollar. US producer prices recorded their biggest gain in four years in April, supporting the dollar. Data released by the US Bureau of Labor Statistics on Wednesday showed that the US Producer Price Index (PPI) rose 6.0% year-on-year in April, up from 4.3% previously. On a monthly basis, the PPI inflation rate rose to 1.4% in April from 0.7% in March, far exceeding the expected 0.5%.
Traders will be looking for more clues from Thursday's US retail sales report. The market expects retail sales to rise 0.5% month-on-month in April, lower than March's 1.7%. Any signs of rising inflation data could boost the dollar and put pressure on the currency pair. This is the first state visit to China by a US leader in nine years. Any positive developments in the US-China talks could boost the Australian dollar, which represents China, a key trading partner for Australia.
Overall, the core logic behind the current AUD/USD exchange rate movement revolves around the policy interplay between the Reserve Bank of Australia's (RBA) hawkish stance and the Federal Reserve's high interest rate expectations. As long as the RBA maintains its hawkish policy and global commodity prices remain high, the Australian dollar will generally have some support, but a strong US dollar environment may limit its upside potential. From a daily chart perspective, the overall structure remains a medium-term upward trend with a slight upward bias. The exchange rate has been consistently trading above the 50-day moving average (0.7088) and well above the 200-day moving average, indicating that the medium-to-long-term upward trend has not been broken. Technically, the daily MACD remains above the zero line, but the red histogram momentum has narrowed, indicating that the upward momentum of the Australian dollar is beginning to slow. The Stochastic Relative Strength Index (RSI) is hovering around 50, suggesting that the market is in a short-term consolidation phase. The key resistance level on the daily chart is initially at 0.7270 (the highest point since June 2022). A decisive break above this level could lead to a further test of the 0.7300 area. On the downside, the 0.7200 area forms initial support, followed by the 50-day moving average around 0.7088.
Consider going long on the Australian dollar today at 0.7210, with a stop loss at 0.700 and targets at 0.7250 and 0.7260.
GBP/USD
The pound weakened further on Thursday to $1.34, its lowest level in over a month, after major resignations foreshadowed a significant change in the prime minister's position. MP Josh Simmons resigned to allow Manchester Mayor Andy Burnham to run for Parliament, and Health Secretary Wes Streittin resigned to give himself a chance to run for prime minister. Both challenge incumbent leader Keir Starmer, who faces increasing pressure to resign after the ruling Labour Party suffered significant losses in last week's local elections. Another potential contender, Angela Reyner, was ousted from the tax investigation by HM Revenue and Customs this morning, potentially paving the way for her candidacy. Investors are also watching comments from Bank of England's Sarah Briden, who said the Middle East conflict is "less likely" to trigger a surge in inflation like in 2022. Meanwhile, the UK economy grew by 0.6% in the first quarter of 2026, reaching an annual growth rate of 1.1% that exceeded expectations, mainly driven by a surprise 0.3% increase in March.
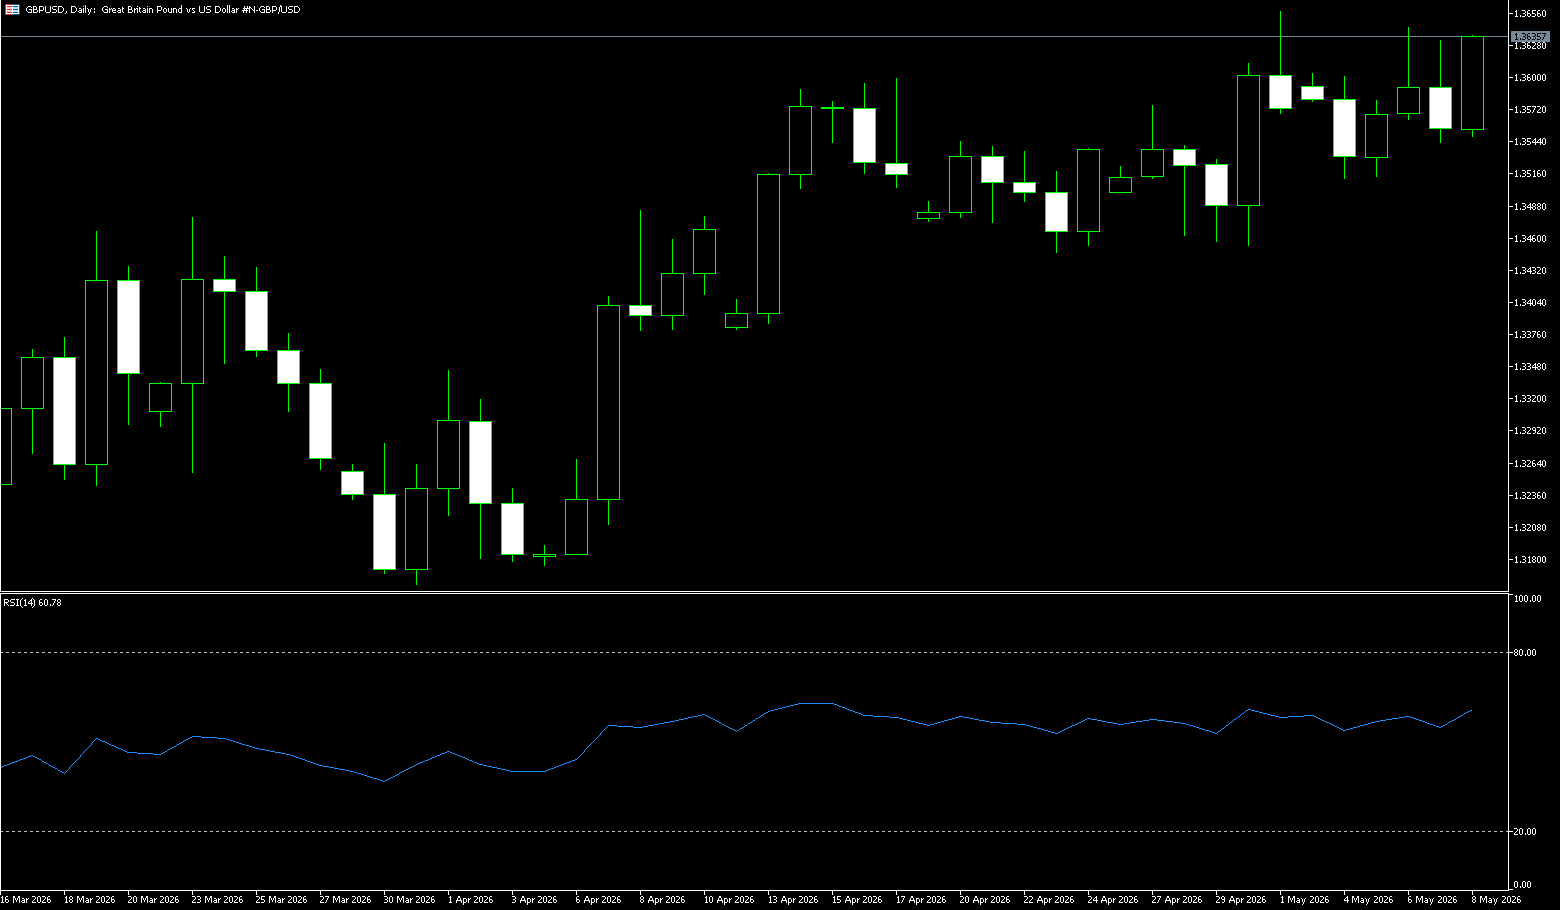
On the daily chart, GBP/USD maintains a slightly bearish short-term bias as spot prices stabilize above the 100-day simple moving average (1.3482). The pair is consolidating in the lower half of its recent trading range, with a Relative Strength Index (RSI) of 42.00, suggesting that the rally was solid but not overextended as prices approached the upper band. The immediate resistance level is near the psychological level of 1.3500 and the 100-day simple moving average (1.3481). A clear break above these levels would open up further upside potential to 1.3600. Initial support is located around 1.3350 and near the psychological level of 1.3300. These levels should limit pullbacks while maintaining the overall constructive pattern.
Consider going long on GBP/USD today at 1.3505, with a stop-loss at 1.3490 and targets at 1.3570 and 1.3580.
USD/JPY
The USD/JPY pair rose above 158.00 against the dollar on Thursday as the dollar found support amid accelerating US inflation, reinforcing market expectations that the Federal Reserve might maintain higher interest rates or even raise them further. The lack of decisive intervention by Japanese authorities also weighed on market sentiment, although traders remained wary of potential action after US Treasury Secretary Scott Bessant expressed support for Tokyo's recent efforts to stabilize the currency. On the policy front, the summary of the Bank of Japan's April meeting indicated that policymakers discussed the possibility of further interest rate hikes at the next meeting, while higher oil prices further complicated the inflation outlook. The OECD also predicts that the Bank of Japan's policy rate could rise to 2% by the end of 2027.
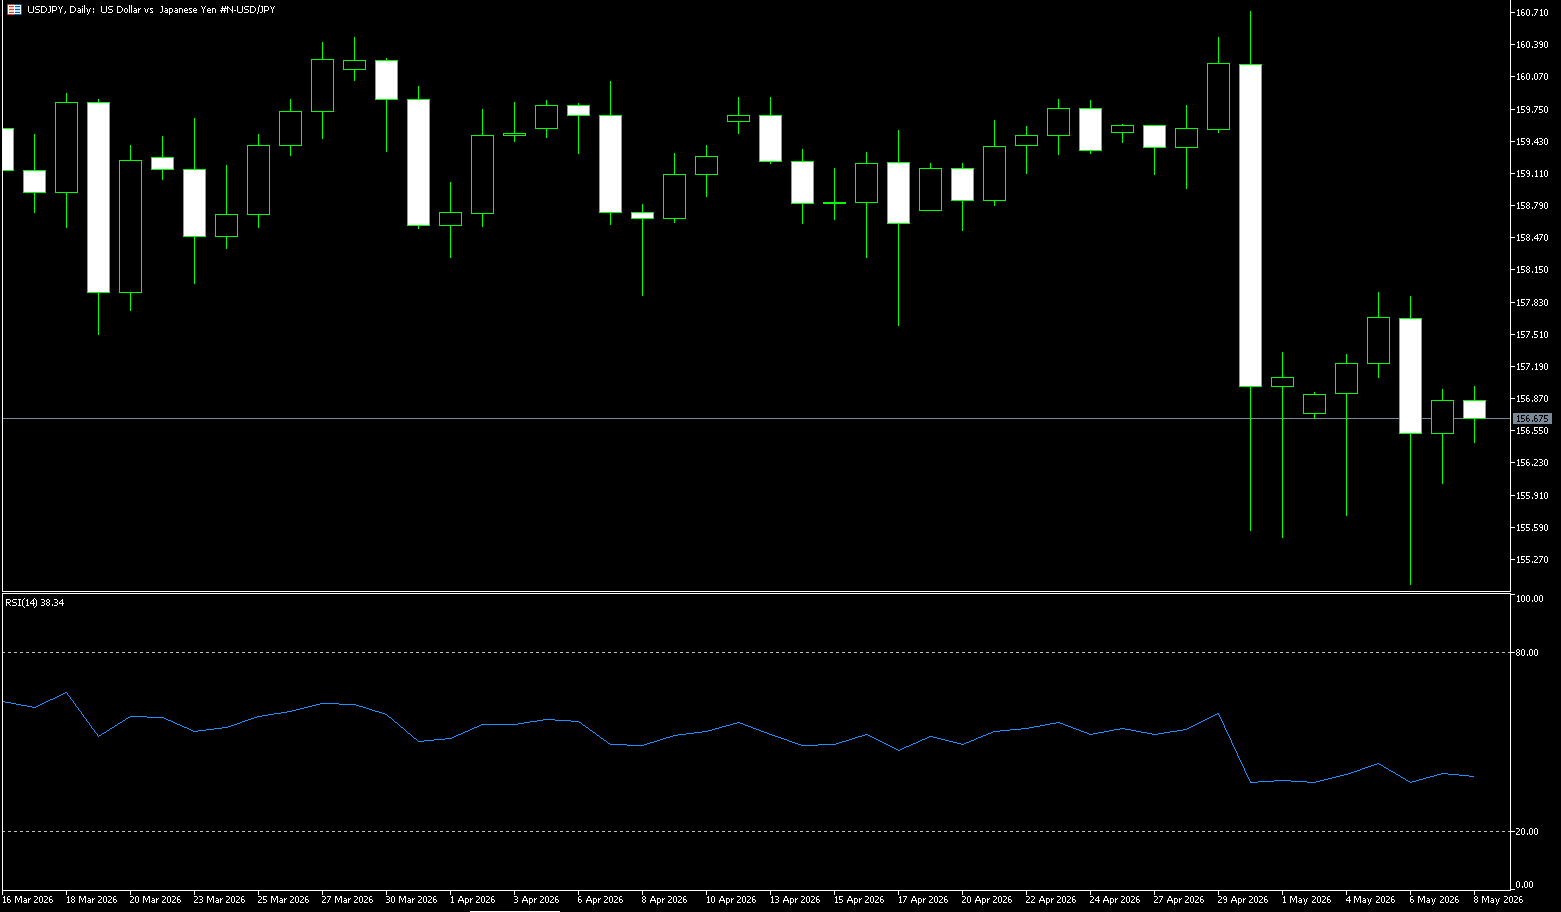
From a daily chart perspective, the USD/JPY pair maintains a clear bullish structure overall. The exchange rate is currently trading firmly above the 50-day and 200-day moving averages, indicating that the medium- to long-term upward trend remains unchanged. As the price approaches the 158.00 area again, the market is testing resistance near previous highs. Technically, the daily MACD indicator continues to trade above the zero line, with the red histogram gradually expanding, showing that the bullish trend remains dominant. The Stochastic Relative Strength Index (RSI) is approaching overbought territory again, suggesting increased short-term buying sentiment but also hinting at increased risk of volatility at higher levels. The key resistance level on the daily chart is initially at the psychological level of 159.00. A decisive break above this level could lead to a further test of the 159.50 area, and even a retest of the important psychological level of 160.00. On the downside, the 156.80 area provides initial support, followed by the support zone around 156.73, the low from May 12th. If the dollar experiences a short-term pullback, it may attract some buying interest at the 156 level.
Consider shorting the dollar at 158.56 today, with a stop loss at 158.75 and targets at 157.60 and 157.70.
EUR/USD
The euro fell below $1.17, retreating to a near three-week high, as investors weighed the impact of stalled US-Iran negotiations and rising expectations of further interest rate hikes by the European Central Bank. Concerns about a fragile ceasefire and persistent inflation have led the market to expect three ECB rate hikes by the end of the year, with a greater than 85% probability of a first hike in June. European Central Bank President Christine Lagarde reiterated on Friday that the central bank is prepared to act swiftly if necessary, emphasizing that the eurozone economy is now stronger than before the Russian invasion of Ukraine. Meanwhile, German wholesale prices rose 6.3% year-on-year in April, the highest level since February 2023, against the backdrop of ongoing tensions in the Middle East. Data from Eurostat also confirmed that the eurozone economy grew by only 0.1% in the first quarter of 2026, the weakest expansion since the second quarter of 2025.
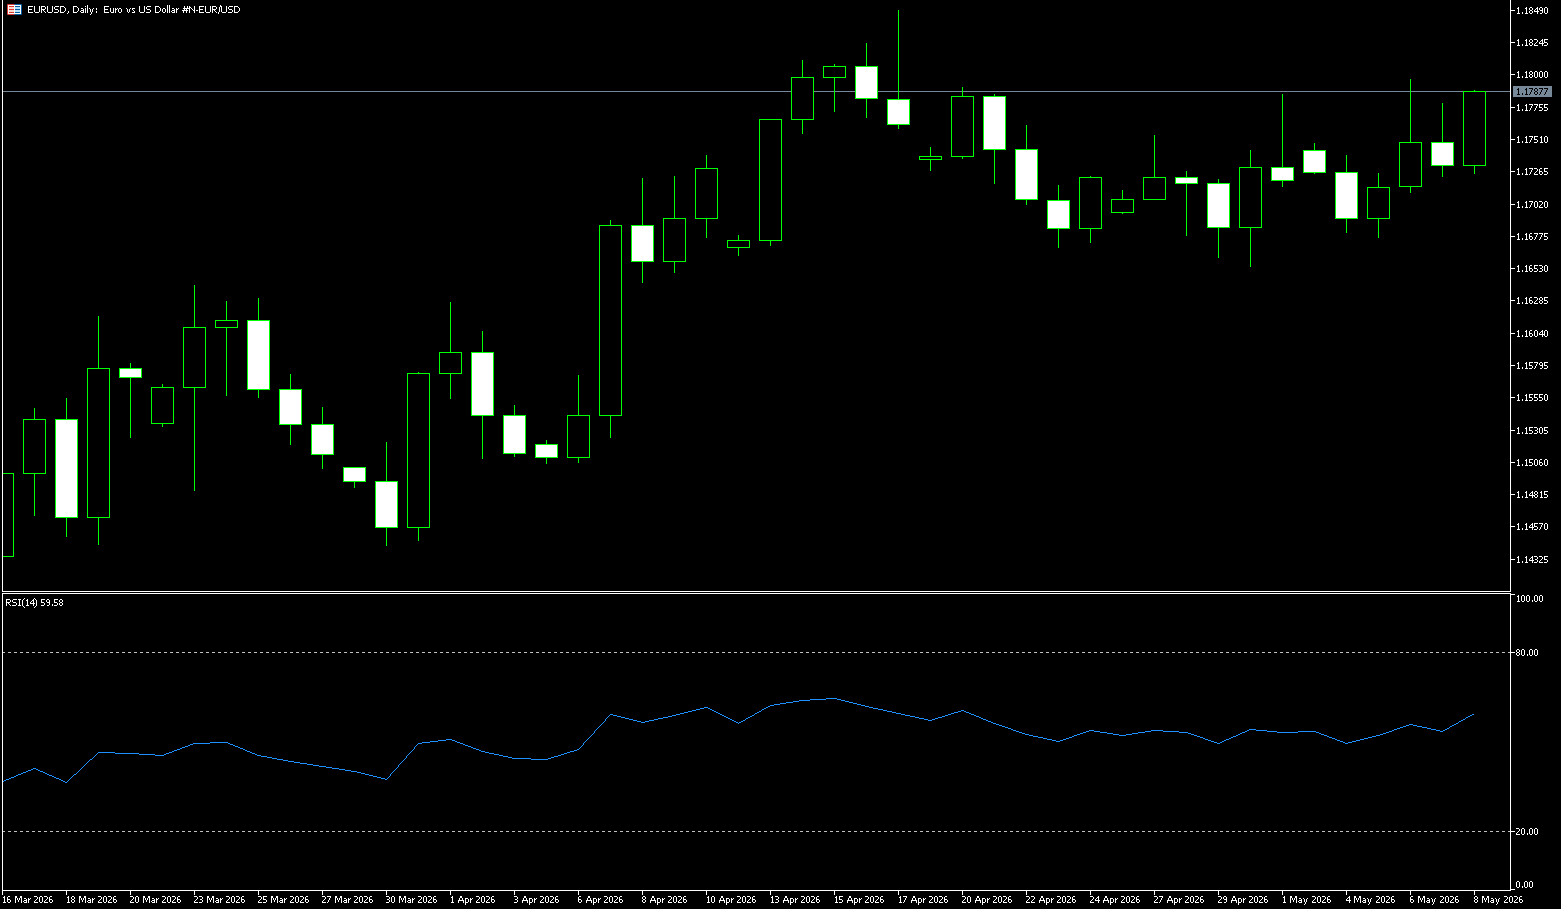
The euro is currently trading slightly below 1.1700 against the dollar, having touched a high of 1.1720 during the session. It closed lower for the second consecutive trading day, mainly due to fading hopes for peace in the Middle East. Looking at the daily chart for the euro/dollar pair, the current price is trading around 1.17. Moving averages are highly convergent. Specifically, the four moving averages—MA20 (1.1730), MA50 (1.1645), MA100 (1.1708), and MA200 (1.1681)—are densely distributed within a narrow range of 1.1645-1.1730, with a spacing of less than 85 basis points. The current price of 1.1700 presents a delicate pattern of being "sandwiched between the moving averages." Specifically, the price has broken below both the MA20 (1.1707) and MA100 (1.1727). This is a typical mixed structure of "short-term bearishness, but long-term support"—near-term resistance is in the 1.1787 (this week's high) - 1.1792 (Bollinger Band upper trendline) area, while the lower support is between 1.1600 (psychological level) and 1.1666 (38.2% Fibonacci retracement level).
Consider going long on the Euro today at 1.1660, with a stop-loss at 1.1650 and targets at 1.1720 and 1.1730.
Disclaimer: The information contained herein (1) is proprietary to BCR and/or its content providers; (2) may not be copied or distributed; (3) is not warranted to be accurate, complete or timely; and, (4) does not constitute advice or a recommendation by BCR or its content providers in respect of the investment in financial instruments. Neither BCR or its content providers are responsible for any damages or losses arising from any use of this information. Past performance is no guarantee of future results.
Lebih Liputan


Pendedahan Risiko:Instrumen derivatif diniagakan di luar bursa dengan margin, yang bermakna ia membawa tahap risiko yang tinggi dan terdapat kemungkinan anda boleh kehilangan seluruh pelaburan anda. Produk-produk ini tidak sesuai untuk semua pelabur. Pastikan anda memahami sepenuhnya risiko dan pertimbangkan dengan teliti keadaan kewangan dan pengalaman dagangan anda sebelum berdagang. Cari nasihat kewangan bebas jika perlu sebelum membuka akaun dengan BCR.
BCR Co Pty Ltd (No. Syarikat 1975046) ialah syarikat yang diperbadankan di bawah undang-undang British Virgin Islands, dengan pejabat berdaftar di Trident Chambers, Wickham’s Cay 1, Road Town, Tortola, British Virgin Islands, dan dilesenkan serta dikawal selia oleh Suruhanjaya Perkhidmatan Kewangan British Virgin Islands di bawah Lesen No. SIBA/L/19/1122.
Open Bridge Limited (No. Syarikat 16701394) ialah syarikat yang diperbadankan di bawah Akta Syarikat 2006 dan berdaftar di England dan Wales, dengan alamat berdaftar di Kemp House, 160 City Road, London, City Road, London, England, EC1V 2NX. Entiti ini bertindak semata-mata sebagai pemproses pembayaran dan tidak menyediakan sebarang perkhidmatan perdagangan atau pelaburan.

 English
 简体中文
简体中文
 繁體中文
繁體中文
 Bahasa
Melayu
Bahasa
Melayu
 Tiếng
Việt
Tiếng
Việt
 ไทย
ไทย
 日本語
日本語
 한국어
한국어
 ភាសាខ្មែរ
 español
