0
US Dollar Index
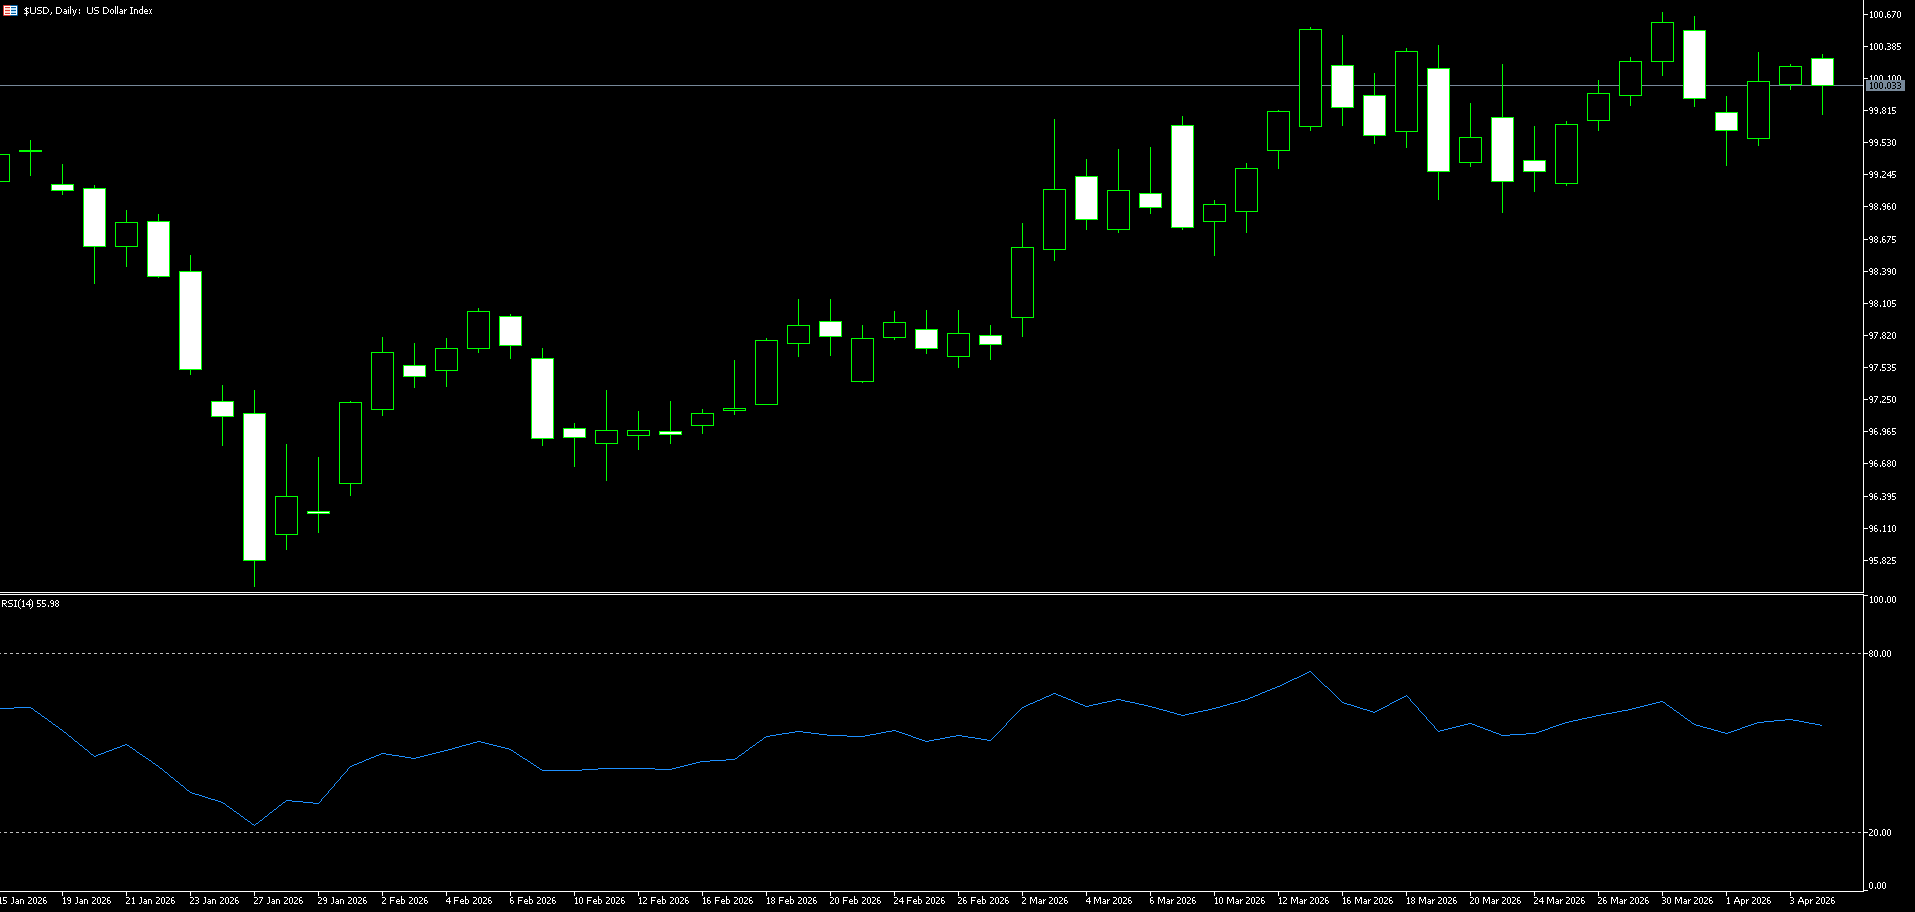
The US dollar index rose above 100 last week. The Middle East conflict, lasting over a month, with real battlefield clashes and Trump's frequent rhetoric creating a fog of uncertainty in the market. The US's status as an energy exporter and investors' safe-haven demand provided solid support for the dollar. In the first three months of this year, the dollar rose 1.67%, its best quarterly performance since the end of 2024. At the beginning of last week, the currency market was optimistic about a possible easing of tensions, but Trump declared in a national address on Wednesday that a "fierce strike against Iran" would be launched within the next two to three weeks, and that the main strategic objectives of the war were nearing completion. The Iranian military responded strongly, threatening even more destructive attacks. Uncertainty returned, and investors sold off risky assets such as stocks, buying dollars instead, causing the yen, euro, and pound to weaken. Safe-haven sentiment is following the typical pattern throughout the conflict—rising oil prices drag down all assets except the dollar, making the dollar the only true safe haven.
From a technical perspective, based on the daily oscillator, the US dollar index's medium-term main trend remains upward, although it has entered a short-term consolidation phase. If the price breaks below 98.88, the main trend will turn downward; conversely, a break above the recent swing high of 100.64 would signify a restart of the upward trend, opening up new upside potential. Currently, the price is still trading above the trendline, and the medium-term upward structure remains intact. The main support levels for the US dollar index are concentrated at two key moving averages: the 200-day moving average at 98.48 and the 50-day moving average at 98.45. The 50-day moving average has now crossed above the 200-day moving average, forming a classic golden cross signal, which will provide strong technical support for the dollar's medium-term upward movement. If this support holds, a faster rebound is expected. The US dollar index's near-term upside target is the March 31 high of 100.64. A strong hold above this level would trigger a powerful upward breakout, with the next potential target at 101.00. In the short term, attention should be paid to the consolidation within the 99.70-99.90 range, with caution advised against profit-taking leading to a further pullback to 99.29.
Today, consider shorting the US dollar index at 100.10, with a stop-loss at 100.22 and targets of 99.70 and 99.60.
WTI Crude Oil
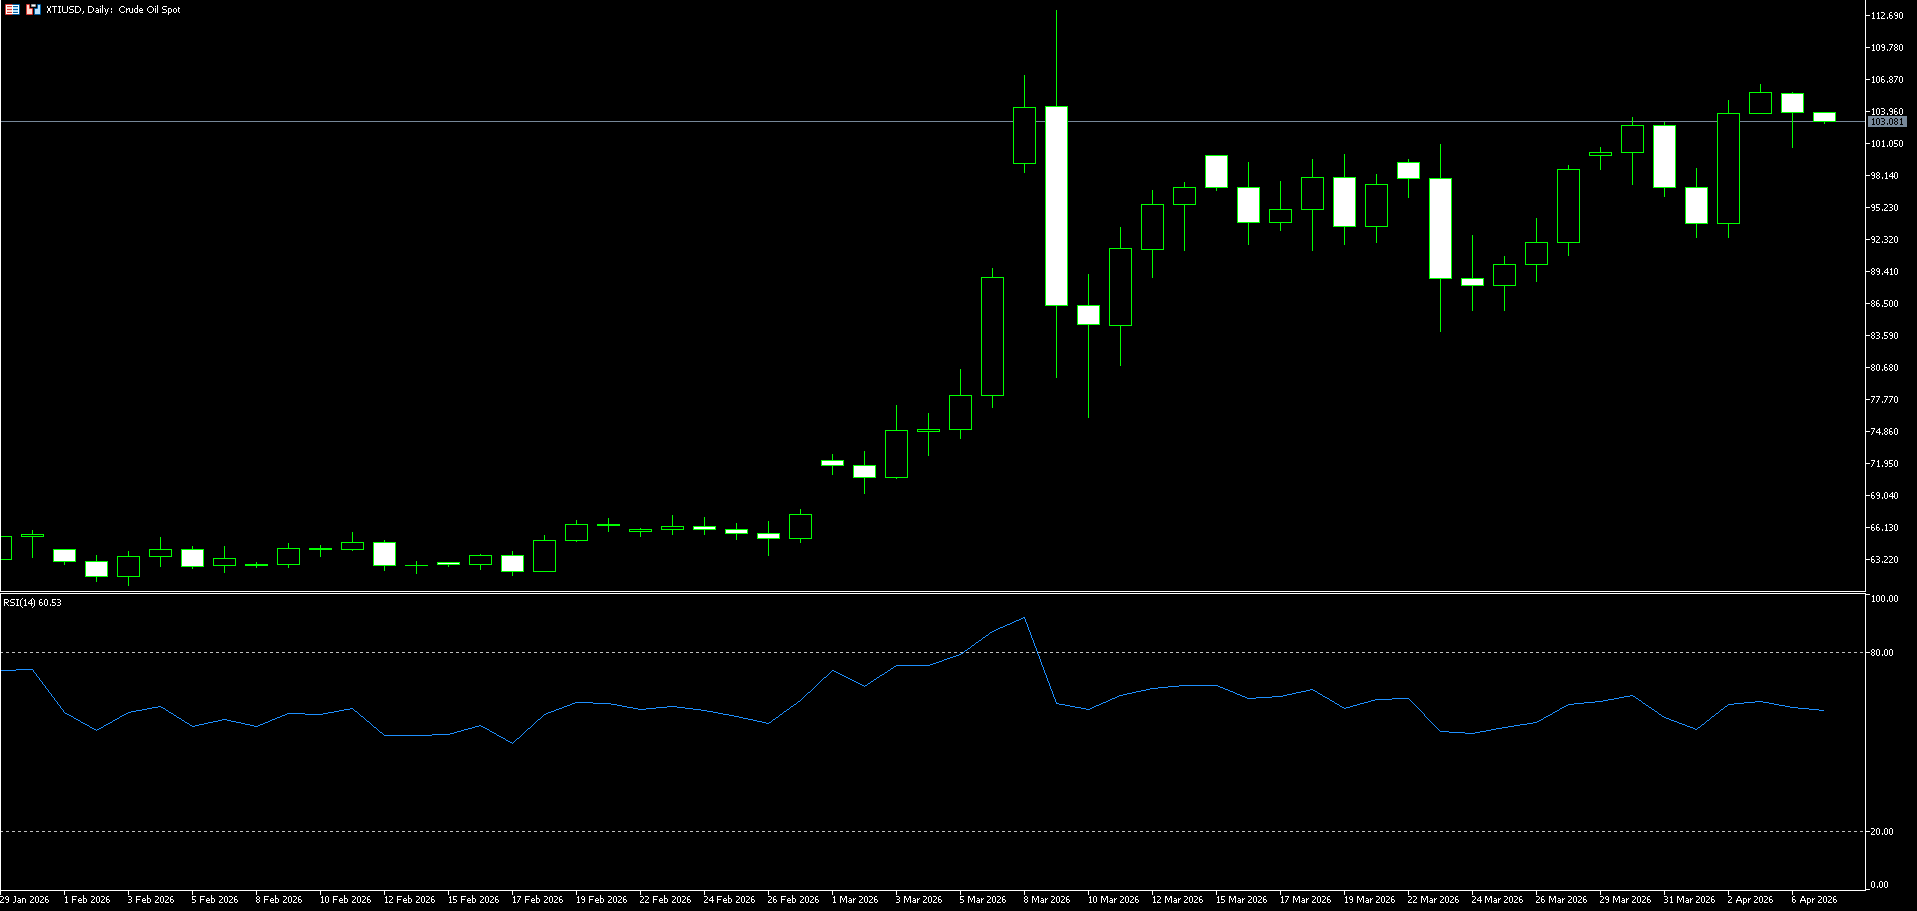
WTI oil prices fell slightly to around 103.70 on Monday. US President Trump again threatened to destroy Iranian power plants, while Tehran showed little sign of accepting US demands to end the war. Trump stated he would escalate military action, saying he would "send them back to the Stone Age." Traders are concerned about potential risks to Iranian oil infrastructure, further delaying the resumption of oil flows. Despite Iran and Oman drafting a protocol to monitor ship traffic in the Strait of Hormuz, the market remains highly tense. The premium of near-month US crude oil contracts over the next and seventh-month contracts hit a record high, and US crude oil prices are nearly $3 higher than Brent crude, the highest in a year. Citigroup predicts a baseline average Brent crude price of $95/barrel for the second half of the year, potentially reaching $130 in an optimistic scenario; JPMorgan Chase suggests that short-term oil prices could rise to $120-$130, and could break through $150 if the Strait of Hormuz remains closed until mid-May.
Technically, the medium- to long-term upward channel for crude oil remains intact since the lows of December 2025. While this week's sharp fluctuations briefly broke through the Bollinger Band middle line, buying pressure emerged quickly, indicating strong defensive sentiment near the $100 level. Currently, the Bollinger Band middle line for WTI crude oil is at $105.78/barrel, and the current price has effectively broken through, showing clear short-term overbought characteristics. Regarding the MACD indicator, the red bars for US crude oil have expanded again, and the DIFF and DEA lines have turned upwards again from high levels, indicating a second wave of bullish momentum. In contrast, the divergence between bulls and bears is extremely pronounced across different commodities. The RSI indicator shows that US crude oil is approaching 70 again, suggesting that short-term risks are accumulating, and investors should be wary of sudden sell-offs due to profit-taking at higher levels. On the upside, watch the 105.85 (Bolliss Upper Bollinger Band) and the 110 (psychological level) area; as for the downside, the first target is 100 (a psychological level), followed by 94.37 (the 20-day moving average).
Today, consider going long on crude oil at 103.60, with a stop loss at 103.40 and targets of 105.50 and 106.50.
Spot Gold
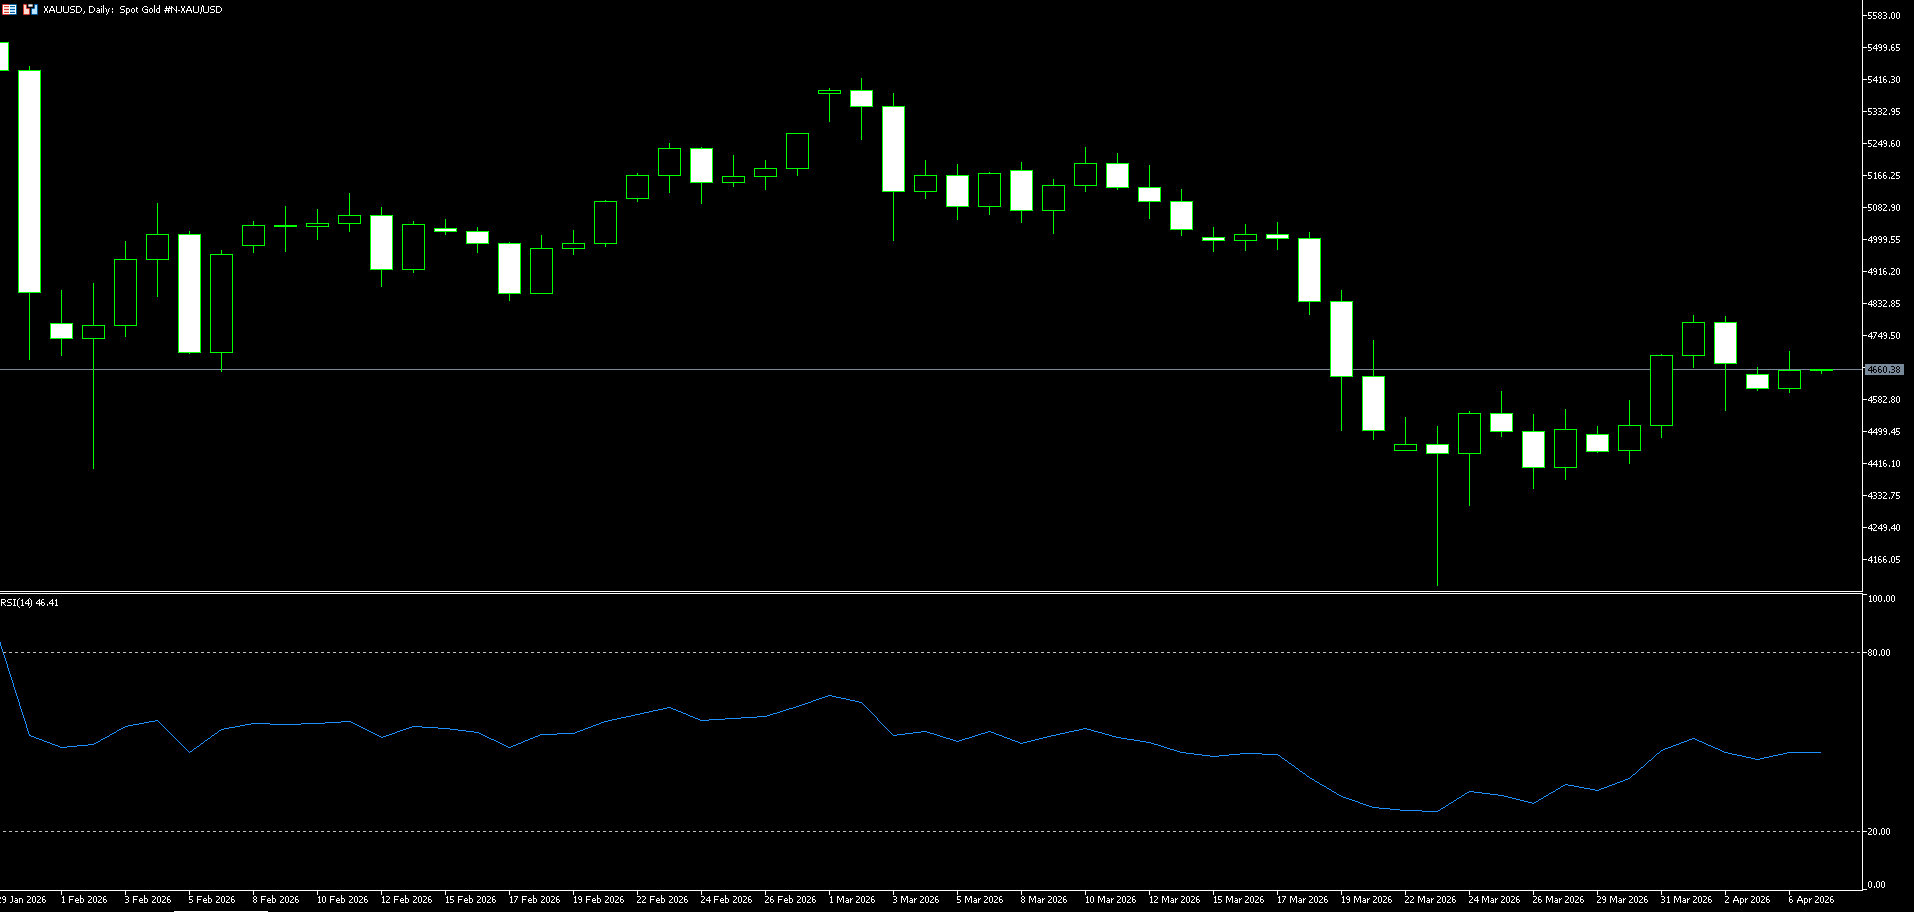
Gold prices fell nearly 1% on Monday, trading around $4645 per ounce. It opened lower and briefly fell to $4600 per ounce, and may test below that level during the day. This was due to the unexpected reversal in US March non-farm payrolls, which led to a continued reduction in market bets on a Fed rate cut. At a crucial moment as the Middle East conflict entered its sixth week, US President Trump issued another strong ultimatum, stating that Iran must reopen the Strait of Hormuz or face devastating consequences. This move instantly ignited market nerves, causing international oil prices to surge. US crude oil rose more than 3% at one point, reaching a high of around $115 per barrel. Gold prices fell 1.5% to around $4,600 per ounce at the start of the week, pressured by rising oil prices fueling inflation concerns, strong US non-farm payroll data in March dampening expectations of a Federal Reserve rate cut, and a stronger US dollar. Besides geopolitical factors, domestic US economic data also significantly weighed on gold.
In summary, Trump's ultimatum and escalating Middle East conflicts will continue to support high oil prices in the short term, while simultaneously exerting downward pressure on gold through inflation and interest rate channels. However, if the conflict drags on further, leading to signs of economic slowdown, or if there is a substantial breakthrough in diplomatic negotiations, gold's safe-haven premium may return. Investors need to closely monitor developments in the Strait of Hormuz, Federal Reserve policy signals, and key economic data. Gold recorded one of its worst monthly performances since 2008 in March, and although it rebounded in early April, it remains in a high-level consolidation range (spot gold is currently around $4,630 per ounce). If gold tests key support levels this week (April 6-10), such as the $4500 (psychological level) - $4567 (9-day moving average) area per ounce, it could even fall further to the 2026 low of $4098 and the $4100 (psychological level). Conversely, if gold can hold above the $4600 (psychological level) and $4567 (9-day moving average), the next target is $4800 (last week's high).
Consider going long on spot gold today at $4643, with a stop loss at $4637 and targets at $4700 and $4710.
AUD/USD
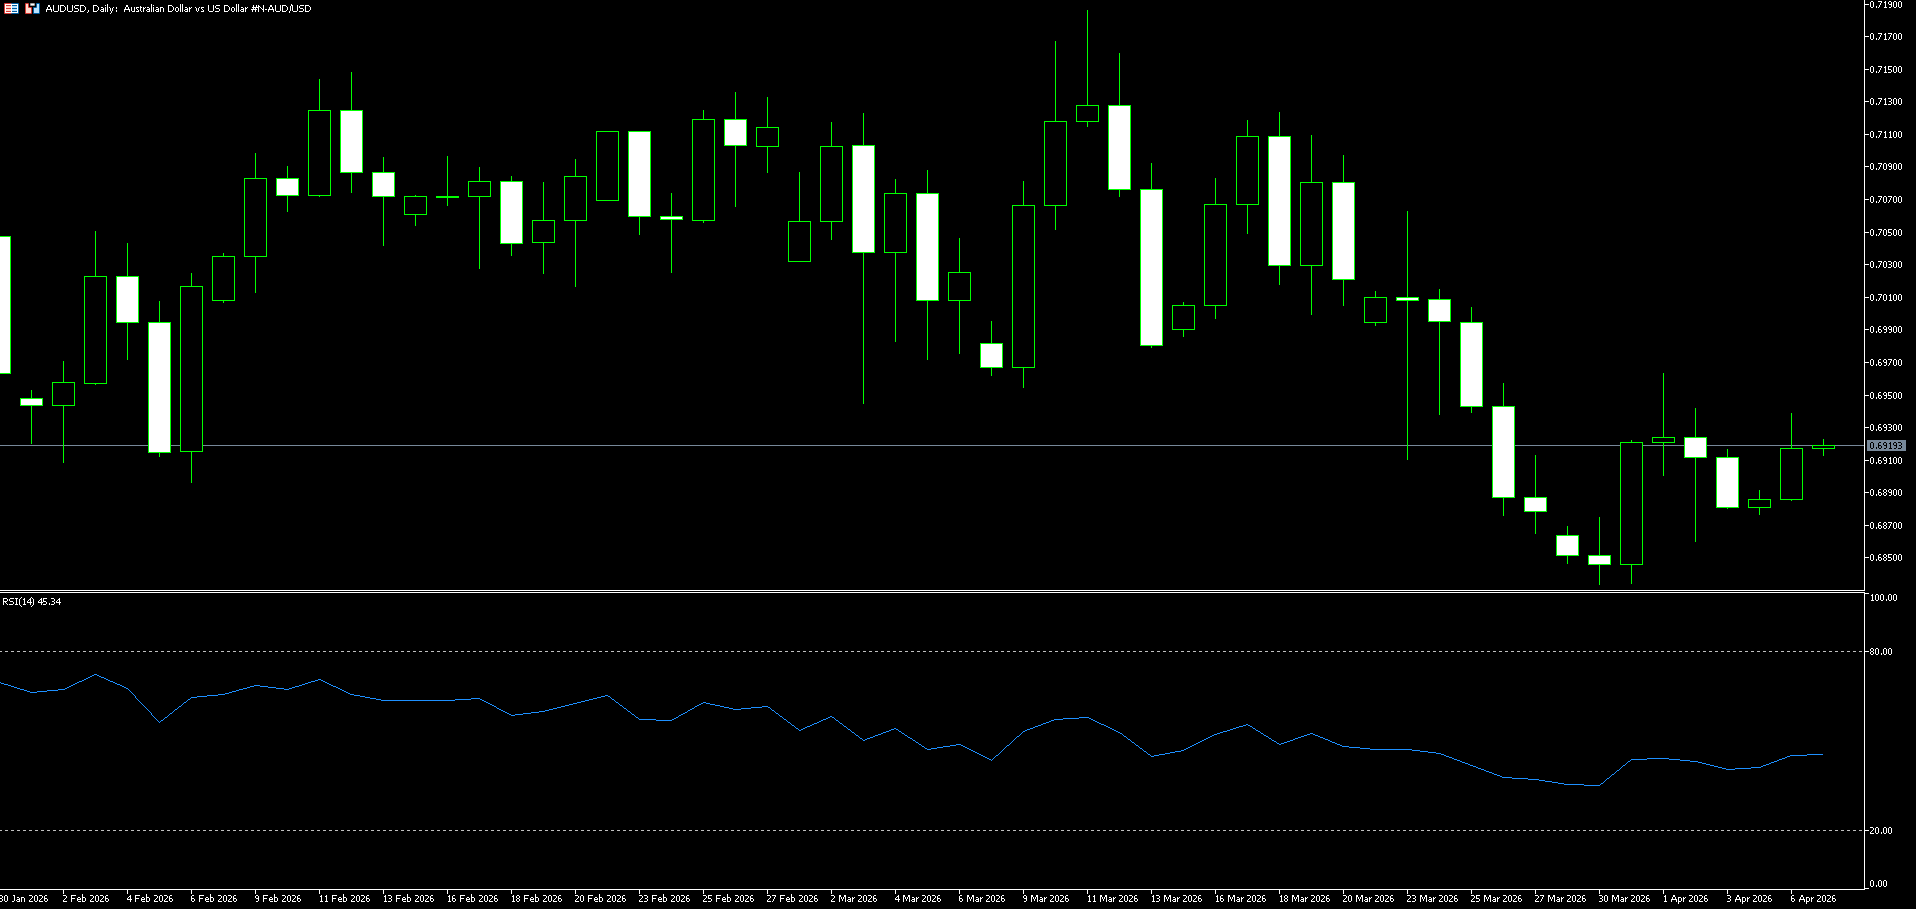
The Australian dollar rebounded slightly against the US dollar on Monday, approaching 0.6915. The dollar strengthened against the Australian dollar due to stronger-than-expected US jobs data and geopolitical tensions in the Middle East. Data released by the US Bureau of Labor Statistics on Friday showed that US non-farm payrolls increased by 17,800 in March. This data significantly exceeded market expectations of a 6.0K increase. The unemployment rate in March slightly decreased to 4.3% from 4.4% in February. Escalating tensions between the US and Iran and concerns about the closure of the Strait of Hormuz continue to boost safe-haven currencies such as the US dollar, posing short-term resistance to the AUD/USD pair. Market expectations for the May meeting lean towards another rate hike due to rising oil prices and a tight labor market. Westpac analysts predict the Reserve Bank of Australia will raise rates three more times by 2026, reaching a cash rate of 4.85%, the highest level since November 2008.
The overall bias for AUD/USD remains supportive, but short-term risks are clearly starting to tilt to the downside. On the daily chart, AUD/USD is trading around 0.6910. The short-term bias is slightly bullish, as the spot price remains above the 100-day and 200-day simple moving averages, both of which are trending upwards, forming a basic uptrend. The exchange rate is consolidating above the 38.2% Fibonacci retracement level near 0.6879 (the 89-day simple moving average) and 0.6870, measured from the low of 0.6421 to the high of 0.7147. The 14-day Relative Strength Index (RSI) is at 43, below the 50 midline, indicating limited upward momentum but no significant bearish pressure yet. Immediate support is at 0.6833, reinforced by the nearby 50% retracement level of 0.6784; a break below this level would expose the next downside target at the 61.8% retracement level of 0.6698. Initial resistance is at the 23.6% retracement level of 0.6975, followed by the 0.7000 psychological level.
Consider going long on the Australian dollar at 0.6900 today, with a stop loss at 0.6890 and targets at 0.6950 and 0.6960.
GBP/USD
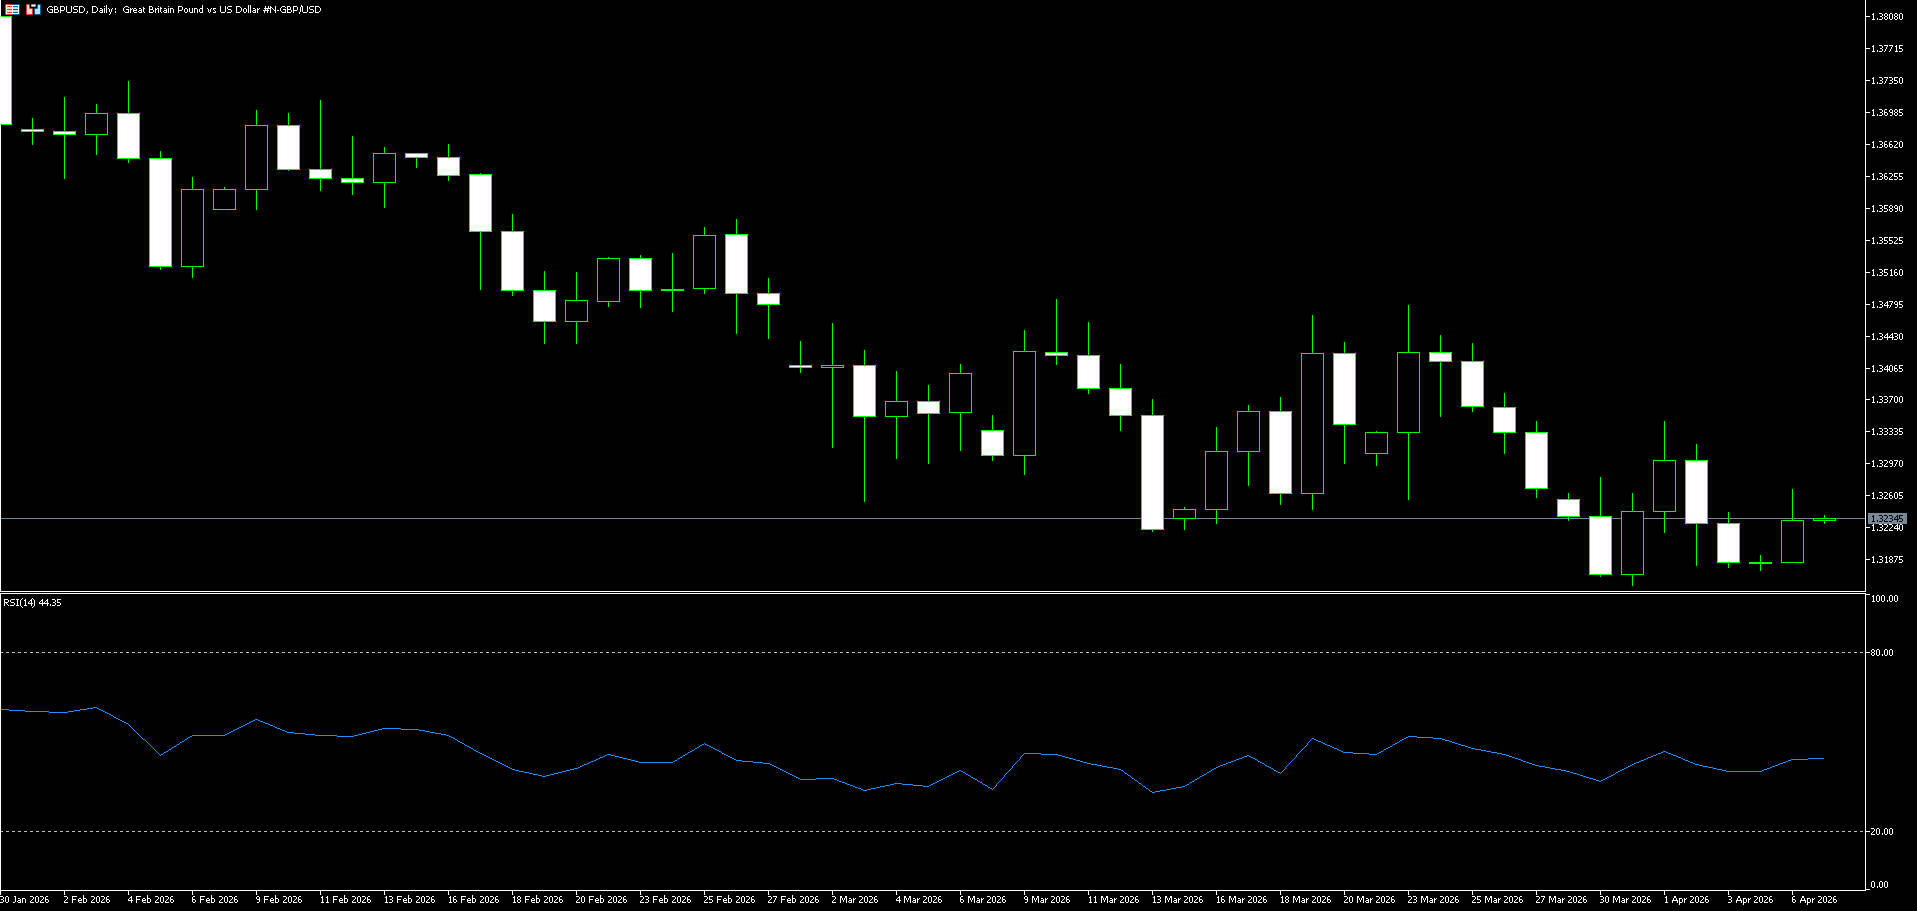
The GBP/USD pair continued its weak performance, hovering in negative territory around 1.3210 during Monday's Asian session. Increased uncertainty in the Middle East and rising safe-haven demand for the US dollar put pressure on the pair. US President Trump set a new deadline for Iran to reopen the Strait of Hormuz on Tuesday, while escalating threats against its power plants and other civilian infrastructure. Iranian officials responded by saying Tehran would retaliate in kind against any attack on its infrastructure, including targeting similar assets owned or linked to the US. Tehran also stated that the strait would remain closed unless it received compensation for war-related losses. The US dollar received additional support as the conflict triggered a sharp rise in energy prices, fueling market speculation that the Federal Reserve might postpone interest rate cuts or even raise rates later this year if inflationary pressures persist. Market participants are now awaiting the latest Federal Open Market Committee meeting minutes for clearer guidance on the central bank's policy direction.
From a technical perspective, the GBP/USD pair continues its downward trend on the daily chart. The previous rebound failed to break through key resistance levels, indicating a continued bearish bias. The exchange rate encountered resistance and fell back in the 1.3312 (20-day simple moving average) - 1.3300 (psychological level) range, which represents previous highs and trend resistance, creating significant selling pressure. Initial support is currently at 1.3200; a break below this level could lead to further declines towards the recent low around 1.3159 (last week's low). A break below 1.3159 would expose the lower boundary of the range and weaken the possibility of a more sustained rebound. Momentum indicators show that the daily MACD has failed to generate sustained upward momentum, and the RSI has fallen back into neutral territory, indicating limited rebound strength. Resistance is seen in the 1.3312 (20-day simple moving average) - 1.3300 (psychological level) range; a break above this area would target 1.3353 (30-day simple moving average).
Today, consider going long on GBP at 1.3225, with a stop-loss at 1.3210 and targets at 1.3260 and 1.3270.
USD/JPY
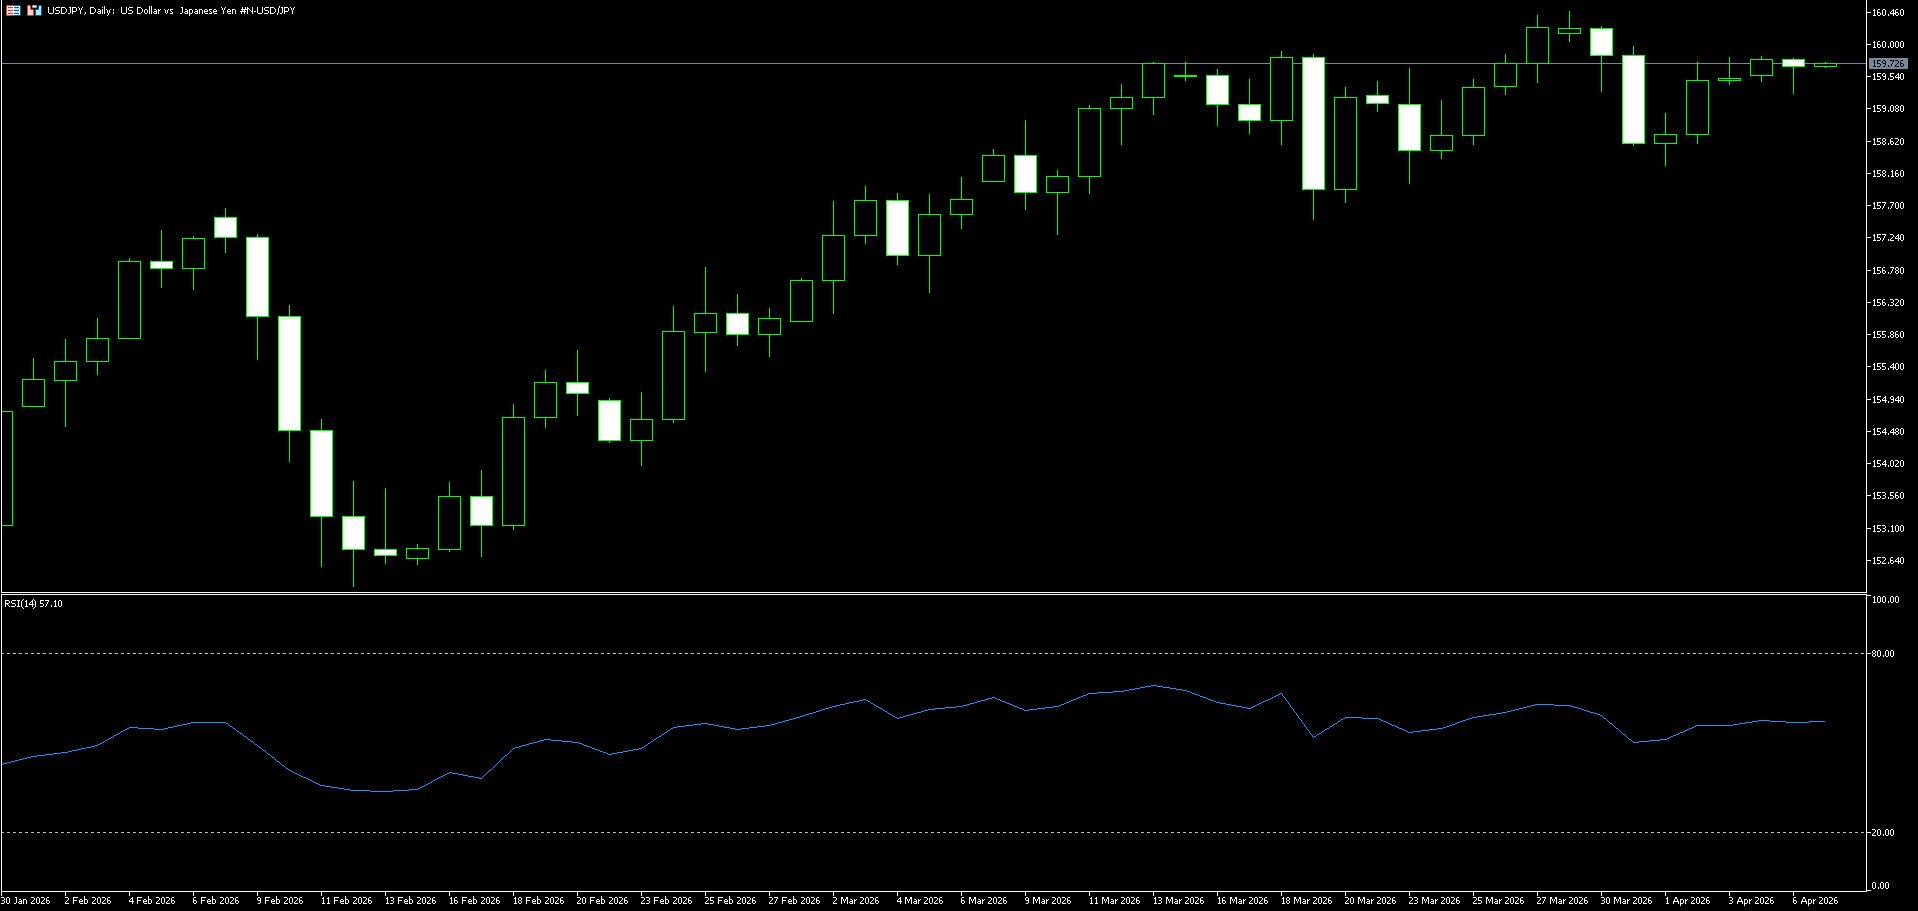
USD/JPY was flat around 159.65 in early Asian trading on Monday. The pair remained stable as traders continued to assess the latest developments in the US-Iran conflict. US President Trump threatened on Sunday to destroy Iranian power plants and bring "hell" to the country starting Tuesday, after the US military successfully rescued a pilot whose fighter jet was shot down a day later. Iran rejected Trump's latest ultimatum, demanding the reopening of the Strait of Hormuz and stating it would retaliate against attacks on infrastructure, as well as similar infrastructure owned by the US or related parties. Uncertainty surrounding a US-Iran ceasefire and ongoing tensions in the Middle East could boost the US dollar in the short term. On the other hand, market concerns about potential US intervention to support its currency could support the yen and act as resistance for the pair. Japan's chief currency diplomat, Akio Mimura, said last week that officials might need to take "decisive" measures if speculative activity continues.
The USD/JPY exchange rate traded flat around 159.65 in early Asian trading on Monday. The rate remained stable as traders continued to assess the latest developments in the US-Iran conflict. USD/JPY maintained its upward trend. The short-term bias is bullish, as the USD/JPY is holding above the 20-day simple moving average around 159.20 and continues to respect the ascending parallel channel established since mid-March. The 14-day Relative Strength Index (RSI) is around 56, maintaining positive momentum and indicating that pullbacks within the channel are still supported, not a sign of a top formation. Immediate support lies around the 159.20 (20-day simple moving average) and 159.00 (psychological level) area, followed by the 30-day simple moving average clustered around 158.45. A break below this area exposes the next support at 157.40, the intersection of the previous consolidation base and the channel projection. Resistance is seen at 160.00 (a psychological level), followed by last week's high of 160.46. A close above 160.46 would confirm a new upward extension, targeting the 161.05 (key weekly resistance) – 161.50 area.
Consider shorting the US dollar at 159.95 today, with a stop loss at 160.05 and targets at 159.00 and 158.80.
EUR/USD
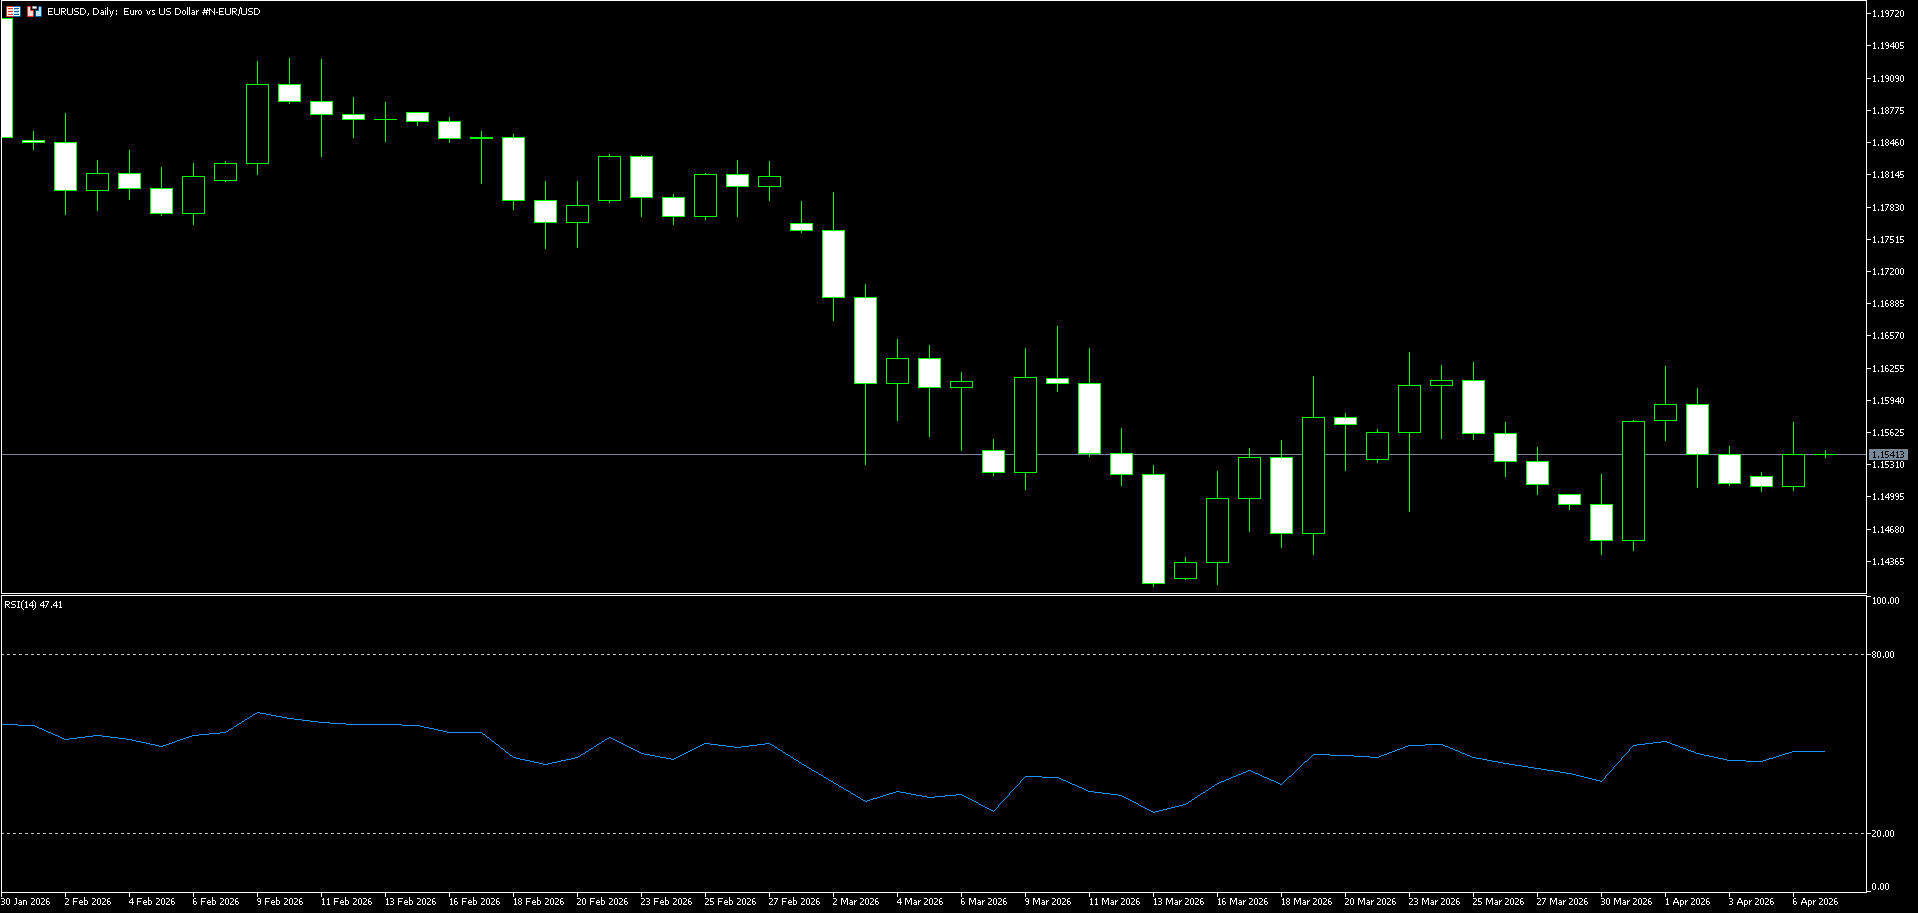
The euro/dollar pair edged higher around 1.1535 in early Asian trading on Monday. Stronger-than-expected US jobs data and heightened uncertainty in the Middle East boosted demand for the dollar as a safe-haven asset. US President Trump appeared to set a new deadline for Iran to reopen the Strait of Hormuz by Tuesday. Trump released a crude message reiterating his threat to bomb power plants and other infrastructure if Tehran did not lift its effective blockade of the vital waterway. Iranian officials stated that Iran would retaliate against attacks on its infrastructure and would target similar infrastructure in the US or related countries. Tehran added that the strait would remain blocked until Iran receives war reparations. The European Central Bank's hawkish tone may have helped limit the euro's decline. The ECB remains firmly committed to combating inflation. President Christine Lagarde and other Governing Council members delivered a consistent message emphasizing that policy will remain tight until inflation sustainably returns to the 2% target.
From a technical perspective, the euro/dollar is slightly bullish as the pair holds steady above the lower Bollinger Band on the daily chart at 1.1434. However, the pair remains below the declining 20-day simple moving average around 1.1642, maintaining a broad correction backdrop. Meanwhile, momentum indicators remain above 0 and continue to rise, while the Relative Strength Index (RSI) near 44 keeps buying pressure in focus. With the spot price holding above 1.1434, the bearish momentum in EUR/USD has weakened. Initial support lies at the 1.1500 (psychological level), followed by deeper support at the lower Bollinger Band on the daily chart at 1.1434. Then comes the 1.400 (psychological level). Immediate resistance is located around the 1.1600 (psychological level) and 1.1593 (30-day simple moving average), while the 1.1674 (200-day simple moving average) limits the next bullish extension area, consistent with the broader cluster of declining moving averages.
Consider going long on the Euro today at 1.1530, with a stop-loss at 1.1520 and targets at 1.1580 and 1.1570.
Disclaimer: The information contained herein (1) is proprietary to BCR and/or its content providers; (2) may not be copied or distributed; (3) is not warranted to be accurate, complete or timely; and, (4) does not constitute advice or a recommendation by BCR or its content providers in respect of the investment in financial instruments. Neither BCR or its content providers are responsible for any damages or losses arising from any use of this information. Past performance is no guarantee of future results.
Lebih Liputan


Pendedahan Risiko:Instrumen derivatif diniagakan di luar bursa dengan margin, yang bermakna ia membawa tahap risiko yang tinggi dan terdapat kemungkinan anda boleh kehilangan seluruh pelaburan anda. Produk-produk ini tidak sesuai untuk semua pelabur. Pastikan anda memahami sepenuhnya risiko dan pertimbangkan dengan teliti keadaan kewangan dan pengalaman dagangan anda sebelum berdagang. Cari nasihat kewangan bebas jika perlu sebelum membuka akaun dengan BCR.
BCR Co Pty Ltd (No. Syarikat 1975046) ialah syarikat yang diperbadankan di bawah undang-undang British Virgin Islands, dengan pejabat berdaftar di Trident Chambers, Wickham’s Cay 1, Road Town, Tortola, British Virgin Islands, dan dilesenkan serta dikawal selia oleh Suruhanjaya Perkhidmatan Kewangan British Virgin Islands di bawah Lesen No. SIBA/L/19/1122.
Open Bridge Limited (No. Syarikat 16701394) ialah syarikat yang diperbadankan di bawah Akta Syarikat 2006 dan berdaftar di England dan Wales, dengan alamat berdaftar di Kemp House, 160 City Road, London, City Road, London, England, EC1V 2NX. Entiti ini bertindak semata-mata sebagai pemproses pembayaran dan tidak menyediakan sebarang perkhidmatan perdagangan atau pelaburan.

 English
 简体中文
简体中文
 繁體中文
繁體中文
 Bahasa
Melayu
Bahasa
Melayu
 Tiếng
Việt
Tiếng
Việt
 ไทย
ไทย
 日本語
日本語
 한국어
한국어
 ភាសាខ្មែរ
 español