


0
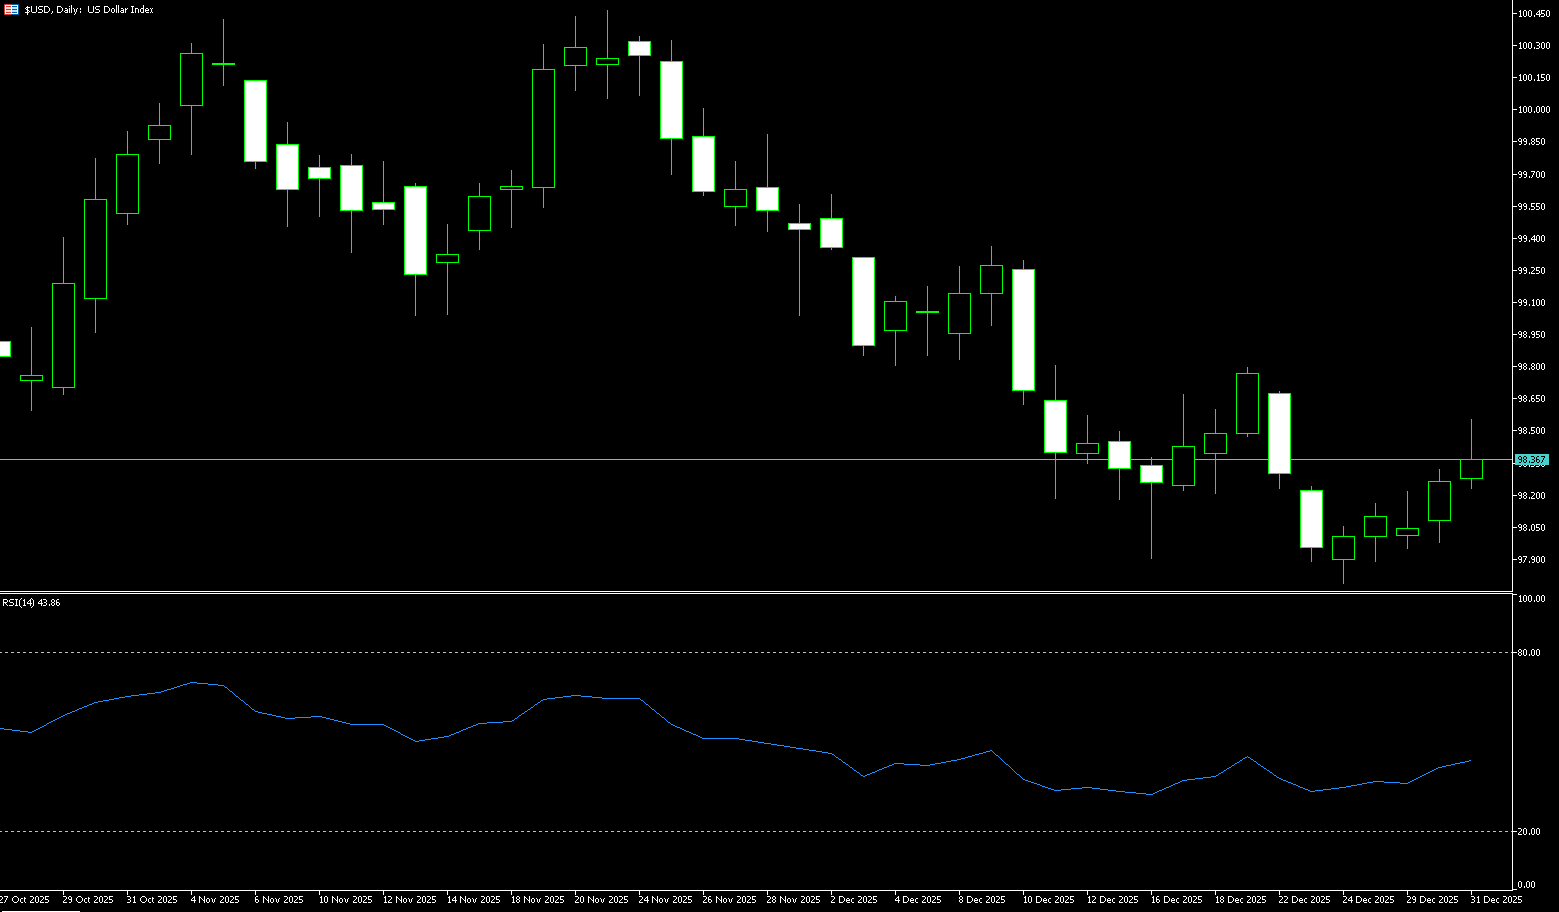
US Dollar Index
On the last trading day of 2025, the US dollar remained stable around 98.25, near its lowest level since early October, and on track for its biggest annual decline since 2017. The dollar has fallen 9.4% this year, reflecting a turbulent period that began with President Trump's chaotic rollout of tariffs. Expectations of a Fed rate cut, narrowing interest rate differentials with other major currencies, and concerns about fiscal deficits and the Fed's independence have also contributed to the dollar's weakness. Investors are now closely watching the appointment of the new Fed chair, with Trump expected to announce Jerome Powell's successor early next year. Meanwhile, the minutes of the Fed's December meeting showed that most officials believed further rate cuts would be appropriate if inflation fell further, although they remained divided on the timing and scope of any rate cuts. Traders are currently pricing in two quarter-point rate cuts in 2026.
From a daily chart technical analysis perspective, the US dollar index is currently in a sensitive triangle consolidation zone. Volatility has narrowed somewhat. The MACD indicator shows signs of a weak golden cross, but overall momentum remains weak, suggesting insufficient rebound strength. Key price levels are clearly visible. The US dollar index recently fell from a high of 100.39 to 97.75, where buying activity was once active. However, the 97.75 level is below the 61.8% Fibonacci retracement level of the September-November upward wave, and its support effectiveness is being tested. More important reference points are 97.11 (the lower limit of the correction range of the September-November rally) and the yearly low of 96.22 reached in September. If the index effectively breaks above 98.55 (the 25-day moving average) and further rises above 98.71 (the high of December 22), it will highly likely open up space for a retest of the yearly low.
Today, consider shorting the US Dollar Index around 98.38; Stop loss: 98.48; Target: 98.00; 97.90
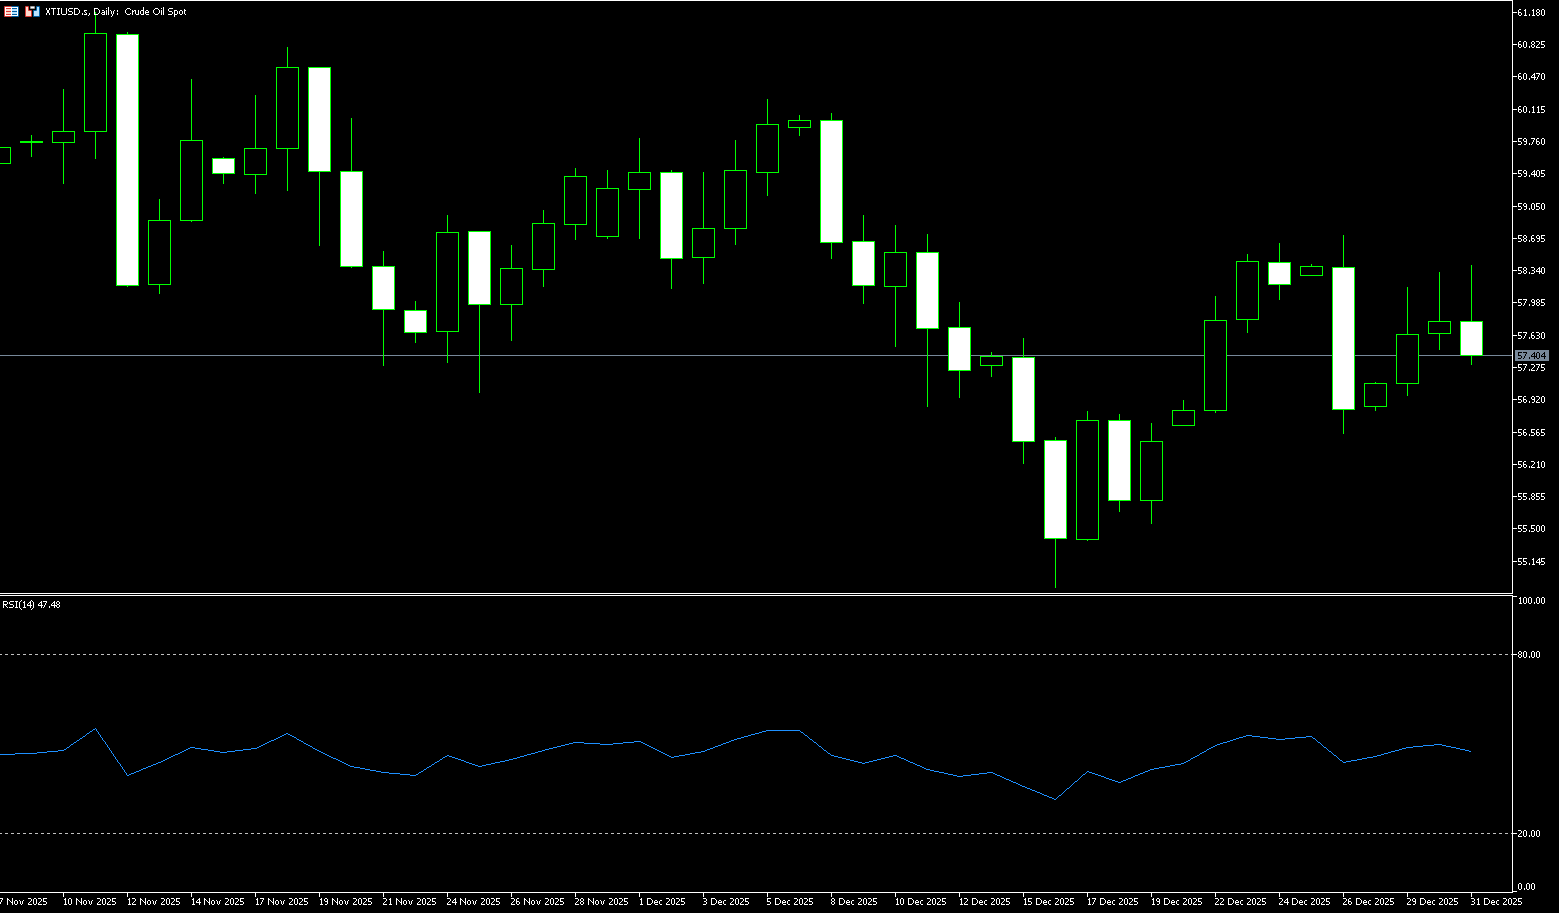
WTI Crude Oil
WTI crude oil futures fell to $57.30 per barrel on the last day of 2025, on track for the biggest annual drop since 2020, due to concerns about oversupply. Investors are now focused on the upcoming OPEC+ meeting, geopolitical developments, and the US inventory report. OPEC+ is expected to maintain its suspension of supply increases until the first quarter of 2026 at its meeting on Sunday. Geopolitical factors continue to support prices, including the US blockade of Venezuelan oil shipments, new instability in the Middle East, and continued uncertainty surrounding the Russia-Ukraine peace agreement. Meanwhile, the API estimated that US crude oil inventories increased by 1.7 million barrels last week, which, if confirmed later, would be the largest increase since mid-November. WTI crude oil is down more than 1% so far in December, on track for its fifth consecutive monthly decline, and has fallen nearly 20% for the year.
From the daily chart, US crude oil formed a low around $54.88 and then experienced a significant technical rebound, with the short-term pattern resembling a V-shaped reversal followed by a pullback. Currently, the price is between two key levels: $57.00 and $60.00 (psychological barriers). $57.00 acts as a "bottoming line" after the previous decline, followed by the key support at $55.72 (the low of December 18th). $60.00, however, is a psychological "watershed" that the rebound needs to overcome. As long as oil prices cannot effectively hold above $60.00, the rebound remains a corrective phase within a downtrend, more of a range-bound trading activity with buying low and selling high. Conversely, a decisive break and confirmation of a move above $60.00 would open up upward potential, potentially testing the resistance zone around $60.50 and even the previous high of $61.50.
Today, consider going long on crude oil around 57.15; Stop loss: 57.00; Target: 58.50; 58.70
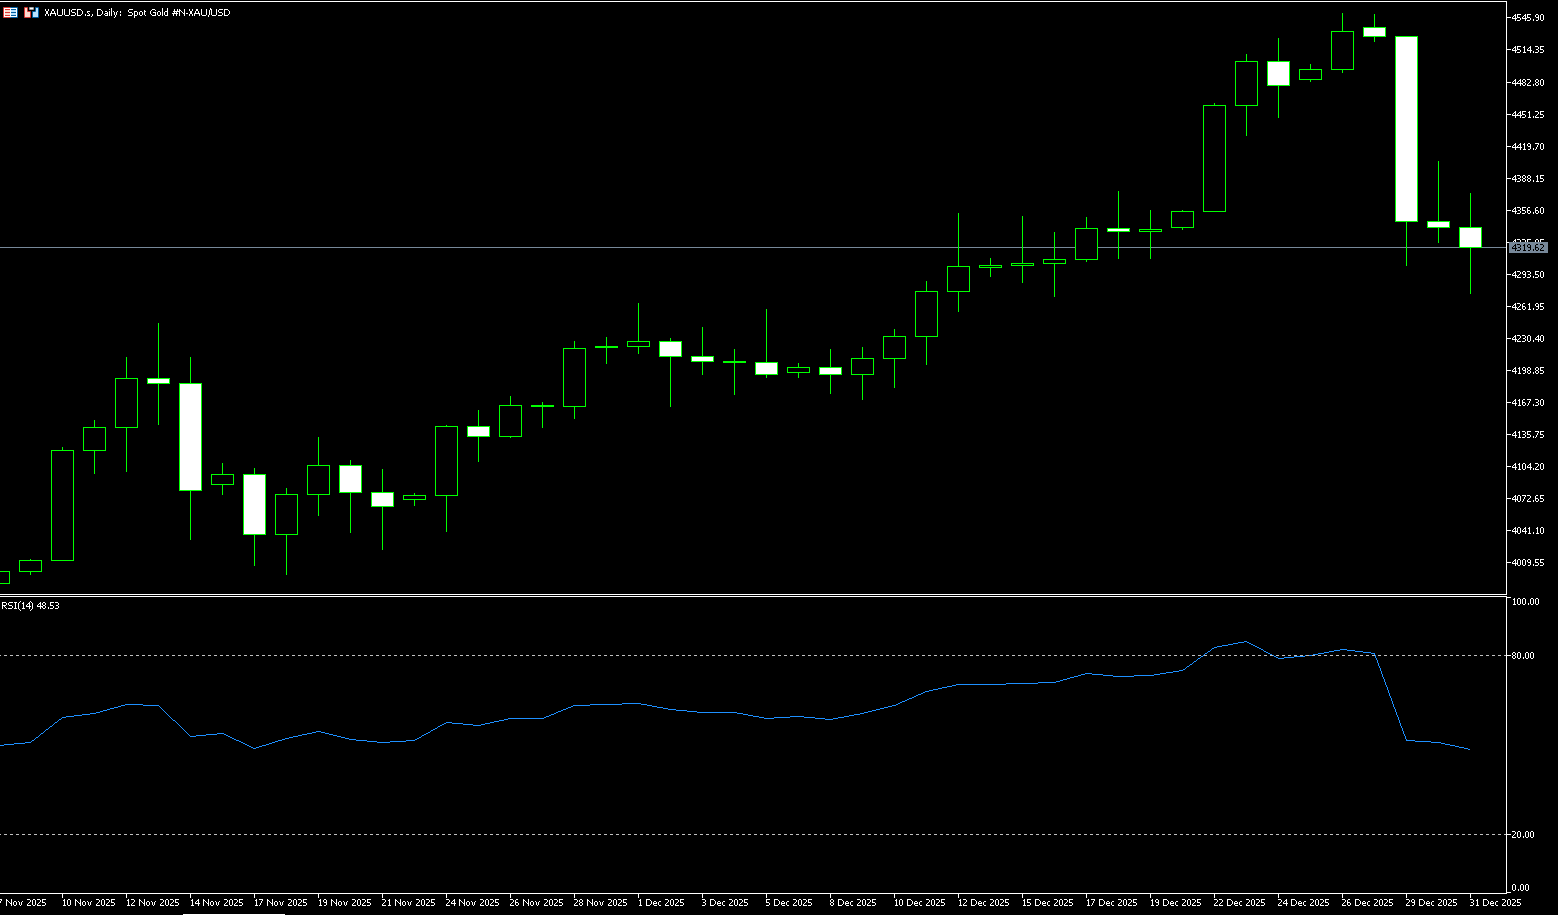
Spot Gold
On Thursday (January 1, 2026), most global markets were closed for the New Year holiday, resulting in thin trading. Gold prices closed lower on Wednesday, but achieved a remarkable gain of approximately 64% for the year 2025, marking the largest annual gain in nearly 46 years since 1979. On the last trading day of 2025, spot gold fell 0.6% to $4318.67 per ounce. Silver plunged 6.7% to $71.36. Short-term prices fluctuated under profit-taking pressure, but the long-term outlook remains optimistic. Some believe that gold could reach $5,000 per ounce in 2026, and silver could challenge $100. Currently, gold prices have broken below the key resistance level of $4,381.20, which has been in place since October, and are currently trading at $4,318. Aggressive bulls who bet on a breakout are now trapped. The key 50-day moving average at $4,180.60, a core trend indicator that has driven gold prices higher since August, is now in jeopardy.
According to the daily chart, the bullish outlook for precious metals remains intact, with prices holding above the key 50-day simple moving average at $4,180.60, while the DAX channel width is widening. The path of least resistance is upward, and the 14-day Relative Strength Index (RSI) is pointing upward above the midline. This indicates recent upward momentum. The first resistance level for gold is at $4,370 (the 14-day simple moving average). If prices steadily move above this level, it could pave the way for a breakout towards the $4,400 psychological level, and subsequently challenge the $4,500 psychological barrier. On the other hand, initial support for gold is seen in the $4,305-$4,300 area, representing the low of December 29th and a psychological level. A stronger pullback could drag gold towards the December 16th low of $4,271.
Consider going long on spot gold today around $4,313; Stop loss: $4,308; Target: $4,340; $4,350
AUD/USD
The Australian dollar stabilized around $0.6675 on Wednesday, marking its second consecutive trading day of support, supported by expectations of a Reserve Bank of Australia (RBA) rate hike. The latest RBA meeting minutes showed that the board is prepared to tighten policy if inflation does not slow as expected, focusing on the fourth-quarter CPI report to be released on January 28th. Analysts say stronger-than-expected core inflation data for the fourth quarter could prompt the central bank to raise rates at its February 3rd meeting, with the market currently pricing in a roughly 28% probability of a 25 basis point rate hike. The Australian dollar has benefited from record commodity price increases, including gold, silver, and copper, reflecting Australia's strong export structure. The currency is currently moving towards an 8.5% annual gain, its first in five years, and has also appreciated against the Japanese yen, reaching a 17-month high and rising nearly 7% so far this quarter.
The AUD/USD pair saw a slight pullback to just below 0.6700 on Wednesday. The pair remains above the rising 25-day simple moving average at 0.6643, maintaining its short-term uptrend and favoring higher lows. The 14-day Relative Strength Index (RSI) at 58.60 (above the midline) confirms positive momentum. As long as prices remain above the moving averages, pullbacks will remain manageable, and the bias remains bullish. Trend conditions remain solid as the 25-day simple moving average continues to slope upwards, with support in the 0.6601 (34-day simple moving average) – 0.6600 (psychological level) range. The RSI has not yet reached overbought levels, leaving room for an extension towards 70. A weekly close above the 0.6700 level would open the door to further gains, targeting this week's high of 0.6727, and then to the October 7 high of 0.6810.
Consider going long on the Australian dollar today around 0.6660; Stop loss: 0.6650; Target: 0.6700; 0.6715

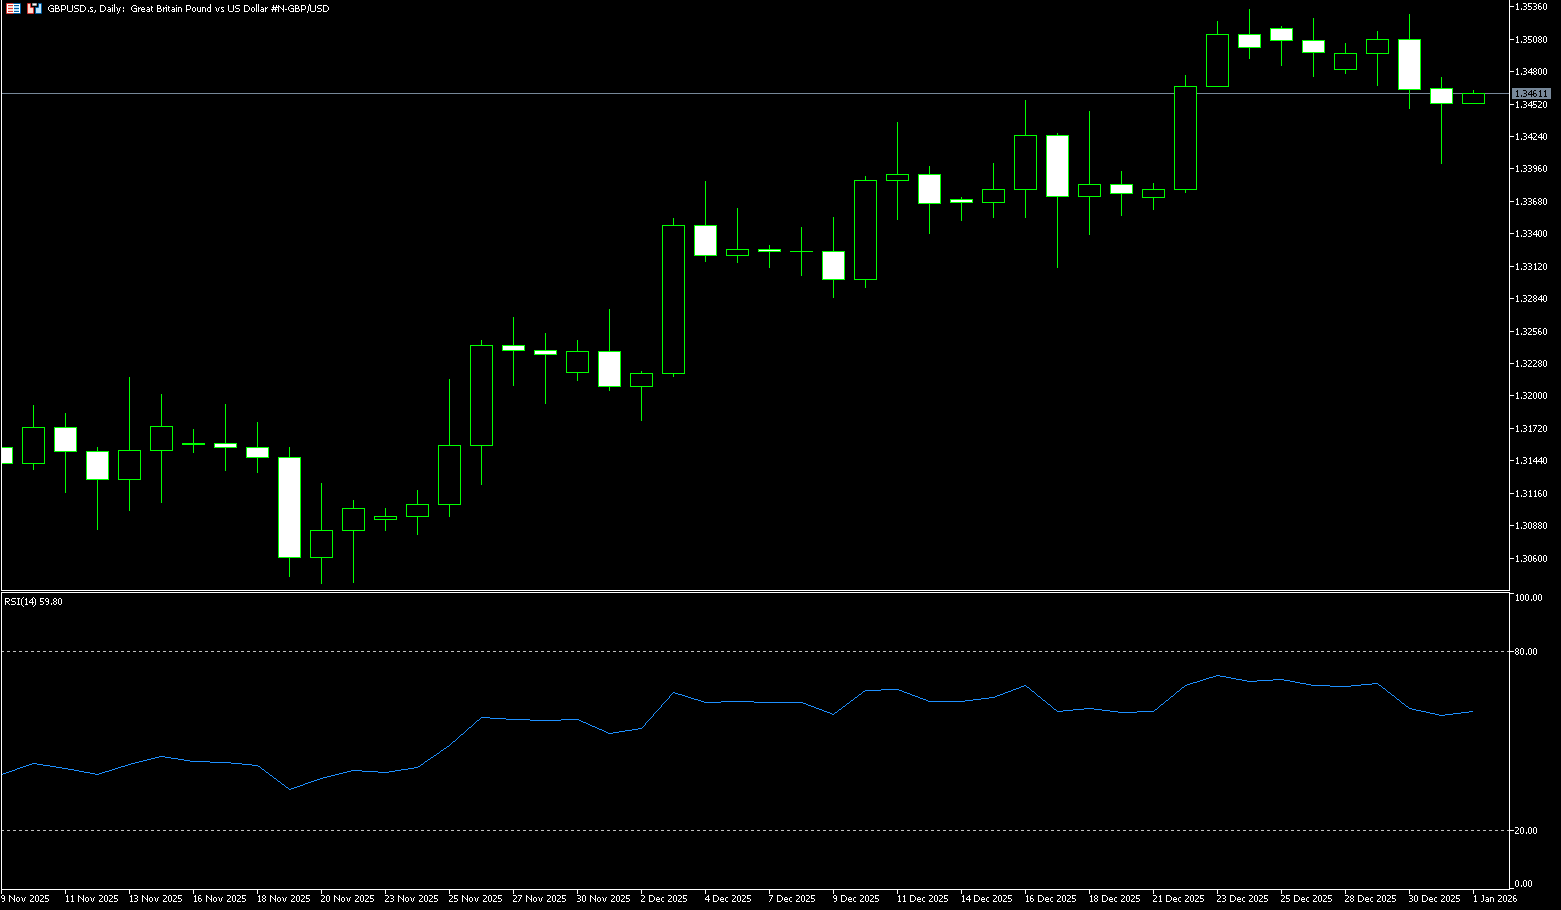
GBP/USD
The pound is trading at $1.3460, marking a 7.5% appreciation against the dollar in 2025, its biggest annual gain since a 9.5% appreciation in 2017. The pound has benefited from the divergence in interest rate cut expectations between the Bank of England and the Federal Reserve in 2026, as well as a relatively lackluster autumn budget, which has eased pressure on the pound in the latter half of the year. The Bank of England has cut rates four times in 2025, despite policymakers' differing opinions and indications that the already slowing pace of cuts may slow further. In the US, investors anticipate further easing in 2026 amid signs of a slowing labor market. Domestic political concerns and stagnant economic growth in the UK have capped the pound's gains.
On the daily chart, the pound is trading slightly lower against the dollar at 1.3460. The 20-day simple moving average is rising at 1.3420, and the pair is holding above it, maintaining a short-term bullish bias. This moving average has been steadily rising in recent trading and now provides immediate dynamic support. The 14-day relative strength index (RSI) is above 60, on the positive side of the neutral zone, and has pulled back from recent highs, maintaining good momentum without overextending. Measured from the high of 1.3788 to the low of 1.3010, the 61.8% Fibonacci retracement level at 1.3491 acts as resistance as the pair advances towards the upper half of the retracement chart. If the daily close is above the 1.3491-1.3500 level, the upward trend may continue to the 76.4% Fibonacci retracement level at 1.3602. Failure to break through will limit the rebound and cause the exchange rate to retrace to the 20-day simple moving average at 1.3420 and the psychological level of 1.3400.
Consider going long on GBP/USD around 1.3454 today; Stop loss: 1.3442; Target: 1.3500; 1.3510
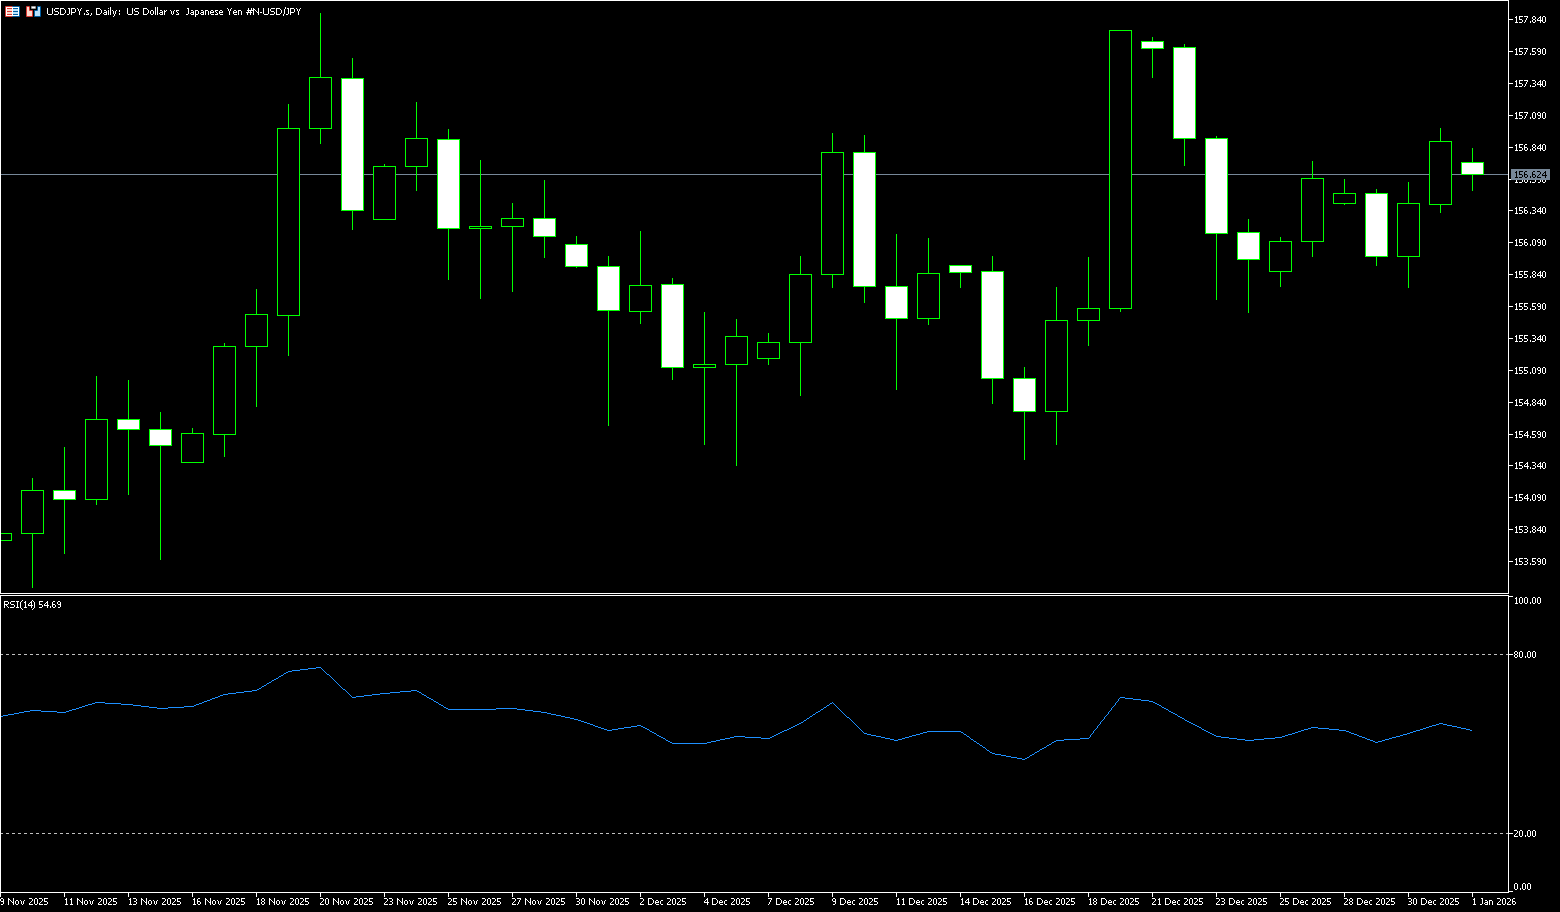
USD/JPY
The yen weakened against the dollar on Wednesday in thin holiday trading, reaching around 156.70, extending losses from the previous session as investors weighed the impact of Japan's expansionary fiscal policy. The cabinet recently approved Prime Minister Sanae Takashi's record 122.3 trillion yen budget, aimed at balancing aggressive fiscal spending and debt management by limiting new bond issuance. However, Japan's fiscal situation remains a concern. With public debt now more than twice the size of the country's economy, the government faces limited flexibility in implementing bold stimulus measures. The yen's decline was partially offset by signals from authorities suggesting potential intervention, following Finance Minister Katayama's emphasis on Japan's right to act on excessive currency volatility. The yen is on track for its first annual gain, having raised interest rates twice this year, ending four consecutive years of decline.
From the daily chart, USD/JPY is currently in a typical consolidation market structure. The previous rally formed a clear supply zone near the psychological levels of 157.89 and 158.00, followed by a pullback and repeated fluctuations, with the exchange rate gradually settling above 155.700. The current price is near the upper limit of the range, indicating that bulls are still attempting to resume the upward trend, but the upper resistance zone is dense, and a breakout will require stronger momentum and more ample liquidity. The key support level to watch is first at 156.00-155.70, which acts as a dividing line between bullish and bearish sentiment: holding above this level suggests a consolidation phase after a pullback; a decisive break below this level could lead to a retest of the 154.850 area, or even a deeper pullback to the previous low of 154.342.
Consider shorting the US dollar today around 157.05; Stop loss: 157.30; Target: 156.10; 156.00
EUR/USD
EUR/USD turned positive on Wednesday's daily chart. The pair found support at 1.1720 during the early European session and traded slightly above 1.1740 as it entered the US session. The dollar's rally has weakened, with US jobless claims expected to add some dynamism to a lackluster year-end trading session. However, from a broader perspective, the euro remains on track for a 14% annual appreciation, supported by the monetary policy divergence between the ECB and the Fed. In addition, US President Donald Trump's volatile trade policies and the slowdown in the US economy have put heavy pressure on the dollar. On Tuesday, the FOMC meeting minutes confirmed broad disagreements among Federal Reserve policymakers. This casts doubt on the timing of the next rate cut. The dollar appreciated after the release of the minutes.
In late Wednesday trading, the euro/dollar pair showed a modest rebound, but technical indicators remained negative. The 4-hour Relative Strength Index (RSI) rebounded from lows near oversold territory but remained below the key 50 level, while the Moving Average Convergence/Divergence (MACD) showed weakening bearish momentum but remained below zero. On the upside, the counter-trend line, currently around 1.1770, could pose significant resistance in the event of a bullish reversal. This level closes the path to the highs of December 16th and 24th (near the 1.1805 area) and the highs of September 23rd and 24th (near 1.1820). Conversely, a bearish reversal may face support at the lows of December 17th and 19th (near 1.1700). Further downside targets are the highs of December 4th and lows of December 11th, around 1.1680, followed by the lows of December 8th and 9th, in the 1.1615 area.
Consider going long on the Euro today around 1.1732; Stop loss: 1.1720; Targets: 1.1780; 1.1790

Disclaimer: The information contained herein (1) is proprietary to BCR and/or its content providers; (2) may not be copied or distributed; (3) is not warranted to be accurate, complete or timely; and, (4) does not constitute advice or a recommendation by BCR or its content providers in respect of the investment in financial instruments. Neither BCR or its content providers are responsible for any damages or losses arising from any use of this information. Past performance is no guarantee of future results.
More Coverage


Risk Disclosure:Derivatives are traded over-the-counter on margin, which means they carry a high level of risk and there is a possibility you could lose all of your investment. These products are not suitable for all investors. Please ensure you fully understand the risks and carefully consider your financial situation and trading experience before trading. Seek independent financial advice if necessary before opening an account with BCR.
BCR Co Pty Ltd (Company No. 1975046) is a company incorporated under the laws of the British Virgin Islands, with its registered office at Trident Chambers, Wickham’s Cay 1, Road Town, Tortola, British Virgin Islands, and is licensed and regulated by the British Virgin Islands Financial Services Commission under License No. SIBA/L/19/1122.
Open Bridge Limited (Company No. 16701394) is a company incorporated under the Companies Act 2006 and registered in England and Wales, with its registered address at Kemp House, 160 City Road, London, City Road, London, England, EC1V 2NX. This entity acts solely as a payment processor and does not provide any trading or investment services.

 English
 简体中文
简体中文
 繁體中文
繁體中文
 Bahasa
Melayu
Bahasa
Melayu
 Tiếng
Việt
Tiếng
Việt
 ไทย
ไทย
 日本語
日本語
 한국어
한국어
 ភាសាខ្មែរ
 español