


0
The US Dollar Index
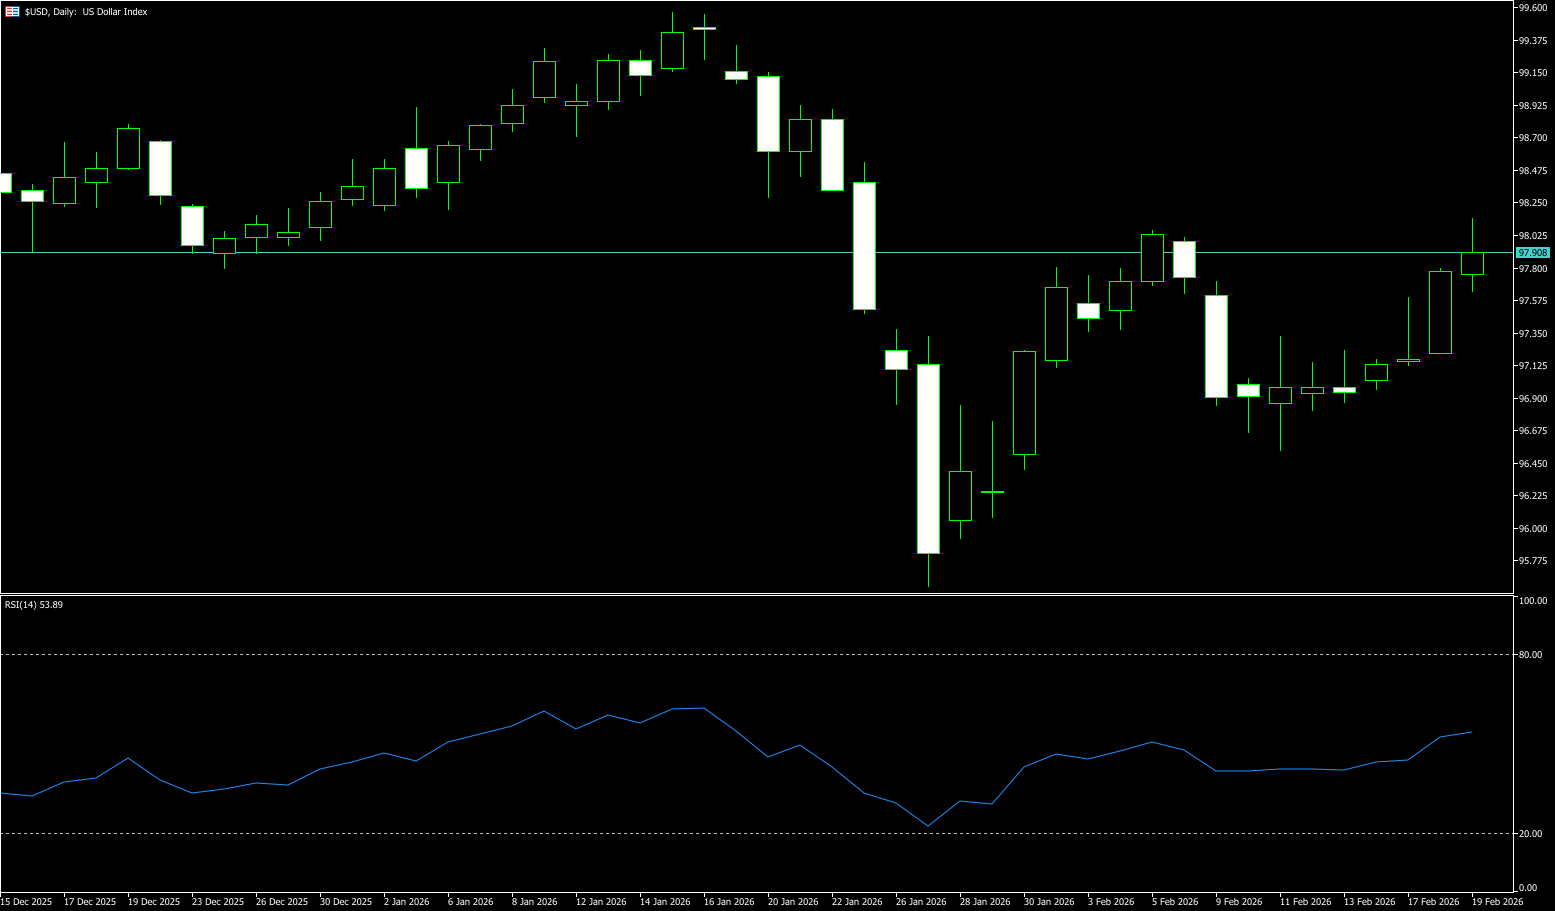
Midweek, influenced by better-than-expected US durable goods orders data, the US Dollar Index, which measures the dollar against six major currencies, steadily climbed to the 98.00 level. Ahead of the release of the Federal Open Market Committee (FOMC) meeting minutes, the global foreign exchange market entered a cautious wait-and-see state. These minutes, as a core source for understanding the Fed's interest rate policy path, will directly dominate the dollar's short-term trend and transmit to core financial areas such as global trade and emerging market assets. The current stability of the dollar index around 97.70 is inseparable from the dual support of fundamentals and policy expectations. The market generally believes that compared to major central banks such as the European Central Bank and the Bank of Japan, the Fed is more likely to maintain a long-term high interest rate stance. Coupled with strong performance in core US economic data such as employment and consumption, this has significantly cooled market bets on aggressive short-term rate cuts. The divergence in economic fundamentals and monetary policies between the US and Europe, and between the US and Japan, has become the core logic behind the dollar's strength.
Overall, the US Dollar Index is currently at a convergence point of multiple factors, including policy, data, and technical indicators. Better-than-expected durable goods orders, safe-haven buying due to geopolitical risks, and the relative attractiveness of US Treasury yields have collectively supported the US dollar. Meanwhile, policy signals from the FOMC minutes and expectations of a revised Fed policy logic triggered by the AI controversy will be key catalysts for a new round of dollar price movements. From a technical perspective, the 97.00 (psychological level) - 97.10 (20-day moving average) area is a key recent support/resistance level. If it holds above this level, the dollar is expected to test the 98.00 (psychological level) - 98.28 (65-day moving average) range; if it falls back under pressure, it will retest the 97.30 (14-day moving average) support, followed by the 97.00 (psychological level) - 97.10 (20-day moving average) area.
Today, consider shorting the US Dollar Index around 97.90; Stop loss: 98.00; Target: 97.40; 97.50
WTI Crude Oil
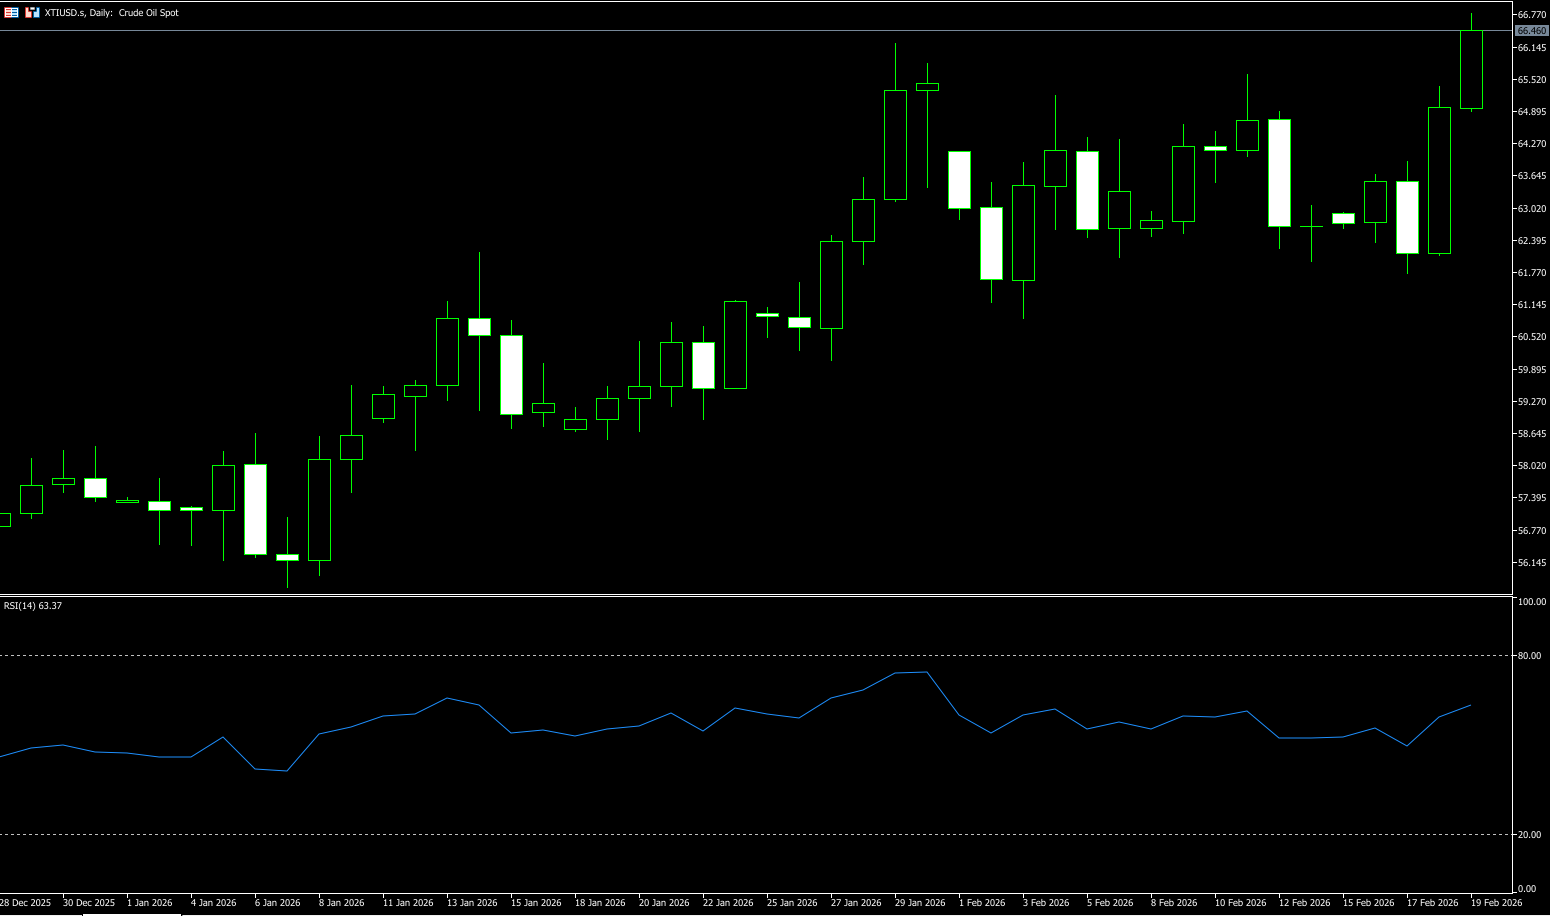
US crude oil is trading around $66.50 per barrel. Oil prices rose more than 4% mid-week due to escalating tensions between the US and Iran and the lack of breakthroughs in Russia-Ukraine negotiations, exacerbating market concerns about potential supply disruptions. The bombing of the Russian CPC pumping station, coupled with simultaneous production cuts/shutdowns in the Black Sea, North America, and Canada, created a triple supply shock; this, combined with escalating US-Iran military risks and increased uncertainty in Russia-Ukraine negotiations, led to a rapid recovery in geopolitical risk premiums; further, technical oversold rebounds, short covering, and a return of liquidity contributed to the multi-factor rally. Market doubts about the substantial progress of negotiations, coupled with the unresolved risk of a US military strike against Iran, have kept the geopolitical risk premium in the oil market persistently high. Meanwhile, peace talks between Russia and Ukraine are progressing in tandem. Representatives from both sides completed the first day of negotiations mediated by the US in Geneva, with Trump urging Ukraine to cease hostilities as soon as possible. The US and Russia are also holding consultations in Riyadh. Although expectations of a ceasefire are rising, there has been no substantial progress on the agreement, and concerns about Ukraine being excluded from the negotiations continue to escalate. Sudden changes in the geopolitical landscape could disrupt oil prices at any time.
Currently, the short-term trend for crude oil is inclined towards "range consolidation with a slight upward bias." Geopolitical risks, as a core variable, further strengthen the upward trend. Technically, the key focus for WTI crude oil is the $66.00 (psychological level) - $66.24 (January 29 high) area, which is both a key breakout level and a core resistance level. If the price successfully holds above this area, the short-term bullish technical structure will be strengthened to $66.00-$66.24. As long as oil prices hold above this area, the short-term structure remains positive, with targets at $67.47 (July 18, 2025 high) and the psychological level of $70.00. If the price breaks below $63.46 (the 20-day simple moving average), it will disrupt the consolidation pattern, and oil prices will face a deeper correction to $61.76 (this week's low), or even a new round of decline to the $60.00 (psychological level).
Today, consider going long on crude oil around $66.33; stop loss: $66.15, target: $67.60; $67.80
Spot Gold
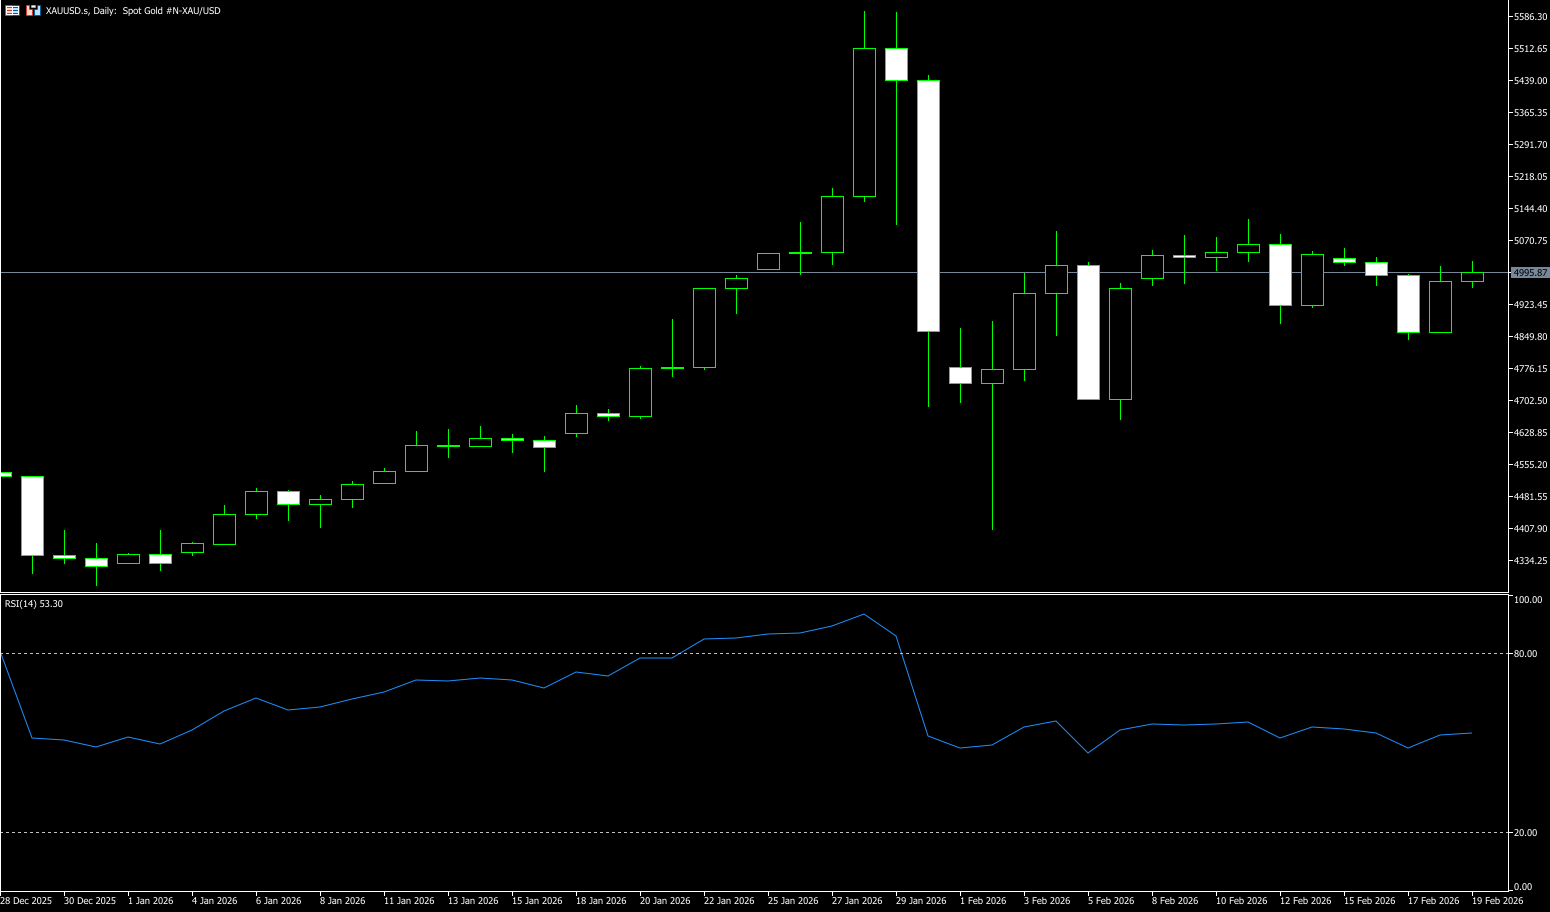
On Thursday, spot gold traded around $4,996 per ounce. Gold prices rose more than 2% on Wednesday as investors continued to assess geopolitical risks from the US-Iran and Russia-Ukraine relations. Meanwhile, the minutes of the Fed's January meeting showed that officials were divided on the future direction of interest rates; the tense standoff between the US and Iran is the core catalyst for gold's safe-haven appeal in the short term, with the parallel diplomatic negotiations and military actions exacerbating market concerns about the regional situation. Furthermore, reports indicate that Trump pledged in December last year to support Israel's strikes against Iran's ballistic missile program should US-Iran negotiations break down. The US military and intelligence community are already discussing specific plans to assist Israeli airstrikes (including aerial refueling and overflight permits), and the potential risk of military conflict continues to support safe-haven buying of gold. Besides the US-Iran situation, another geopolitical focus is also affecting the market: Ukraine and Russia are holding US-mediated peace talks in Geneva from Tuesday to Wednesday.
Considering the two core variables of geopolitics and monetary policy, the current gold market is in a "short-term wait-and-see, medium- to long-term bullish" pattern. In the short term, the market is cautiously observing due to the uncertainty of US-Iran negotiations, with gold prices fluctuating around the $5,000/ounce level, awaiting the direction to be chosen after key events (negotiation results, meeting minutes) are released. From a technical perspective, if gold prices break below the key support level of $4,900.00, it could trigger larger-scale stop-loss orders, accelerating the decline to the 34-day moving average at $4,842.50 and the psychological level of $4,800, providing support. On the upside risk side, if macroeconomic pressures intensify again, real yields turn downwards once more, or new systemic risk events occur globally, gold's safe-haven appeal will be strengthened. Previously accumulated bullish momentum could converge, pushing gold prices towards the psychological level of $5,000.00. A break above this level would test the $5,100.50 level (the high of February 12th).
Today, consider going long on gold around $4,990; Stop-loss: $4,983; Target: $5,050; $5,040
AUD/USD
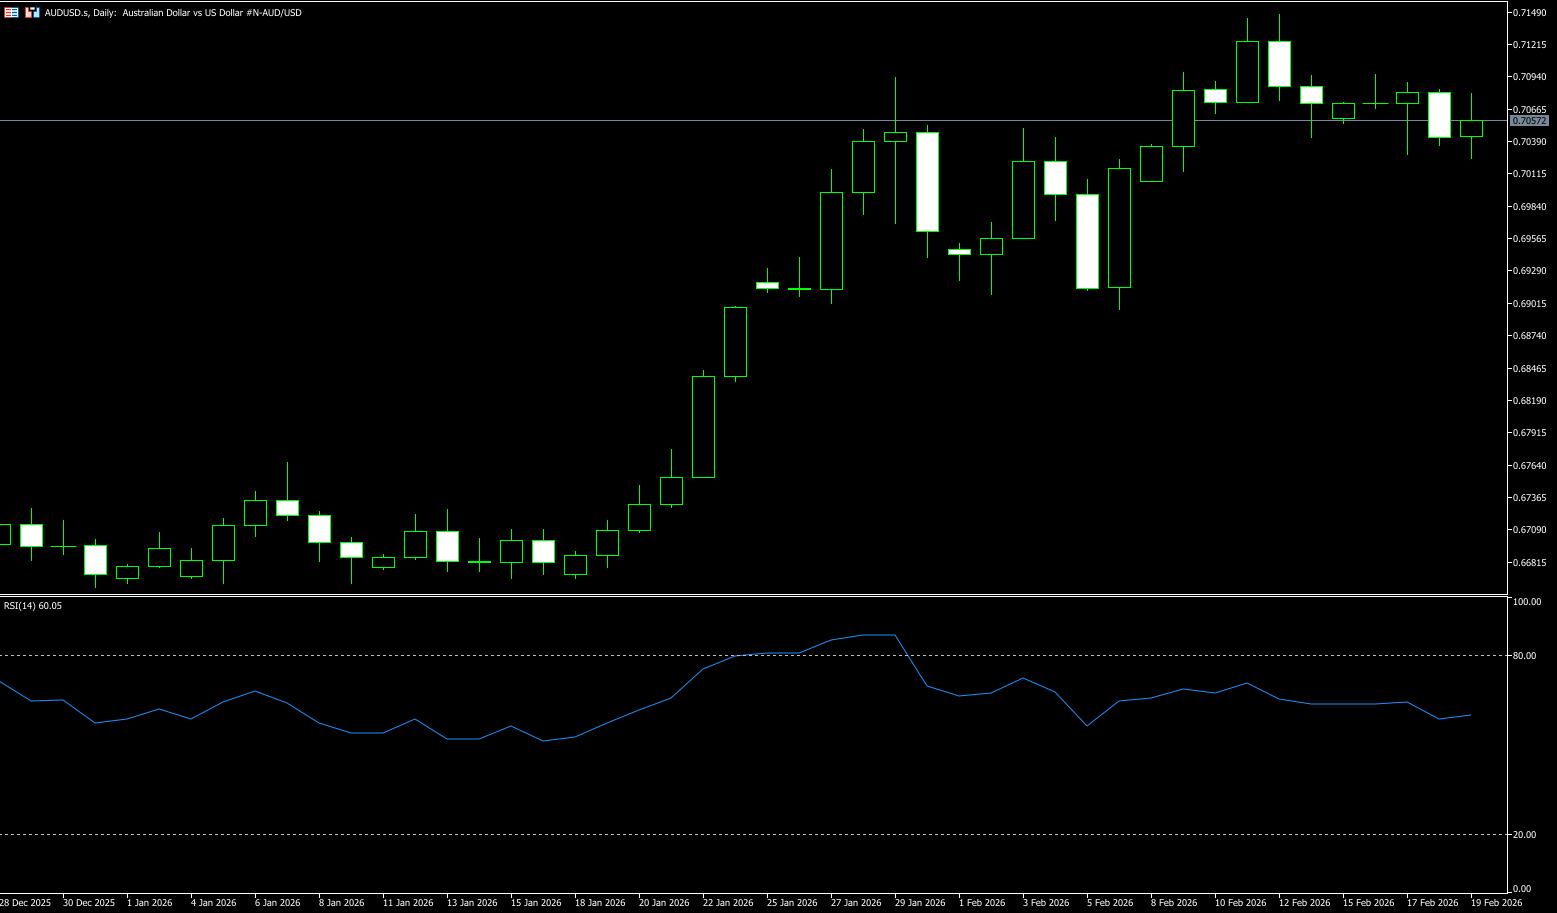
The Australian dollar rose slightly against the US dollar after Thursday's mixed Australian employment data. The Australian dollar traded slightly higher against the US dollar as Australia's seasonally adjusted unemployment rate remained at 4.1% in January, below market expectations of 4.2%. The Australian Bureau of Statistics (ABS) reported an increase of 17,800 jobs in January, lower than the revised 68,500 in December (revised from 65,200) and below the consensus forecast of 20,000. The Australian dollar may find support amid cautious sentiment regarding the Reserve Bank of Australia's (RBA) policy outlook. The latest RBA meeting minutes indicated that the February rate hike was driven by better-than-expected economic data, persistently high inflation, and easing financial conditions. Policymakers agreed that inflation is likely to remain above target for an extended period without further action. However, the Australian dollar was pressured in the previous session as the US dollar strengthened following the release of hawkish Federal Open Market Committee (FOMC) minutes, reigniting expectations of a rate hike if inflation remains high.
A resilient macroeconomic backdrop, a still constrained RBA, improved positioning, and stable support from China give the pair an overall upward bias. As long as global risk appetite remains stable and the US dollar fails to regain strong momentum, pullbacks are more likely to attract buyers than signal a deeper reversal. On the daily chart, AUD/USD is trading at 0.7060. The long and short simple moving averages are in a bullish alignment. This configuration reinforces the bullish trend preference. The 14-day Relative Strength Index (RSI) is at 62, showing solid positive momentum and no overbought conditions. Measured from the low of 0.6421 to the high of 0.7147, the 23.6% Fibonacci retracement is located at 0.6976, and the psychological level of 0.7000 provides support nearby. Immediate resistance is at the psychological level of 0.7100, followed by the 0.7147 level (the high of February 12th).
Consider going long on the Australian dollar around 0.7050 today; Stop loss: 0.7040; Target: 0.7100; 0.7120
GBP/USD
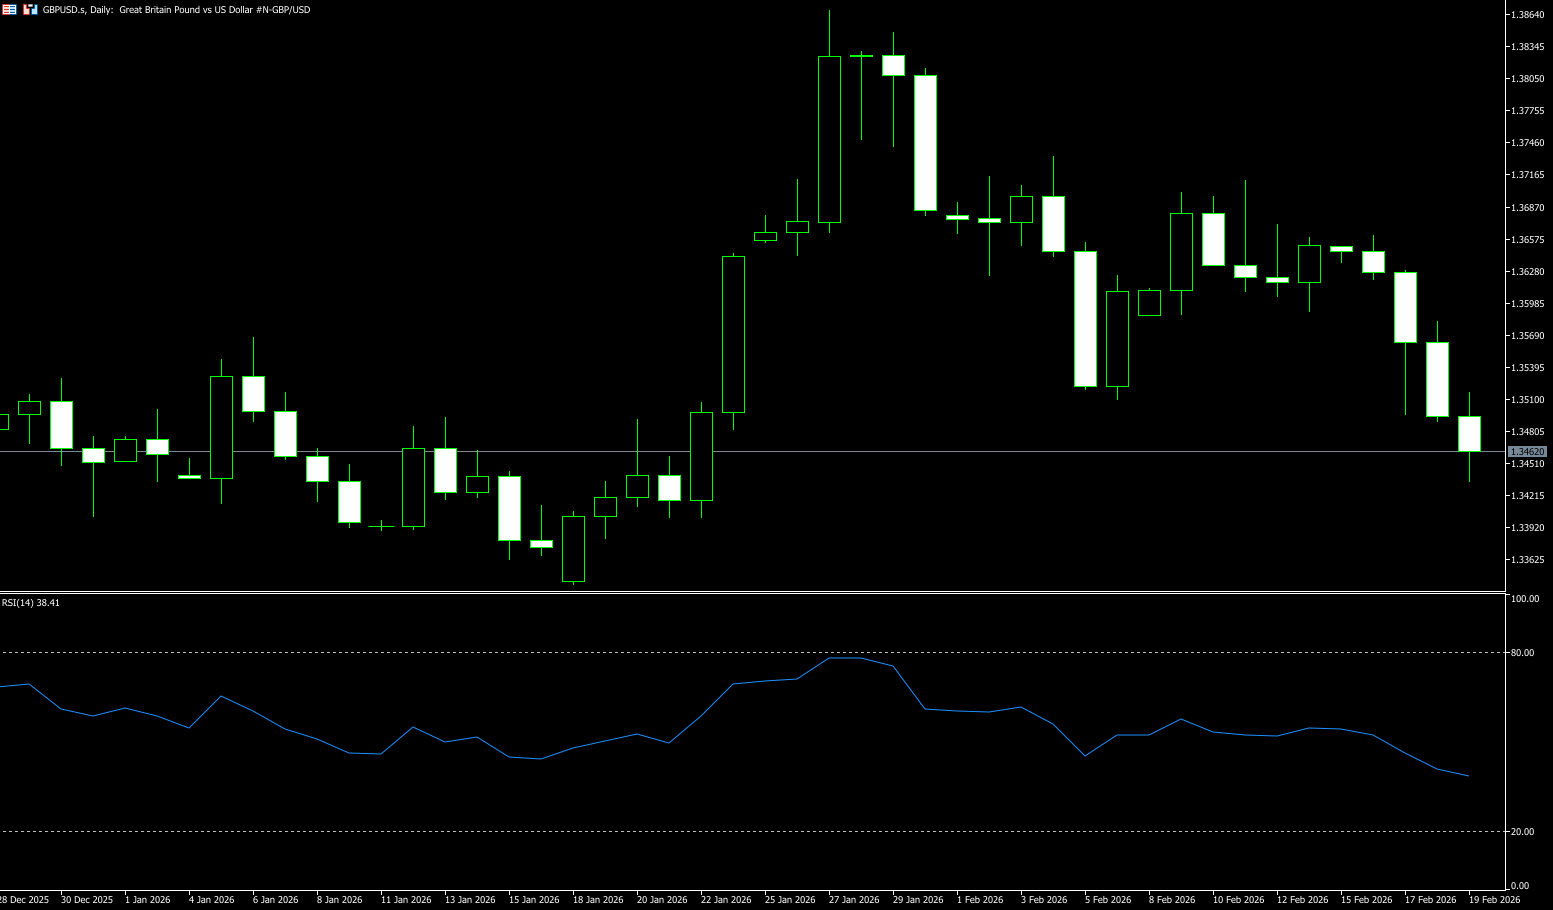
The pound traded cautiously against the dollar just below 1.3500 during Thursday's European trading session, hitting its lowest level in nearly four weeks. GBP/USD faced pressure due to cooling UK inflation and labor market conditions. This week, the Office for National Statistics (ONS) reported that the International Labour Organization (ILO) unemployment rate jumped to 5.2% in the three months to December, the highest level in five years, while the Consumer Price Index (CPI) fell to 3% year-on-year in January, as expected, down from 3.4% in December. Meanwhile, a strong dollar also posed a key drag on GBP/USD. The dollar performed strongly because the minutes of the January Federal Open Market Committee (FOMC) policy meeting showed that several policymakers were in no hurry to cut interest rates unless they saw progress toward a return to the 2% inflation target.
On the daily chart, GBP/USD fell 0.5% midweek, extending its decline from the four-year high reached in January. The price is currently hovering below the 50-day simple moving average (SMA) at 1.3528. The 200-day SMA, located near 1.3444, provides deeper support. The stochastic oscillator is approaching oversold territory, indicating increasing selling momentum, and the pair may find some stability near current levels. The sell-off at recent highs has retraced about half of the rally from the December lows, placing the pair at a critical decision point. A sustained break below 1.3488 (midweek low) would target the 200-day SMA at 1.3444 and the psychological level of 1.3400. A move back above the 50-day SMA at 1.3528 would be needed to challenge 1.3582 (Wednesday high) and 1.3600 (psychological level) to alleviate bearish pressure.
Today, consider going long on GBP/USD around 1.3460; Stop loss: 1.3450; Target: 1.3520; 1.3530
USD/JPY
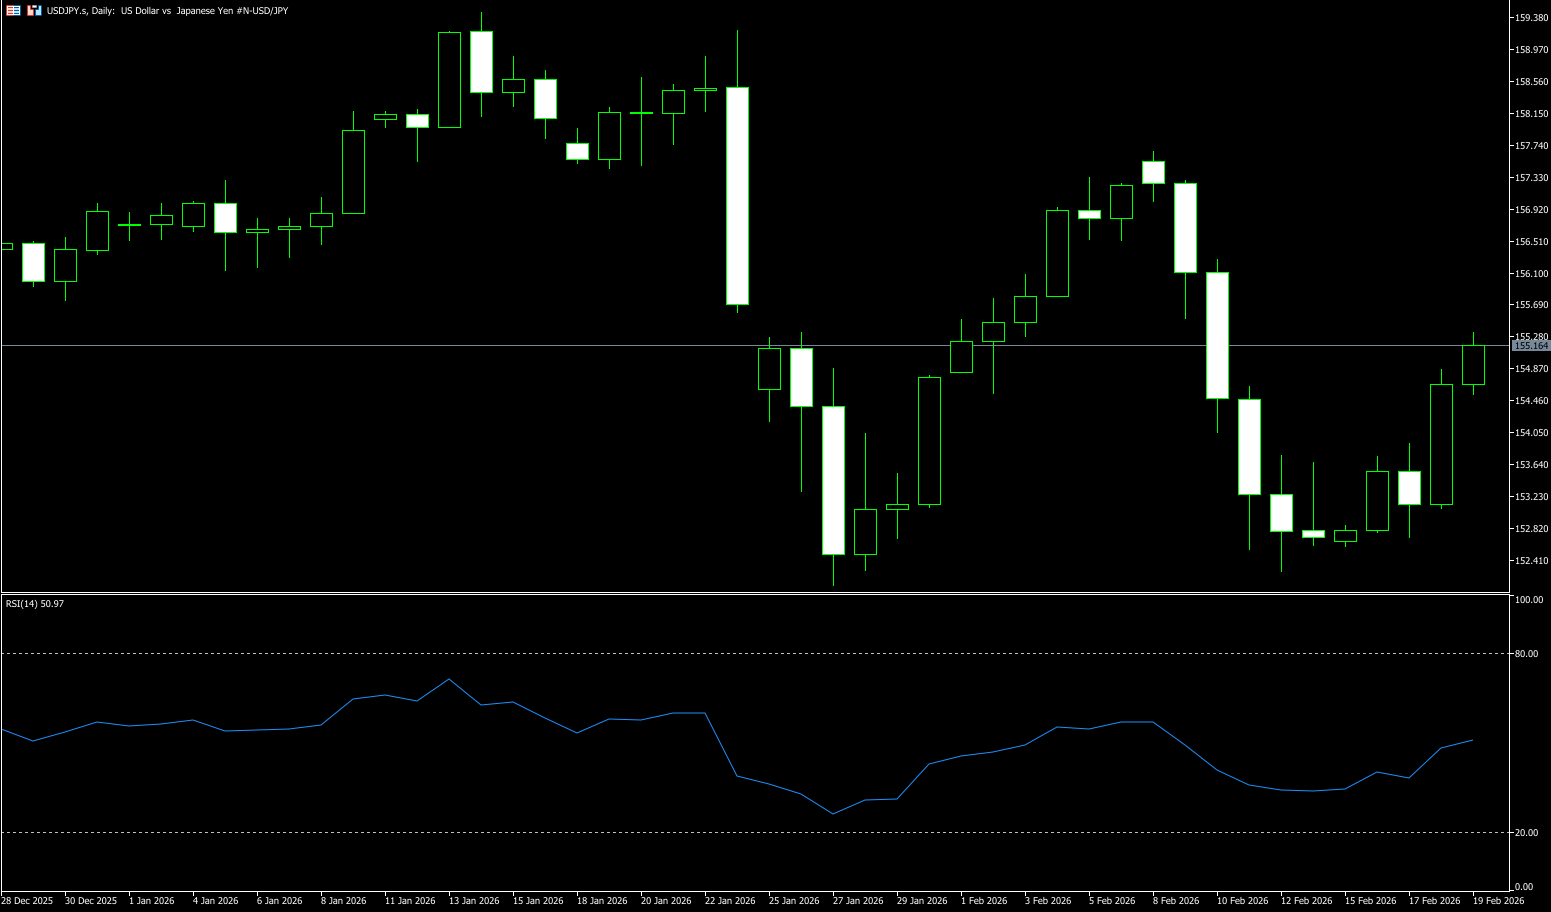
The yen hovered around 154.95 per dollar on Thursday, after falling about 1% in the previous session, marking its biggest one-day drop this month, as the dollar strengthened on strong U.S. economic data and unexpectedly hawkish signals from the Federal Reserve. The minutes of the Fed's latest meeting showed that several participants favored using explicit language indicating they would consider raising the federal funds rate if inflation persists above target. Domestically, data showed that Japanese machinery orders rebounded strongly in December after declining in November, supported by large one-off orders from refineries and nuclear fuel producers. Investors also continue to assess Japan's economic trajectory, expecting Prime Minister Sanae Takaichi to prioritize accelerating budget deliberations. Meanwhile, the market increasingly expects the Bank of Japan to raise interest rates in April, as additional data prior to that could provide policymakers with sufficient justification for tightening policy.
On the daily chart, USD/JPY opened near 153.00 on Wednesday, then rose about 1% to a near one-week high of 154.87. The rebound formed a strong bullish candle, but the price stalled below the 25-day moving average at 155.31, which acted as immediate resistance. The 100-day moving average is around 152.57, and the price is trading between the two moving averages, suggesting the pair is in a transitional phase after approaching the 159.45 high in January. The stochastic oscillator has rebounded from oversold territory, indicating that downward momentum is weakening and a short-term rebound is possible. A break above the 25-day moving average at 155.31 would target the consolidation range of 156.00 (psychological level) and 156.02 (50-day moving average). Failure to break above this level would risk a retest of the 154.00 support level and the 153.76 (120-day moving average) low.
Consider shorting the US dollar around 155.20 today; Stop loss: 155.40; Target: 154.10; 154.20
EUR/USD
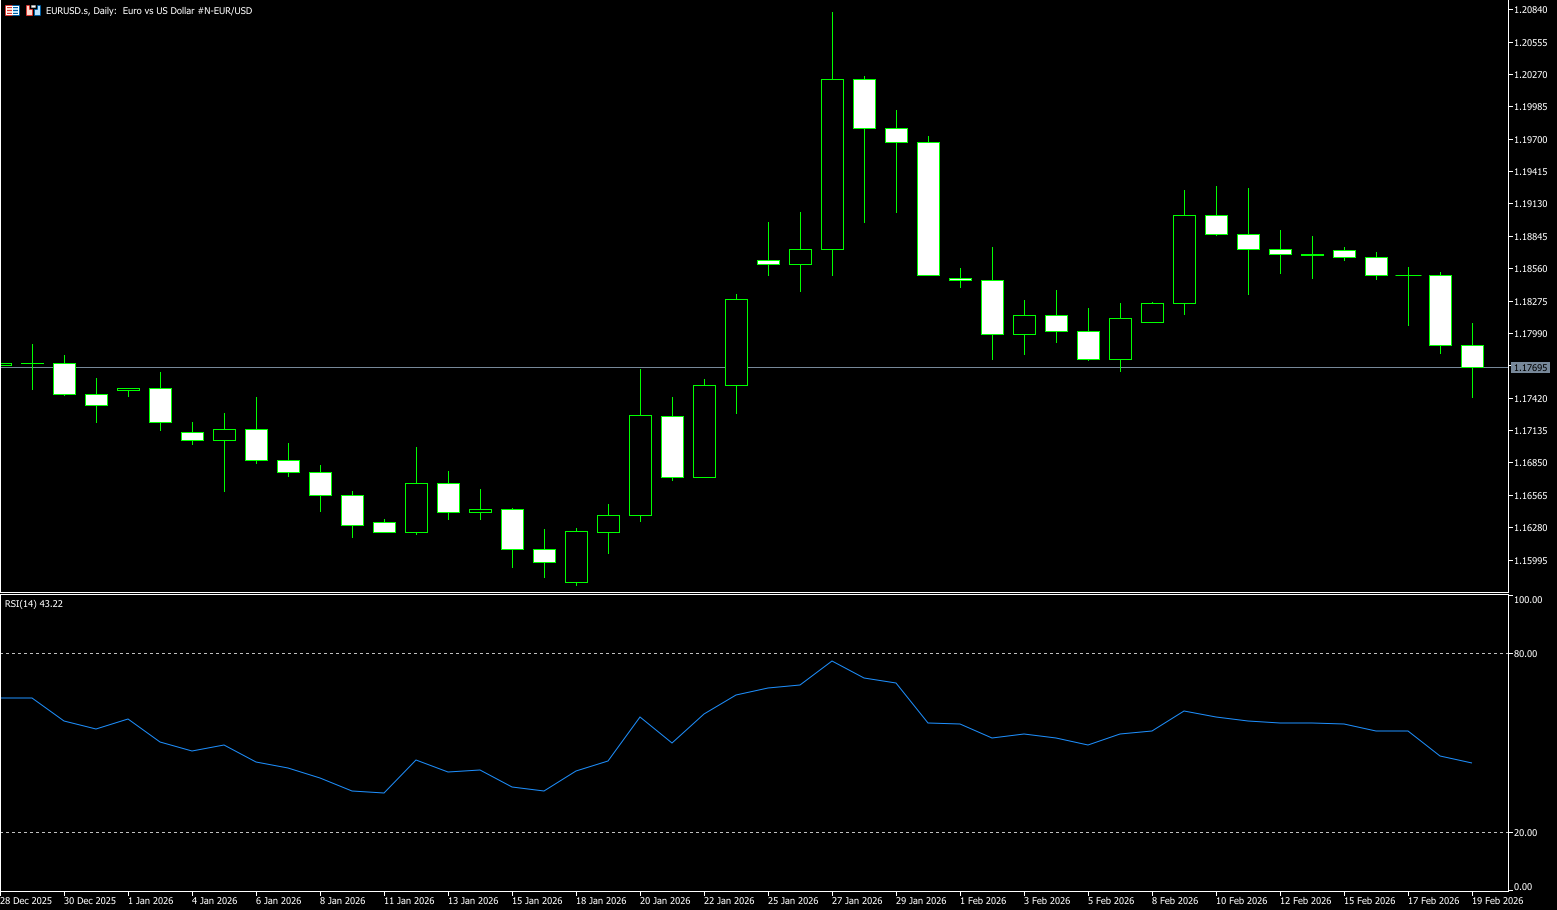
On Thursday, the euro/dollar fell to near a two-week low of 1.1780. The dollar strengthened against the euro after the release of hawkish FOMC meeting minutes, reigniting speculation about a possible interest rate hike if inflation remains high. According to the minutes of the FOMC's January policy meeting, almost all participants supported keeping interest rates unchanged, with only a few favoring a rate cut. Meanwhile, Fed officials indicated they would support describing future decisions in a more two-way manner. Several members suggested that a rate hike might be necessary if price pressures persist. Across the Atlantic, European Central Bank President Christine Lagarde may resign earlier than her planned retirement in October 2027, the Financial Times reported. Traders will be closely watching preliminary Purchasing Managers' Index (PMI) data from Germany and the Eurozone, expected to be released on Friday. Stronger-than-expected results could help limit euro losses in the short term.
The overall structure of EUR/USD exhibits characteristics of "weak consolidation with slowing bearish momentum." The exchange rate remains within a short-term downward channel, but the slope of the decline is slowing, indicating a near balance between bullish and bearish forces. Since the pullback from the previous high of 1.2081, the exchange rate broke below 1.1800 and entered a medium-term consolidation range, currently converging between 1.1780 and 1.1900. The short-term trend has not yet completely reversed the upward pattern since the beginning of the year, and is more likely to be a phase of correction within the upward structure. EUR/USD is generally maintaining a narrow range of 1.1780 (Wednesday's low) to 1.1850. The trend has not completely turned bearish, and is more likely to be a phase of correction within the upward structure. Once it breaks above 1.1850, it will retest the 1.1900 level. As for the downside, if it breaks below 1.1750 (the 60-day simple moving average), it will expose the 1.1700 level and risk a deeper pullback.
Consider going long on the Euro today around 1.1773; Stop loss: 1.1760; Targets: 1.1820, 1.1835
Disclaimer: The information contained herein (1) is proprietary to BCR and/or its content providers; (2) may not be copied or distributed; (3) is not warranted to be accurate, complete or timely; and, (4) does not constitute advice or a recommendation by BCR or its content providers in respect of the investment in financial instruments. Neither BCR or its content providers are responsible for any damages or losses arising from any use of this information. Past performance is no guarantee of future results.
More Coverage


Risk Disclosure:Derivatives are traded over-the-counter on margin, which means they carry a high level of risk and there is a possibility you could lose all of your investment. These products are not suitable for all investors. Please ensure you fully understand the risks and carefully consider your financial situation and trading experience before trading. Seek independent financial advice if necessary before opening an account with BCR.
BCR Co Pty Ltd (Company No. 1975046) is a company incorporated under the laws of the British Virgin Islands, with its registered office at Trident Chambers, Wickham’s Cay 1, Road Town, Tortola, British Virgin Islands, and is licensed and regulated by the British Virgin Islands Financial Services Commission under License No. SIBA/L/19/1122.
Open Bridge Limited (Company No. 16701394) is a company incorporated under the Companies Act 2006 and registered in England and Wales, with its registered address at Kemp House, 160 City Road, London, City Road, London, England, EC1V 2NX. This entity acts solely as a payment processor and does not provide any trading or investment services.

 English
 简体中文
简体中文
 繁體中文
繁體中文
 Bahasa
Melayu
Bahasa
Melayu
 Tiếng
Việt
Tiếng
Việt
 ไทย
ไทย
 日本語
日本語
 한국어
한국어
 ភាសាខ្មែរ
 español