


0
Currency & Commodity Analysis:
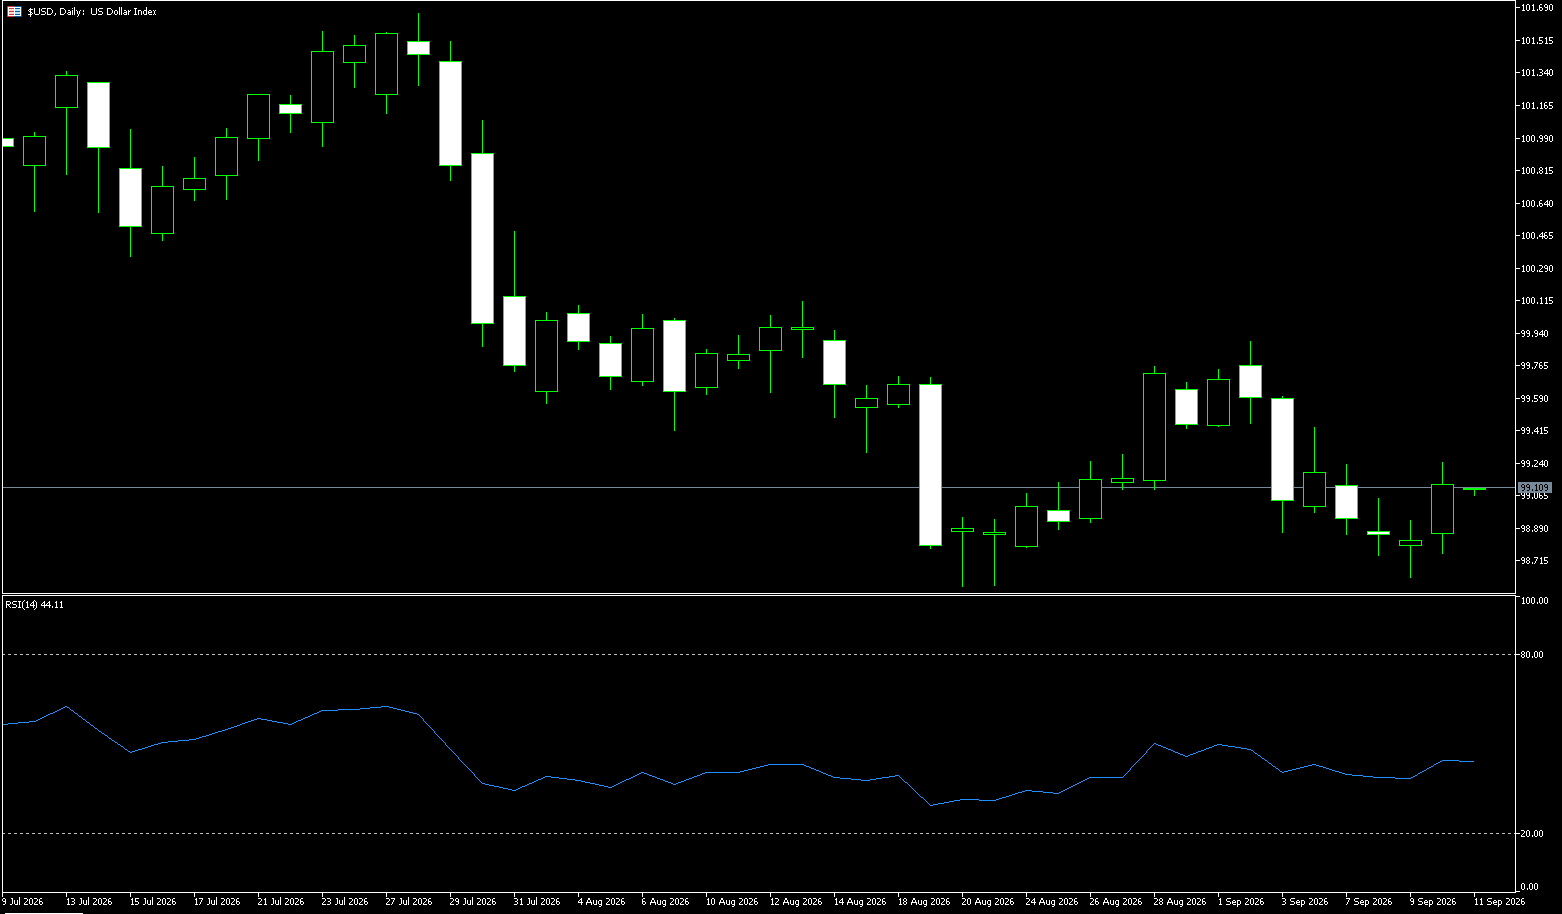
US Dollar Index
The US Dollar Index traded around 101.35 on Wednesday and is on track for a monthly gain of approximately 2%. It has been bolstered by persistent energy-driven inflation, US economic resilience, and hawkish signals from Federal Reserve officials that have heightened expectations for further interest rate hikes. Oil prices remain elevated due to the deadlock in US-Iran negotiations, even though signs of improved energy flows from the Middle East have eased supply concerns. Meanwhile, Fed Governor Michael Barr reiterated his view that further rate hikes might be necessary to curb inflation, while New York Fed President John Williams suggested that another hike could be appropriate "later this year." Markets currently anticipate nearly a full percentage point of rate hikes from the Fed over the next 12 months. Investors are now awaiting Wednesday's Personal Consumption Expenditures (PCE) price index report—the Fed's preferred inflation gauge—followed by Friday's closely watched monthly employment report for further guidance.
On the daily chart, the US Dollar Index spot maintains a bullish short-term tone, with the price holding above the 9-day simple moving average (SMA) at 100.93 and the 101.00 psychological level. The index is approaching the upper end of its recent range; the 14-day Relative Strength Index (RSI) stands at 68—nearing overbought territory—indicating strong but increasingly stretched upward momentum. To the upside, immediate resistance lies near 101.61 (Tuesday's high), where bullish attempts may face profit-taking; a breakout here would target the 102.00 level. To the downside, initial support is found at the 9-day SMA (100.93) and the 101.00 mark, followed by the 14-day SMA at 100.51; should a deeper pullback occur, the area near the 100 psychological level would serve as a more distant zone of demand.
Consider shorting the US Dollar Index at 101.55 today; stop-loss: 101.65; targets: 101.10, 101.20.
WTI Spot Crude Oil
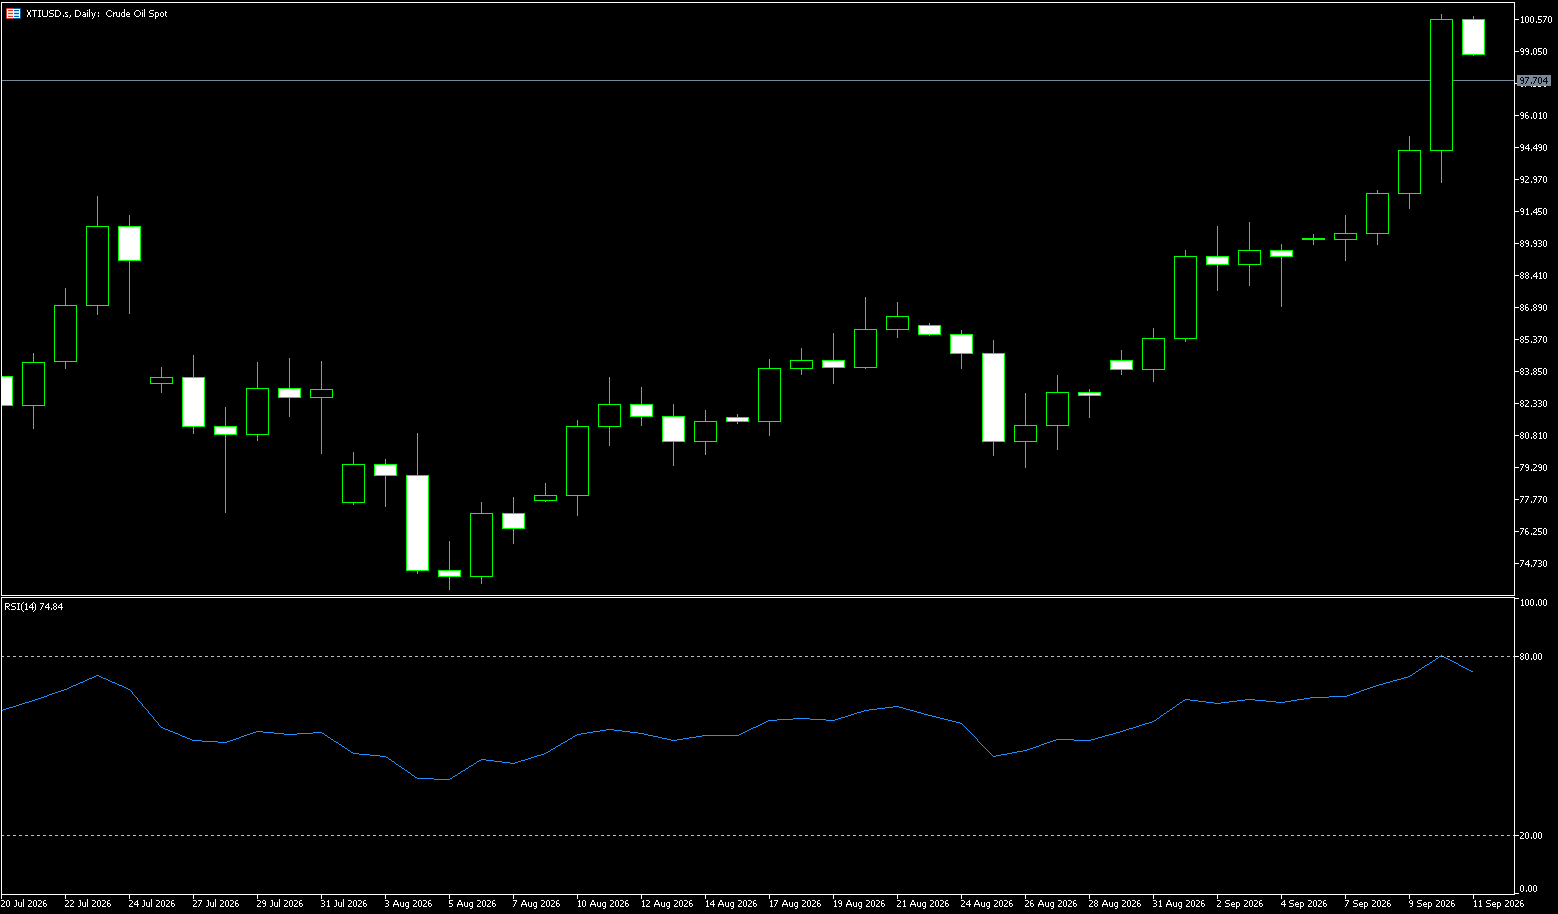
WTI crude oil prices rebounded to around $89 per barrel on Wednesday, recovering some of the previous session's losses, as signs of improved energy flows from the Middle East and another massive US emergency reserve release helped ease supply concerns. Analysts noted that the 10-day average for Middle East crude exports has recovered to 17.5 million barrels per day, equivalent to 98% of pre-conflict levels. Meanwhile, Saudi Arabia has restored about half of its crude exports via the East-West Pipeline, and covert shipments through the Strait of Hormuz continue. The US government plans to release up to 40 million barrels from the Strategic Petroleum Reserve to combat soaring fuel prices. Industry data showed a 1-million-barrel increase in US crude inventories last week. Nevertheless, the US oil benchmark remains on track for monthly and quarterly gains due to ongoing conflict between the US and Iran and persistent supply disruptions.
From a daily chart perspective, WTI remains in a relatively bullish structure; prices are holding above the 50-day moving average ($86.60) and the lower Bollinger Band ($85.87), indicating that the medium-term upward trend remains intact. The price is currently hovering near $89, gradually testing resistance at the psychological $100 mark. The 14-day RSI stands at approximately 47—a neutral-to-bullish zone—with no clear overbought signals yet; this indicates that bulls retain some momentum, though the upward drive is not extreme. The $90.00 level is a key breakout point to watch on the daily chart. If WTI can decisively hold above this level, it could open the way for a move toward the $91.89 area (10-day moving average); conversely, repeated failures to breach the $93.44 level (20-day moving average) could see oil prices return to a range-bound pattern at high levels.
Consider going long on crude oil at $89.30 today; stop-loss: $89.20; targets: $91.00, $92.00.
Spot Gold
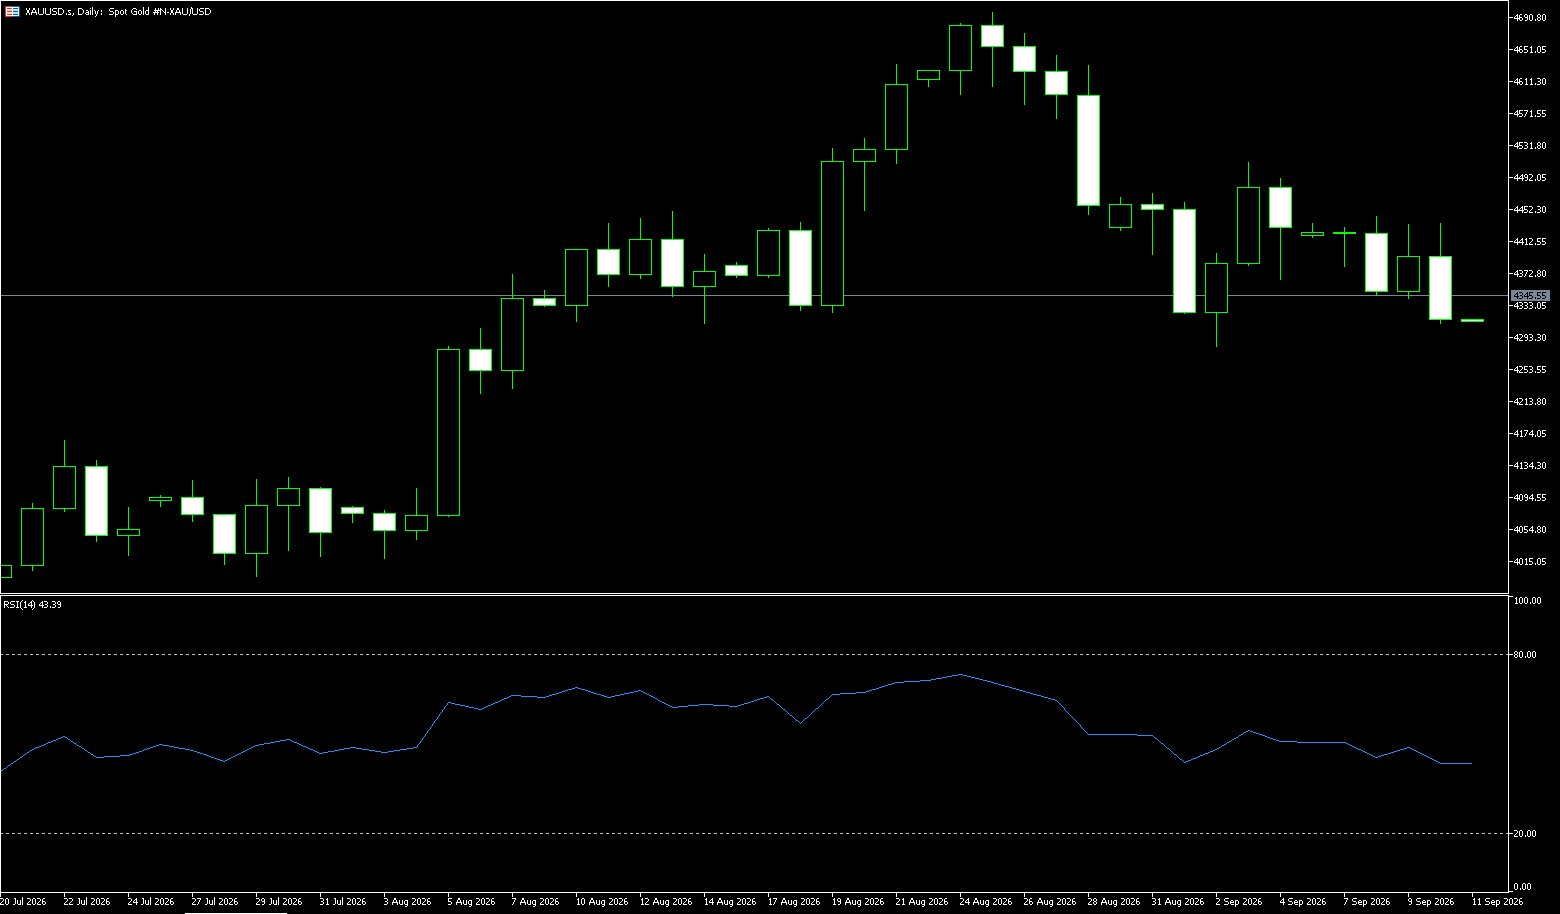
On Wednesday, the price of gold rose to around $4,200 per ounce, extending gains from the previous session. While it faced persistent pressure from high Treasury yields, it found some support from falling oil prices. Oil prices dropped sharply due to signs of improved energy flows in the Middle East and another massive release of US emergency reserves. Meanwhile, precious metals were pressured by rising Treasury yields, with the 30-year US Treasury yield climbing to 5.62%—its highest level since June 2002. Concerns over persistent energy-driven inflation and hawkish comments from Federal Reserve officials drove the rise in yields. New York Fed President John Williams stated on Tuesday that another rate hike might be appropriate later this year, noting that the conflict in the Middle East and the expansion of artificial intelligence remain key factors driving high inflation. Gold is on track to fall nearly 6% in September.
Gold prices found some support ahead of the $4,100 mark, a level representing the 78.6% Fibonacci retracement of the rally seen between June and August. Meanwhile, the MACD indicator remains negative, suggesting persistent downward pressure, while the RSI near 41 indicates weak momentum rather than oversold conditions. Consequently, the 61.8% retracement level at $4,227 acts as an initial resistance, sitting below the 25-day moving average of $4,343 and the intermediate Fibonacci retracement level near $4,317. As long as the gold price remains below the 25-day moving average of $4,343, any rebound is likely to be limited. Further up, the 38.2% Fibonacci retracement level at $4,406 and the 23.6% level at $4,517 reinforce the broader resistance ceiling. On the downside, the lower Bollinger Band at $4,148 provides immediate support, followed by the 78.6% Fibonacci retracement level near $4,100; a decisive break below this level would open the way for a further pullback toward the $3,937 area.
Consider going long on gold at $4,152 today; stop-loss at $4,148; targets: $4,190, $4,200.
AUD/USD
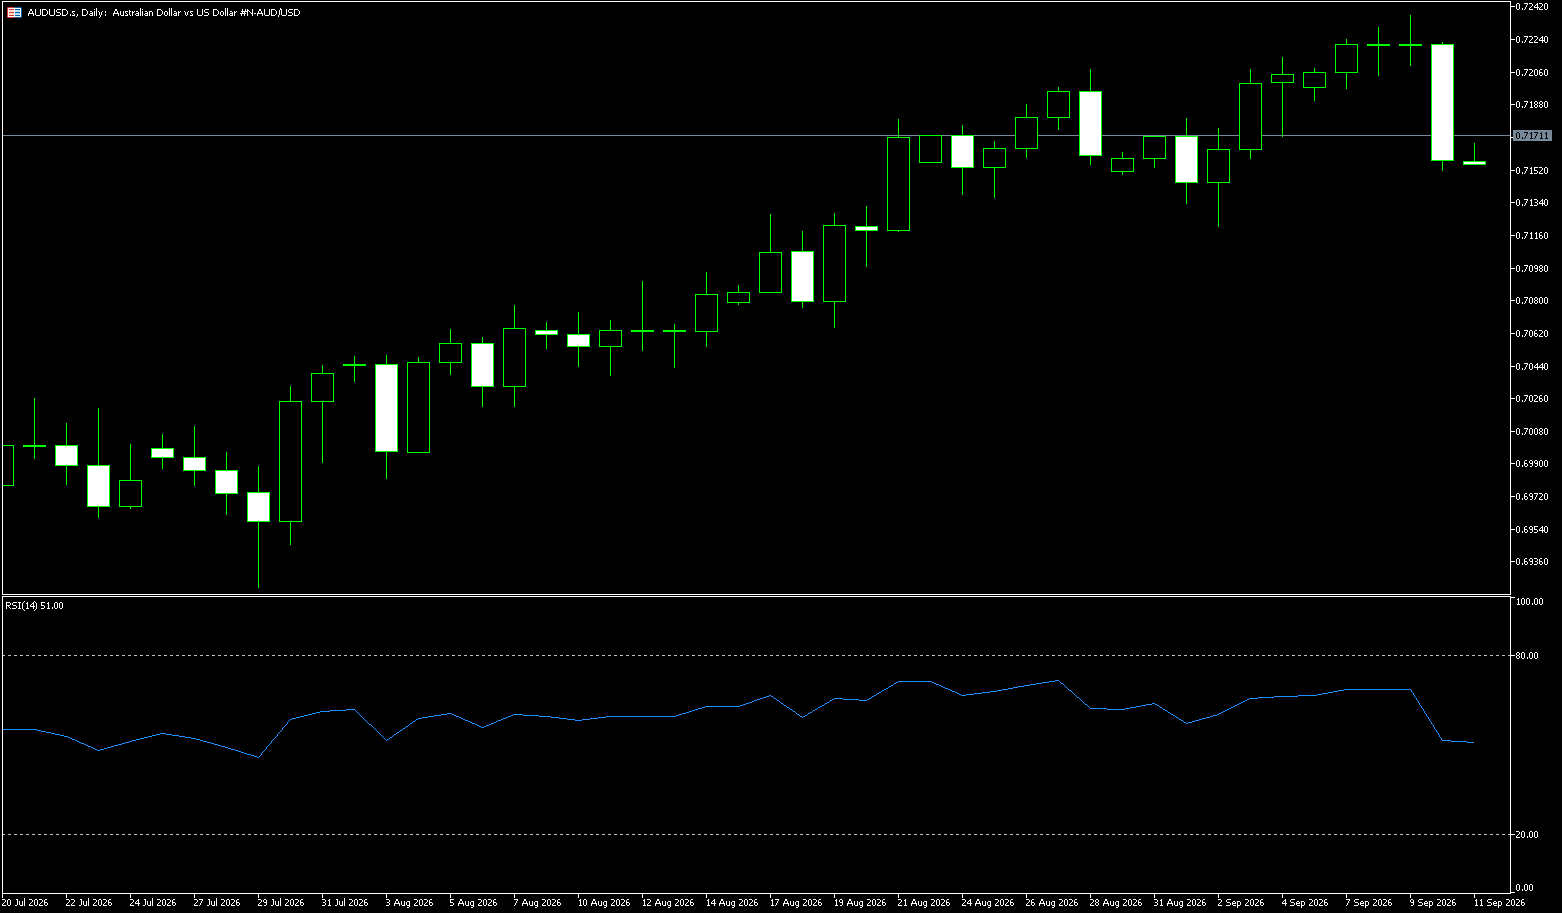
During the early European session on Wednesday, the AUD/USD pair extended its rebound, climbing back toward 0.6975—a recovery from the day's low of 0.6960. However, the pair remains down 0.18% from Tuesday's closing price of 0.6985. The Australian dollar found support following the release of Australia's August Consumer Price Index (CPI) data, which indicated an acceleration in price pressures. On a year-over-year basis, the CPI rose by 4%, matching expectations and exceeding July's 3.5%. Month-over-month, the inflation rate slowed to 0.4%—in line with forecasts—down from the previous month's 1%. Signs of accelerating inflationary pressure in Australia have boosted market expectations for further interest rate hikes by the Reserve Bank of Australia (RBA) this year. On Tuesday, RBA Governor Michele Bullock stated that the door remains open for additional rate hikes this year. To date, the RBA has raised the Official Cash Rate (OCR) four times to 4.6%.
On the daily chart, AUD/USD is trading at 0.6950, extending its decline; it has fallen below the 9-day simple moving average (SMA) at 0.7046, clearly shifting the short-term bias to bearish. After failing to hold gains near the upper retracement zone, the pair has retreated below the 61.8% Fibonacci retracement level at 0.7008. Meanwhile, the Relative Strength Index (RSI-14) sits near 29.65, indicating oversold conditions that might slow the downward momentum but are insufficient to offset the persistent pressure from the moving average and Fibonacci resistance levels above. On the upside, initial resistance lies at the 61.8% retracement level of 0.7008, followed by the 9-day simple moving average (SMA) at 0.7046 and the 20-day SMA at 0.7078. On the downside, initial support is found near the 0.6900 round-figure mark, followed by the recent swing low area defined by the 100% retracement level at 0.6866; if oversold signals persist, sellers may begin to take profits.
Consider going long on the AUD at 0.6940 today; Stop-loss: 0.6930; Targets: 0.6985, 0.7000.
GBP/USD
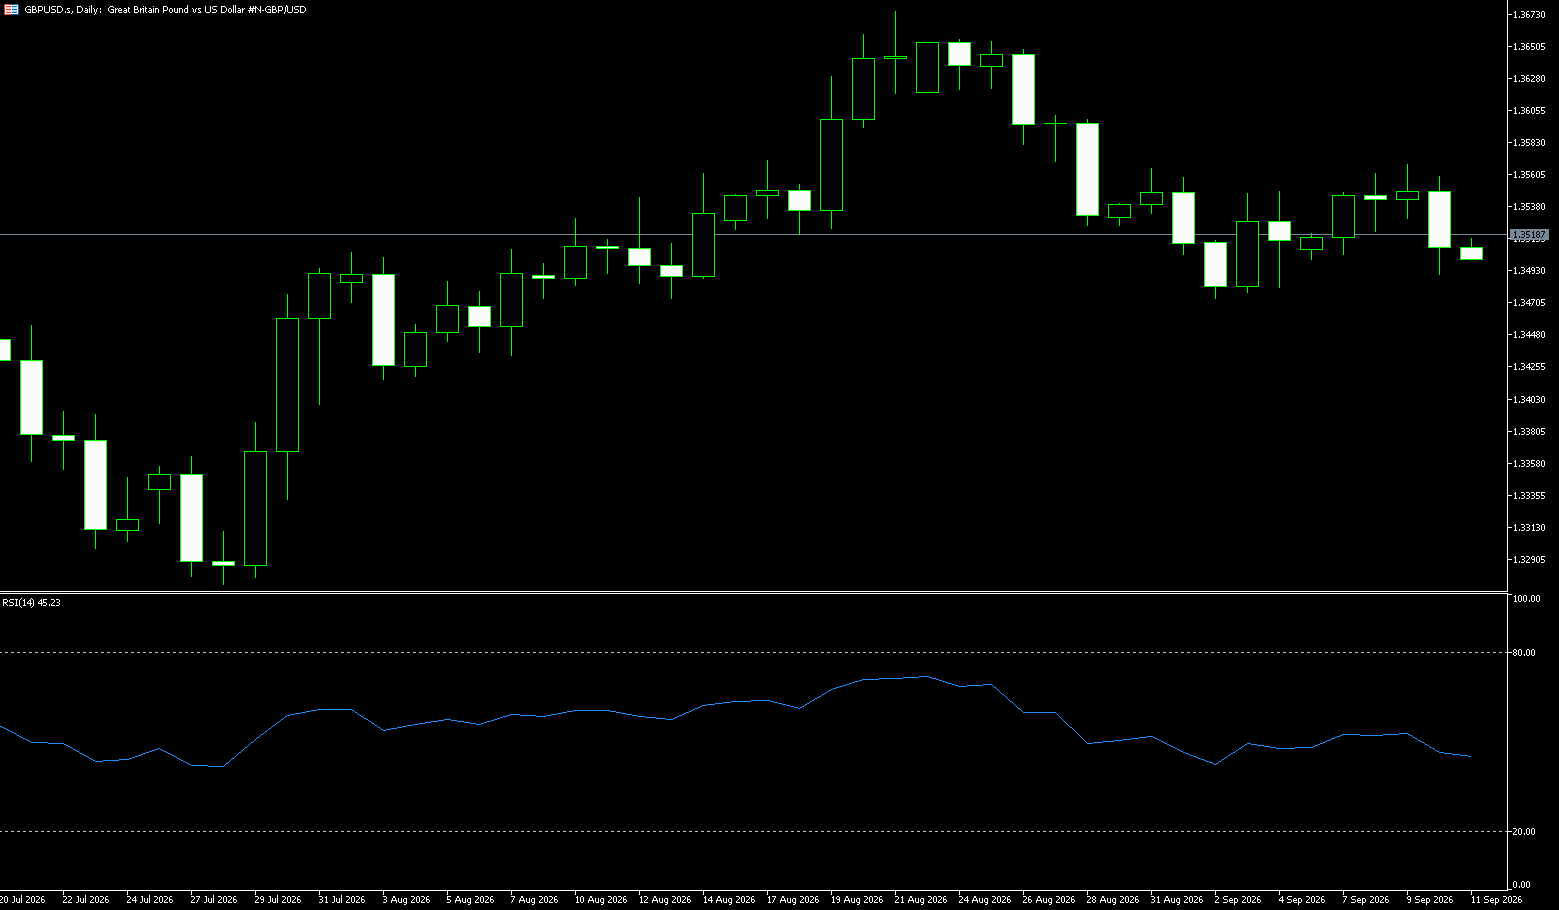
The GBP/USD pair attracted some buying interest during the early European session on Wednesday, rebounding from the two-month low near 1.3200 touched the previous day. The spot price climbed to the 1.3260 area following the release of final UK GDP data, though upside potential appears limited as traders may opt to wait and see ahead of key US macro data releases. The UK Office for National Statistics (ONS) reported that the UK economy grew by 0.5% in the second quarter, an upward revision from the initial estimate of 0.4%. This data reinforced market bets that the Bank of England will raise interest rates by 25 basis points at its upcoming meeting on November 5, providing a modest boost to the pound. Meanwhile, a pullback in US bond yields weighed on the US dollar and offered additional support to the GBP/USD pair. Furthermore, the Conference Board's US Consumer Confidence Index fell to its lowest level since May 2014, prompting further profit-taking on the dollar. However, hawkish expectations regarding the Federal Reserve may limit any further decline in the dollar.
The GBP/USD pair maintains a short-term bearish tone below the 20-day simple moving average (SMA) at 1.3298, suggesting that any subsequent upside is likely to face strong resistance ahead of the 1.3300 mark. However, a sustained break above this level could trigger a short-covering rally and pave the way for further gains toward 1.3341 (the 14-day SMA). On the downside, a drop below the 1.3200 level would open the door for a retreat to retest the year-to-date lows (near the 1.3140 area touched in June). Next is the 1.3100 psychological level; if this gives way, it would pave the way for a continuation of the recent downtrend observed over the past month or so.
Consider going long on GBP at 1.3260 today; Stop-loss: 1.3250; Targets: 1.3300, 1.3320.
USD/JPY
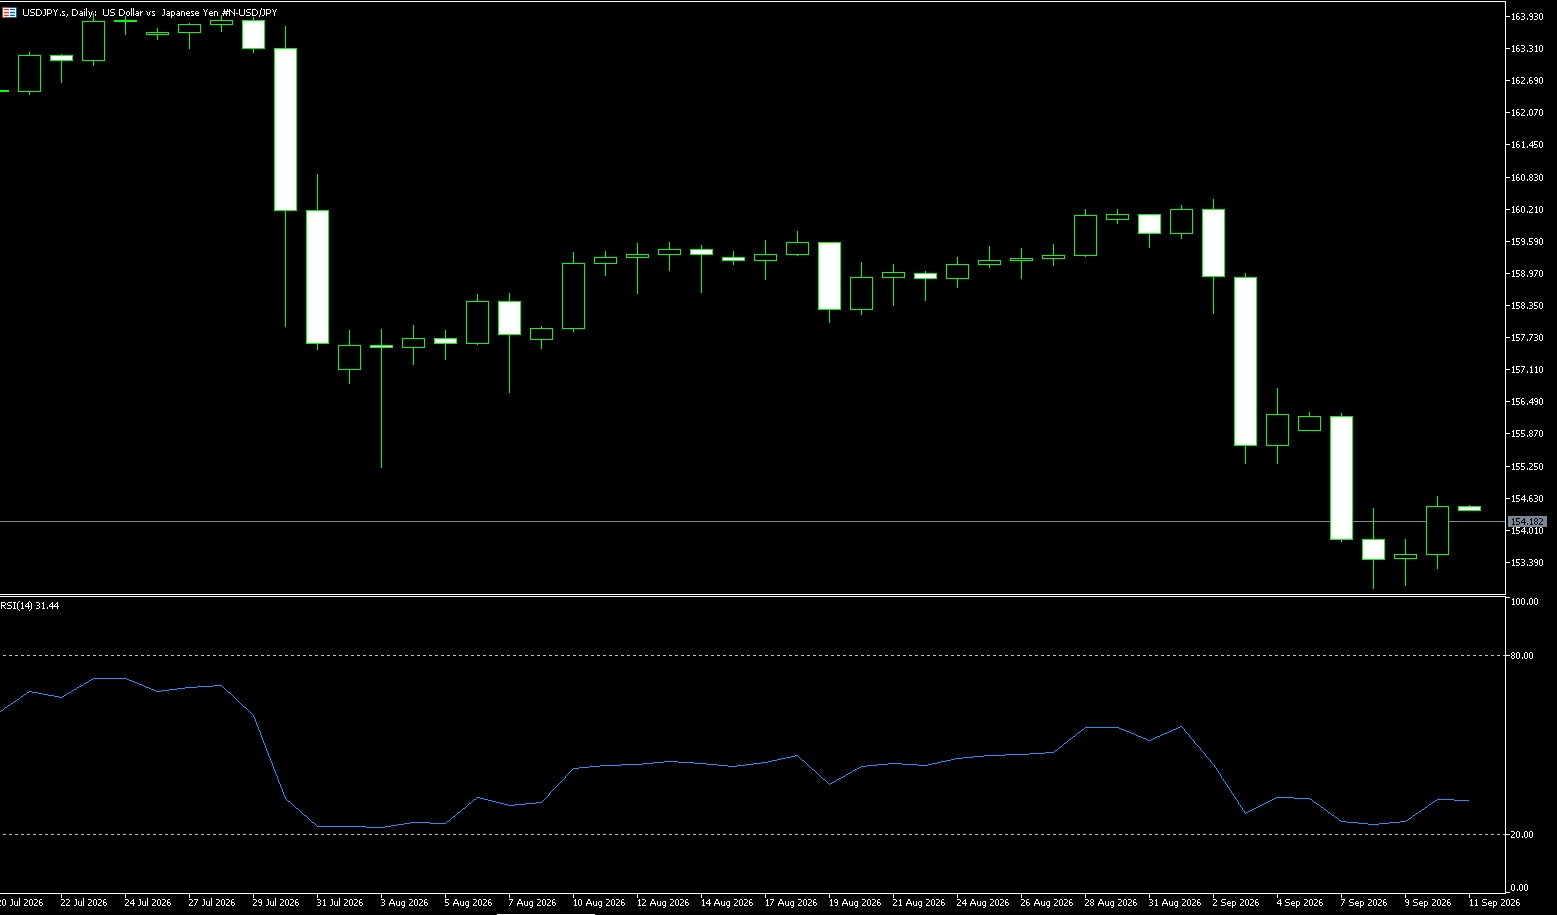
The yen appreciated to around 157 per dollar on Wednesday and is poised to end the month higher as traders react to a series of verbal warnings from officials signaling Tokyo's determination to support the currency. Finance Minister Satsuki Katayama stated that Japan and the U.S. would maintain close communication to safeguard currency market stability amidst growing concerns over the yen's weakness. She also noted that President Trump expressed concern regarding the yen during his meeting with Prime Minister Sanae Takaichi. Japan's top currency official, Atsushi Mimura, also stated this week that the Prime Minister and Finance Minister, alongside the U.S., had conveyed a "very clear" message regarding excessive currency depreciation. Nevertheless, the yen remains under pressure from the U.S.-Japan interest rate differential, as the Federal Reserve's tightening outlook continues to outweigh the Bank of Japan's rate hikes.
The USD/JPY pair maintains a bearish tone in the near term, remaining below both the 34-day (157.40) and 50-day (158.27) simple moving averages (SMAs). Trading below these short- and medium-term SMAs suggests that upside attempts remain limited, even though the 14-day Relative Strength Index (RSI) sits near 48—a neutral zone indicating consolidation rather than a clear trend reversal. USD/JPY may test the 34-day exponential moving average (EMA) at 157.40 as immediate resistance, followed by the 50-day EMA at 158.27. Further resistance lies at 158.80, near the upper boundary of the symmetrical triangle. A successful breakout from the triangle would trigger a bullish recovery, potentially pushing the pair toward the 40-year high of 163.99 reached on July 23. On the downside, USD/JPY could target 156.07 (20-day SMA) and 155.60, near the lower boundary of the symmetrical triangle.
Consider shorting the USD at 157.50 today; stop-loss: 157.65; targets: 156.70, 156.80.
EUR/USD
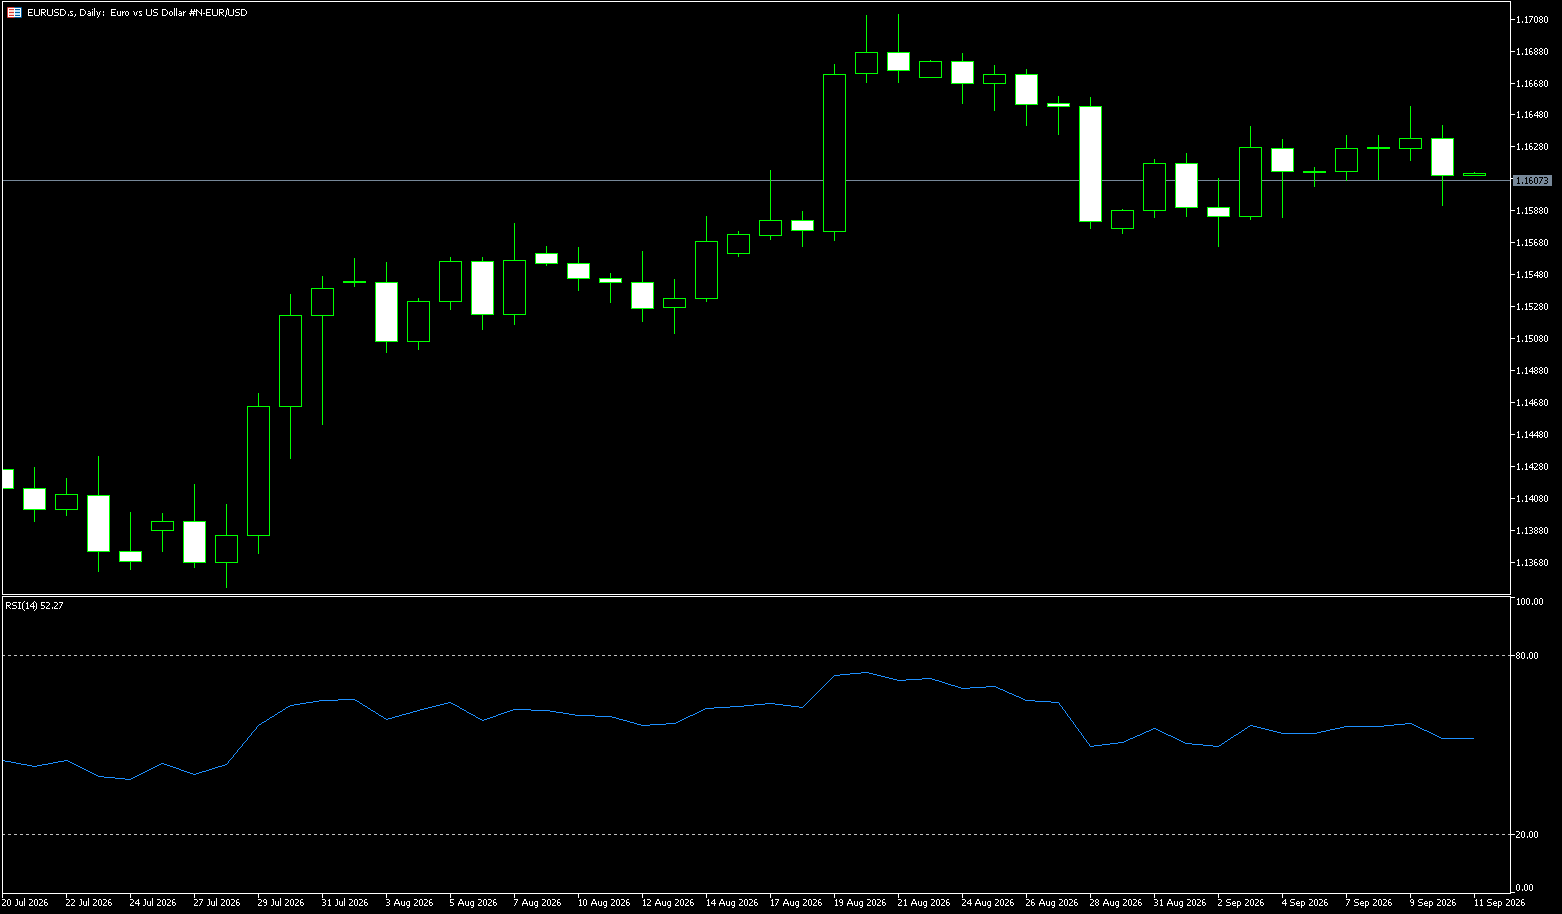
The Euro approached $1.135 in late September—near its lowest level since May 2025—marking a drop of over 2% against the dollar and the sharpest monthly decline in 14 months. This also represents a third consecutive quarterly decline, as markets anticipate the European Central Bank (ECB) will tighten policy more slowly than the Federal Reserve. While the ECB is expected to raise rates further over the coming year—potentially announcing the next hike in December alongside updated economic forecasts—there is a nearly 45% probability of another Fed rate hike in October. Meanwhile, inflation in Europe's largest economies accelerated in September, driven primarily by rising fuel prices; however, ECB President Christine Lagarde noted that this recent surge has not yet triggered significant second-round effects, suggesting a cautious policy response. Weak growth in the Eurozone—projected at just 0.9% this year—may also limit aggressive tightening, while political uncertainty ahead of elections in France, Spain, and Italy next year continues to weigh on the currency.
On the daily chart, EUR/USD maintains a bearish short-term bias, with the spot price remaining below the 9-day simple moving average (1.1398) and the 1.1400 psychological level. Prices are being pushed toward the lower bound of the recent range; the lower Bollinger Band at 1.1291 provides immediate technical support, with the 1.1250 level serving as the next target. Meanwhile, the 14-day Relative Strength Index (RSI) stands at 23.7—deep in oversold territory—suggesting that downward momentum is overextended but has not yet reversed. On the upside, initial resistance lies at the 9-day simple moving average (SMA) of 1.1398 and the 1.1400 psychological level, followed by the 55-day SMA near 1.1521; any corrective rebound would further reinforce the broader supply zone. On the downside, immediate support aligns with the 1.1300 psychological level and the lower Bollinger Band at 1.1291; a decisive break below this level would open the way for further declines, whereas holding above it would see the pair remain constrained by heavy overhead resistance.
Consider going long on the Euro at 1.1325 today; Stop Loss: 1.1315; Targets: 1.1380, 1.1370.
Stock Analysis:
ASX 200 Index (Australia)
Market Overview:
The ASX 200 index rose 80 points (0.9%) to close at 8,789 on Wednesday—the final trading day of September—marking its third consecutive day of gains. Market sentiment was boosted by strong US futures as investors focused on the Personal Consumption Expenditures (PCE) price index (the Federal Reserve's preferred inflation gauge) and Friday's employment report. Reserve Bank of Australia Governor Michele Bullock reportedly hinted that the September rate hike might be the last, a signal traders interpreted as dovish. Meanwhile, the annual inflation rate for August fell to 4%—slightly below the expected 4.1%—while the trimmed-mean CPI remained at 3.6%. All sectors posted gains, led by technology, transport, logistics, and consumer durables. Notable individual stock performers included Goodman Group (+4.0%), Wesfarmers (+3.6%), Brambles (+2.4%), and Northern Star Resources (+6.5%).
The "Big Four" banks showed lackluster performance. For the month, the local market fell 3.2%, snapping a five-month winning streak; the decline was driven by pressures from housing and fuel costs, stubborn inflation, and higher borrowing rates. Nevertheless, the index managed to post a gain for the second consecutive quarter, rising 0.12%.
Sector Performance:
Top Gainers: Real Estate (REITs), Technology, and Consumer Discretionary (interest-rate-sensitive sectors that benefit directly from cooling CPI); Banking sector also posted gains.
Top Losers: Materials/Mining; iron ore prices weighed on resource stocks, dragging down the index's heavyweights. Technical Analysis:
ASX 200 Wednesday Close: 8,789 points (up 80 points, +0.9%). This marked the third consecutive day of gains, driven by Australia's lower-than-expected August CPI and rising expectations for interest rate cuts; interest-rate-sensitive sectors saw the strongest rebounds. Candlestick structure: A solid bullish candle formed on Wednesday, showing intraday upward volatility and holding near highs at the close with no long upper shadow, indicating bulls held the intraday initiative. The index reclaimed the 20-day and 50-day moving averages, confirming effective support, while the 200-day moving average—serving as the medium-term trend floor—remained upward-sloping. RSI (14) rose toward 60; while not yet in overbought territory, bullish momentum has been unleashed but room for further upside remains. MACD: The DIF line crossed above the DEA line, and the bullish histogram expanded, confirming a short-term bullish structure. Intraday support: 8,720; Intraday resistance: 8,795. With the close near resistance, there is a potential need for a minor pullback.
Thursday Technical Outlook (Scenario Analysis): Base Case (High Probability): Minor pullback followed by continued volatility with a bullish bias. The market opens slightly lower, pulling back to around 8,740, then stabilizes and moves up to test 8,840. Rationale: Short-term profit-taking follows three days of gains, but the positive CPI impact hasn't been fully priced in; stable US stock futures would support the ASX. Bullish Scenario: Immediate breakout. Strong opening momentum establishes the price firmly above 8,840, targeting 8,900. Triggers: Significant overnight US stock gains; rebound in iron ore/commodities. Bearish Scenario: Rally fails, turning weak. Attempt to break 8,840 fails; a "shooting star" candle forms, the price drops below 8,740, targeting 8,680. Triggers: US stock futures plunge; sharp drop in commodities; renewed market concerns over persistent inflation. If the price rises above 8840, the RSI will climb above 65, approaching overbought territory; if it falls below 8740, short-term bullish momentum will wane, and the MACD histogram will contract.
Trading Strategy (Short-term Perspective)
Bullish Strategy (Priority/Base Case)
Buy on Pullback: Enter if the price stabilizes in the 8740–8750 range (look for a 15-minute candle indicating a halt in the decline); place stop-loss below 8710; first take-profit at 8830, second at 8890 (risk-reward ratio > 1.5). Chase Breakout: Enter after the price firmly holds above 8840 on high volume; stop-loss at 8800, targets at 8890–8900; shorting at the 8840 resistance level by guessing the top is not recommended.
Bearish Strategy (Bearish Scenario Only; Light Position)
Conditions: Price rallies to the 8830–8840 range, showing clear signs of stalling (e.g., a long upper shadow) alongside weakness in US stock futures; enter short, stop-loss at 8870, first target 8750, second target 8690; keep positions strictly light, as counter-trend shorting carries higher risk.
Key Risk Warnings:
1. External Risks (Major Variables): US PCE inflation data and overnight volatility in US stock futures; fluctuations in the USD/AUD exchange rate—a strengthening Australian dollar tends to weigh on the resources sector. Volatility in iron ore and international gold prices impacts heavyweight mining stocks such as BHP and Rio Tinto.
2. Local Fundamental Risks: Fluctuating inflation expectations; RBA official commentary—hawkish remarks would directly hit the real estate, banking, and REIT sectors, rapidly suppressing the index. 3. Technical Risks: The index has recorded three consecutive days of gains, leading to an accumulation of short-term profits; a rapid pullback is likely once positive news is priced in. The RSI is approaching the overbought zone, suggesting a technical correction could occur at any time following the recent rally.
Hong Kong Hang Seng Index
Market Overview:
The Hang Seng Index rose 0.4% (106 points) to 24,628 on Wednesday, reversing earlier losses as stronger Chinese economic data and renewed buying interest boosted market sentiment. China's manufacturing PMI rebounded to 50.1 in September from 49.8 in August, returning to expansion territory, while the non-manufacturing PMI rose from 49.0 to 50.2. Additionally, the private-sector manufacturing PMI climbed to a five-month high of 52.1, fueling expectations for further policy support. Meanwhile, comments from New York Fed President John Williams—suggesting the Federal Reserve might need time to assess new data—alleviated some concerns regarding interest rate hikes, although rising US Treasury yields continued to weigh on market sentiment. Technology and biotech stocks provided further support: Z.AI rose 4.6%, Xiaomi gained 0.4%, Kingboard Laminates edged up 0.5%, WuXi Biologics climbed 5.1%, and Akeso Biopharma rose 2.1%. The market fell 4.2% this month—dragged down by rising Treasury yields, higher oil prices, and renewed fears of US rate hikes—but posted a gain of approximately 6.5% for the quarter.
Sector Performance:
Market closed for the Chinese National Day holiday; analysis based on external market movements only.
Technical Analysis:
Hang Seng Index closing level on Wednesday: 24,613 points (+0.37% / +89.7 points); intraday range: 24,332–24,638. The index closed the month with a bullish candle, having opened lower before rallying to recover from intraday lows. Candlestick Structure: The daily chart closed with a small-bodied bullish candle featuring a long lower shadow; intraday support emerged at a low of 24,332, and a capital-driven rally in the afternoon helped recoup earlier losses. Prices remain below the 20-day moving average, and medium-term moving averages maintain a bearish alignment; this represents a short-term corrective rebound within a weak market trend rather than a trend reversal. RSI (14) is approximately 40.19, sitting in the low-neutral range without entering overbought territory; rebound momentum is moderate, lacking strong bullish signals. Intraday sector and capital trends: Leading sectors included innovative drugs/CXO and tourism/consumption (driven by holiday expectations); most tech stocks—such as Meituan, Kuaishou, and Baidu—rebounded, while Tencent saw a slight decline. Drag factors included pullbacks in the semiconductor and real estate sectors. Southbound capital recorded a net inflow of over HKD 6.8 billion for the day; increasing positions against the trend ahead of the holiday provided intraday support at the lows.
Thursday (October 1) Outlook (Market closed; analysis based on external markets only): Hong Kong markets are closed all day Thursday; only night-session futures, US stocks/Treasuries, and the US Dollar Index continue trading. Hang Seng Index (HSI) futures during the night session will track fluctuations in external markets.
Trading Strategy:
Market closed for China's National Day; analysis based on external markets only.
Key Risk Warnings:
1. Long-holiday cross-period risk: Overseas market movements, US Treasury/dollar fluctuations, and geopolitical events occurring while Hong Kong markets are closed (Thursday–Friday) could lead to significant gap-ups or gap-downs at Friday's open. Holding leveraged positions (HSI futures, options) over the long holiday carries extreme risk regarding gap-induced stop-loss triggers.
2. Trend risk: Daily moving averages currently show a bearish alignment; the current movement is a rebound, not a reversal, and its sustainability is questionable. Do not mistake this for the start of a new bullish trend and take heavy long positions.
3. Capital structure: Southbound capital flows will pause during the holiday, meaning this source of incremental support will be missing when trading resumes; negative headwinds persist for the semiconductor and real estate sectors, and volatility in heavyweight stocks may amplify index fluctuations.
Disclaimer: The information contained herein (1) is proprietary to BCR and/or its content providers; (2) may not be copied or distributed; (3) is not warranted to be accurate, complete or timely; and, (4) does not constitute advice or a recommendation by BCR or its content providers in respect of the investment in financial instruments. Neither BCR or its content providers are responsible for any damages or losses arising from any use of this information. Past performance is no guarantee of future results.
More Coverage







2026 © - All Rights Reserved by BCR Co Pty Ltd
Risk Disclosure:Derivatives are traded over-the-counter on margin, which means they carry a high level of risk and there is a possibility you could lose all of your investment. These products are not suitable for all investors. Please ensure you fully understand the risks and carefully consider your financial situation and trading experience before trading. Seek independent financial advice if necessary before opening an account with BCR.
BCR Co Pty Ltd (Company No. 1975046) is a company incorporated under the laws of the British Virgin Islands, with its registered office at Trident Chambers, Wickham’s Cay 1, Road Town, Tortola, British Virgin Islands, and is licensed and regulated by the British Virgin Islands Financial Services Commission under License No. SIBA/L/19/1122.
Open Bridge Limited (Company No. 16701394) is a company incorporated under the Companies Act 2006 and registered in England and Wales, with its registered address at Kemp House, 160 City Road, London, England, EC1V 2NX. Open Bridge Limited acts solely as a payment processor for BCR Co Pty Ltd and does not provide any financial, trading, or investment services on its behalf. Open Bridge Limited's role is limited to payment processing.


 English
 简体中文
简体中文
 繁體中文
繁體中文
 Bahasa
Melayu
Bahasa
Melayu
 Tiếng
Việt
Tiếng
Việt
 ไทย
ไทย
 日本語
日本語
 한국어
한국어
 ភាសាខ្មែរ
 español