0
US Dollar Index
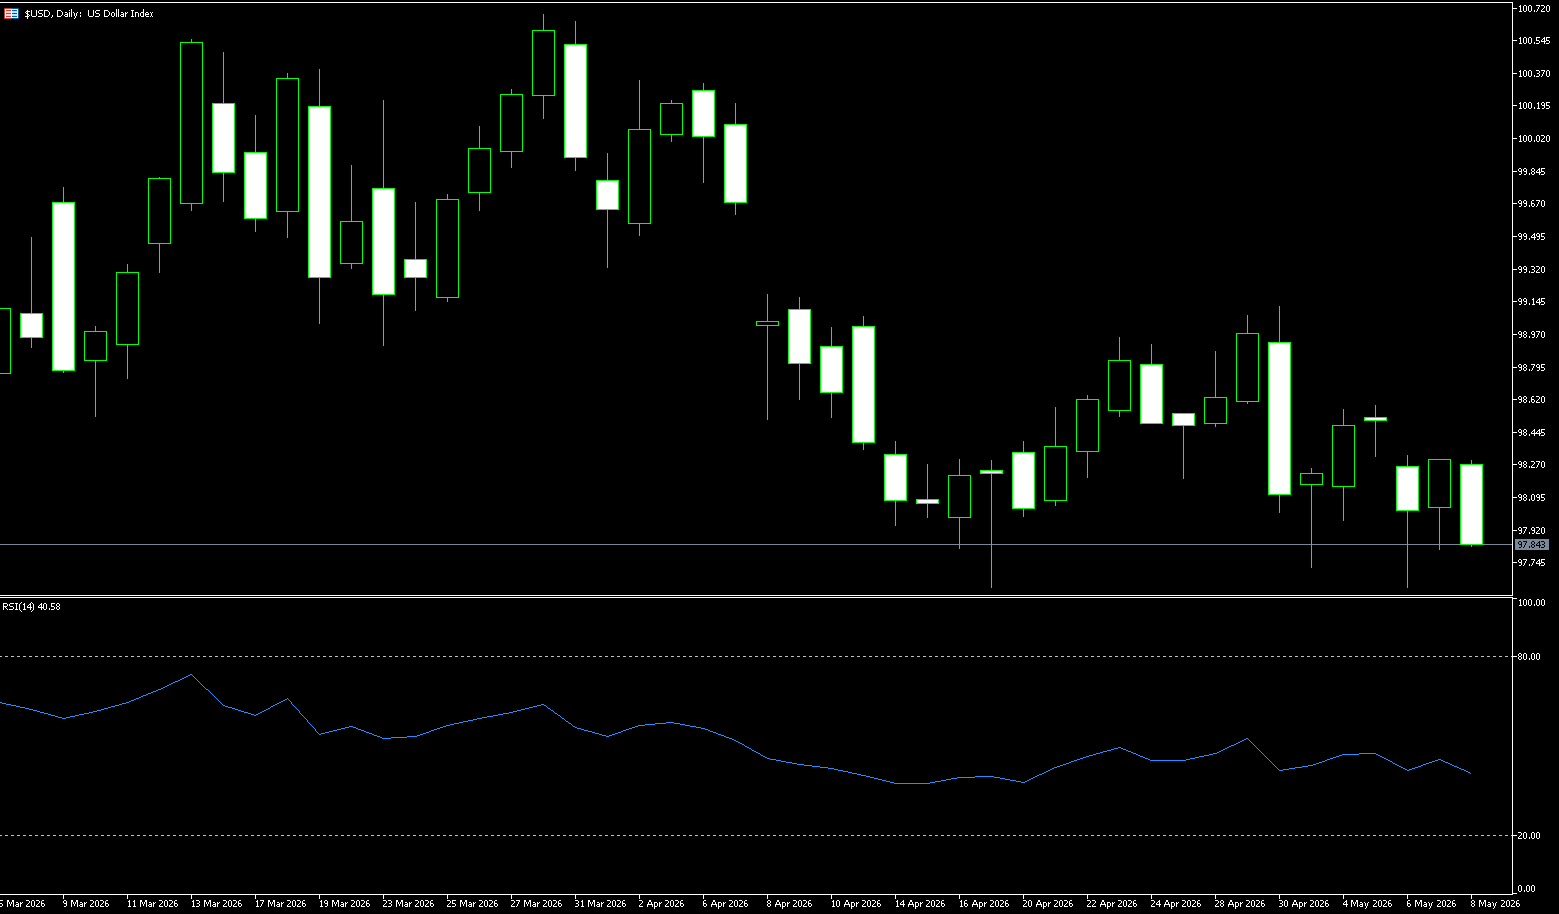
The US dollar index climbed to around 98 on Monday, partially recovering last week's losses, as the US and Iran struggled to find a diplomatic solution to end their 10-week conflict, supporting demand for safe-haven currencies. President Trump dismissed Iran's response to his peace proposals as "completely unacceptable," as Tehran reportedly offered to transfer some of its highly enriched uranium stockpile to a third country while refusing to dismantle its nuclear infrastructure. On the economic front, data released on Friday showed that US nonfarm payrolls increased by 115,000 in April, significantly exceeding the expected increase of 62,000, reinforcing market views that the Federal Reserve may keep interest rates unchanged this year. Investors are now focused on the upcoming April US inflation data, which will provide further insight into how rising oil prices are impacting broader price pressures in the economy.
US-Iran peace talks have broken down again, with Trump calling Iran's response "completely unacceptable." Tensions in the Middle East directly provided the dollar with its safe-haven appeal. Overall, this triggered a sharp rise in oil prices. The premium of the dollar as a traditional safe-haven asset has risen rapidly. However, geopolitical risks and the Fed's policy shift continue to support its medium- to long-term investment value. This week's US CPI data will be a key indicator. Technical indicators show the US dollar index is in a short-term weak position. Currently, the US dollar index has fallen back to the 98.33 and 98.53 USD (200-day moving average) area below the Bollinger Band midline, and the narrowing range suggests that volatility may further compress. In the MACD indicator, the negative area continues to expand, and downward momentum still dominates. The candlestick pattern shows a gradual convergence after high-level trading, and combined with the MACD death cross signal, if it cannot effectively recover the 98.33-98.53 range in the short term, the technical factors will continue to put pressure on the bulls. Pay attention to the effectiveness of the support near the lower Bollinger Band at 97.76 and 97.62 (last week's low).
Today, consider shorting the US Dollar Index at 98.05, with a stop-loss at 98.20 and targets at 97.60 and 97.70.
WTI Crude Oil
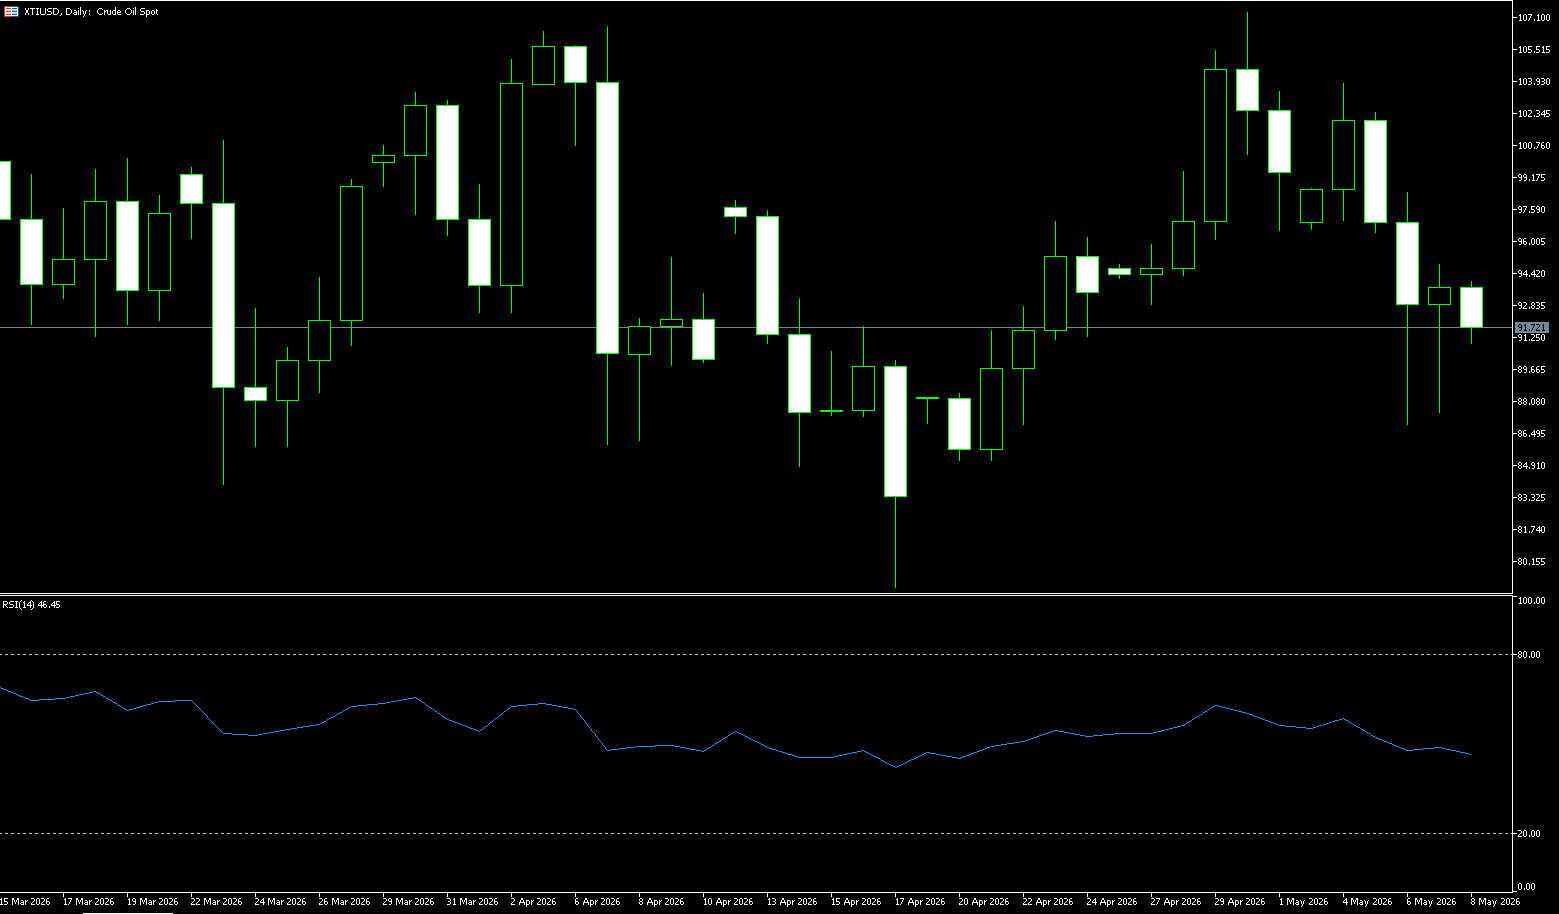
On Monday morning in Asian trading, hopes for US-Iran negotiations broke down again. Influenced by news that Trump rejected the Iranian proposal, US crude oil opened nearly 3% higher, trading at a high of around $96.60 per barrel, and may test the $100 per barrel mark during the day. Iran put forward specific conditions in its proposal to the US, demanding that the US Treasury Department's Office of Foreign Assets Control lift all sanctions related to Iranian oil sales within 30 days. This timeframe demonstrates Iran's urgency in wanting to quickly lift sanctions. The situation in the Middle East has once again become the core focus of global financial markets. After Iran formally responded to the US-proposed ceasefire, market expectations for easing tensions quickly cooled, replaced by a new round of concerns about energy supply security. As a result, international oil prices rose sharply, and the risk premium in the energy market widened significantly. Market analysts believe that the sudden hardening of the US stance indicates that significant differences remain between the two sides on core issues, particularly regarding nuclear programs, highly enriched uranium stockpiles, and regional security arrangements, making it difficult to reach an agreement in the short term.
The current deadlock in US-Iran negotiations suggests that geopolitical risks in the Middle East are unlikely to ease significantly in the short term. The Strait of Hormuz, as one of the world's most important energy transport routes, directly impacts the global crude oil pricing system. Technically, international oil prices are currently maintaining a high-level consolidation structure. On the daily chart, WTI crude oil remains within its main upward channel, and prices have not broken below the important support area around $90, indicating a continued bullish trend. Currently, the $100 level presents a temporary psychological resistance level. If geopolitical risks escalate further, a test of the $107.35 area (April 30 high) cannot be ruled out. Conversely, if there are signs of easing in negotiations, a retest of the $90 level and the $86.92 support level (last week's low) is possible.
Today, consider going long on crude oil at 94.76, with a stop loss at 94.60 and targets at 96.00 and 97.00.
Spot Gold
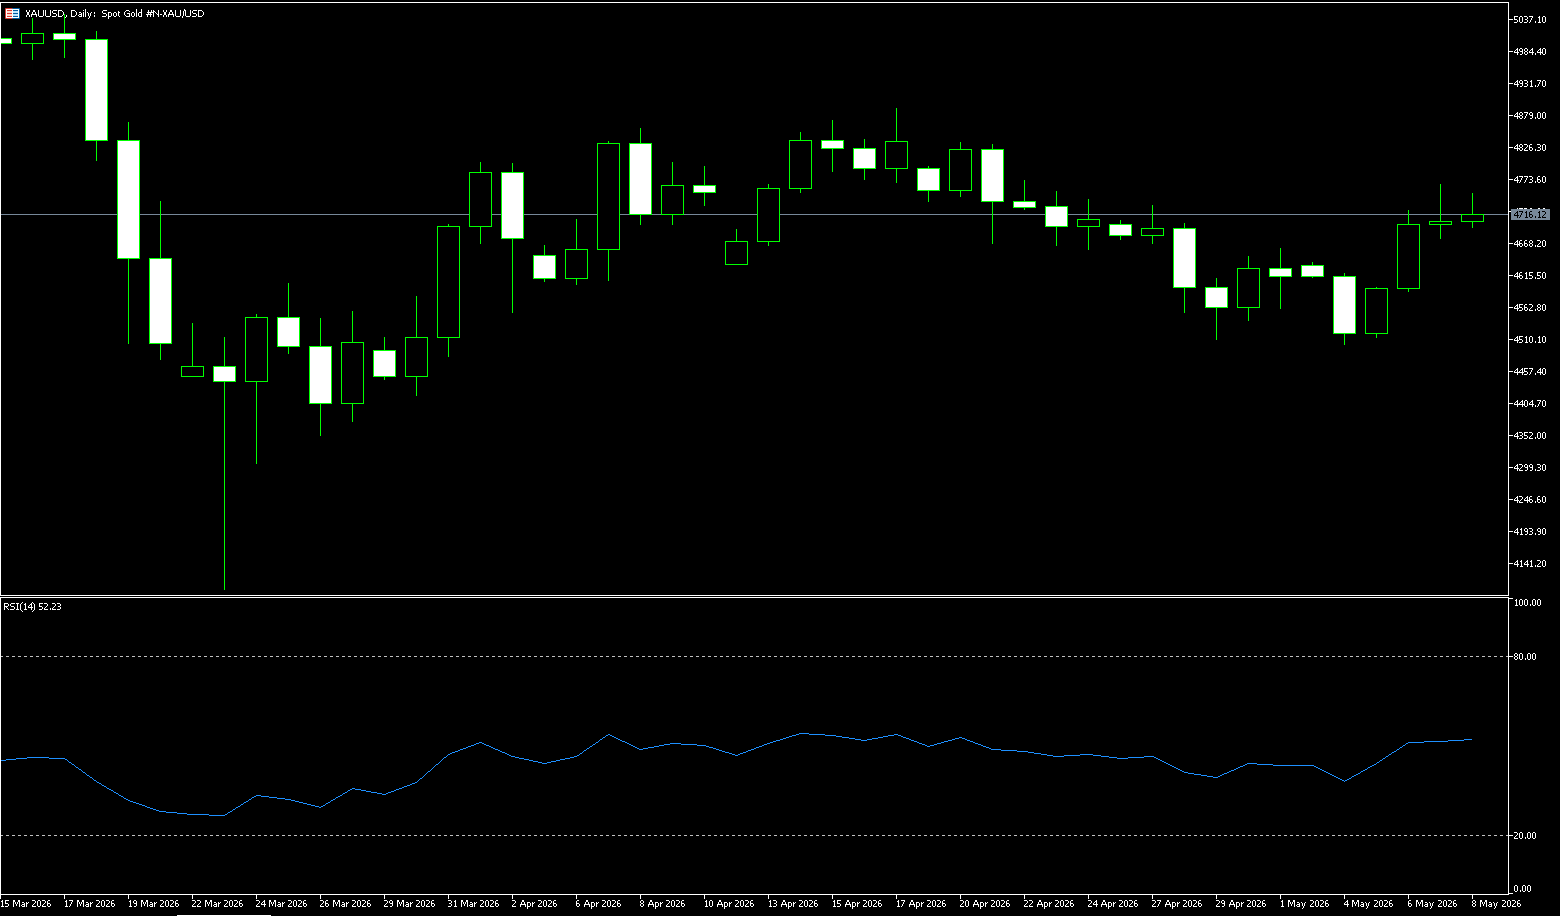
US-Iran talks broke down again, with Trump calling Iran's response "completely unacceptable." Oil prices surged over 3%, pushing up inflation expectations and dampening the prospect of interest rate cuts, causing spot gold to gap down nearly $50 to $4,670 per ounce. Gold prices are under pressure in the short term, but geopolitical risks and the Fed's policy shift still support its medium- to long-term investment value. This week's US CPI data will be a key indicator. Gold rose last week due to market optimism about US-Iran talks, with spot gold accumulating a 2.15% gain, closing near $4,715 at one point. However, after the situation reversed on Monday, gold quickly gapped down. This "expectation rises, reality falls" pattern highlights that gold is currently more of a "risk asset" than a traditional safe-haven asset. Considering the current situation, gold will still face some adjustment pressure in the short term. The risk premium resulting from the breakdown of US-Iran peace talks flowed more towards crude oil and the US dollar than towards gold. However, this divergence is not irreversible. Once there is substantial progress in the ceasefire, oil prices fall, or the Federal Reserve signals marginal easing, gold's rebound momentum will quickly return.
Currently, the biggest variables in the gold market remain the situation in the Middle East and the Federal Reserve's policy path. If energy prices continue to rise and push up global inflation, gold may continue to fluctuate between "safe-haven demand" and "high interest rate pressure." From a technical perspective, gold maintains a high-level consolidation structure on the daily chart. The overall bullish trend has not been completely broken, but some short-term adjustment pressure has emerged. The $4,700 level is currently a key psychological level, while the $4,650 area forms a phased support. A break below this level could lead to further testing of the $4,600 area. On the upside, the $4,750 to $4,780 area still presents significant technical resistance. If the situation in the Middle East escalates further, or the US dollar weakens again, gold still has a chance to retest historical highs. The MACD indicator's red bars are gradually shortening, indicating a slowdown in bullish momentum. The RSI indicator has also retreated from its highs, reflecting a cooling of short-term bullish sentiment in the market.
Consider going long on gold today at 4,730, with a stop-loss at 4,725 and targets at 4,760 and 4,770.
AUD/USD
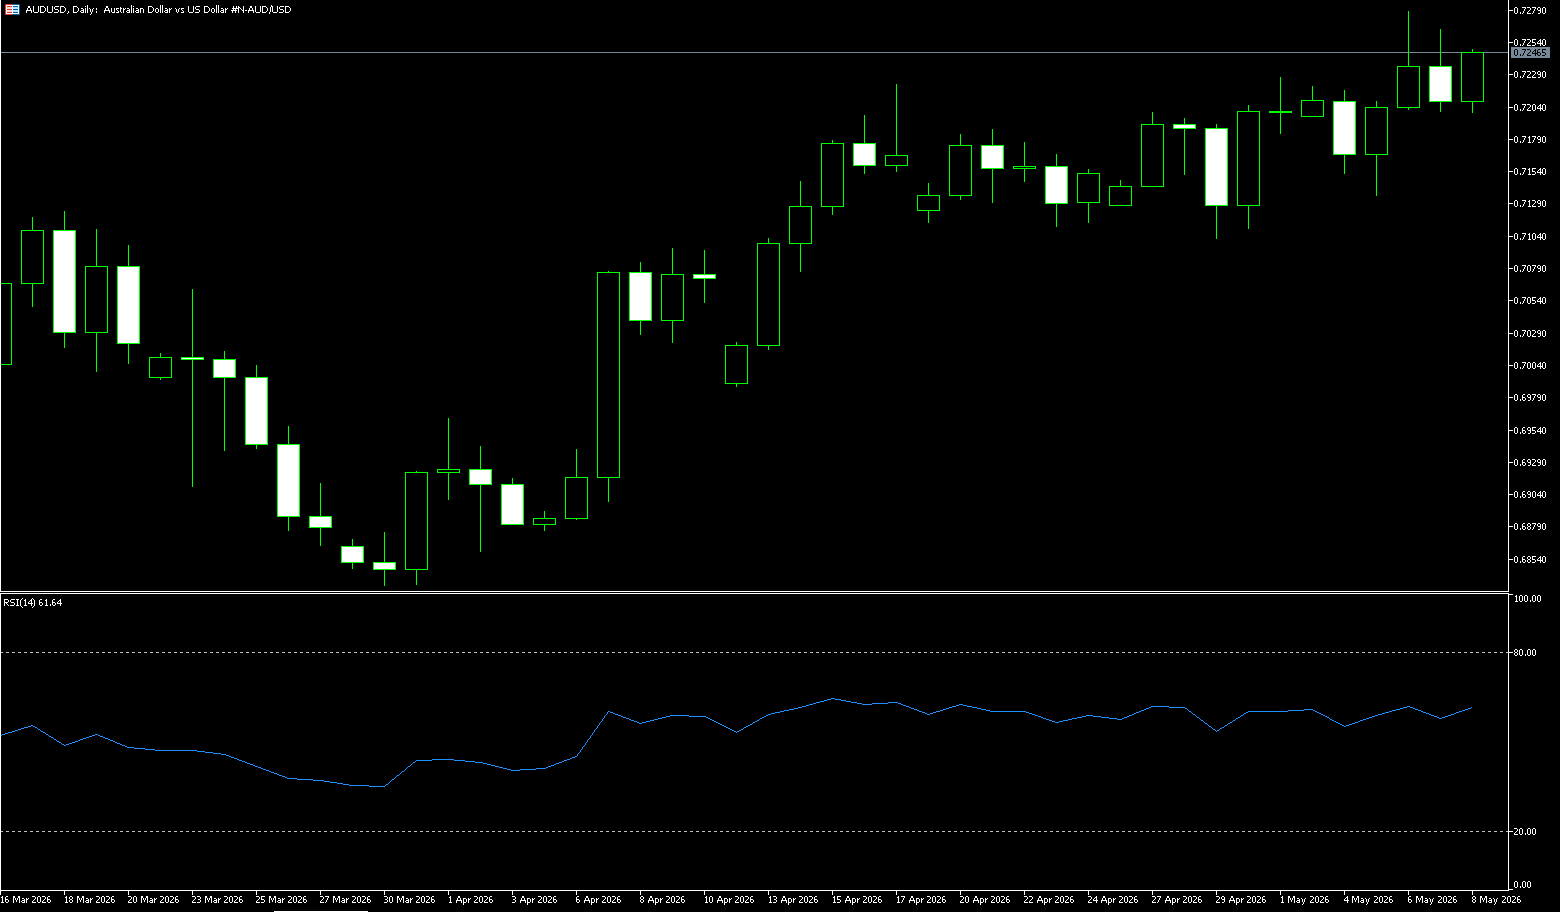
The Australian dollar fell to around US$0.7240, but remains near its highest level since April 2022, as escalating geopolitical tensions keep market expectations for a hawkish policy outlook high. The US and Iran continue to face difficulties in finding a diplomatic solution, while the Strait of Hormuz remains effectively closed, leading to high energy prices and exacerbating inflation concerns. This strengthens market expectations that the central bank may maintain higher interest rates for longer or raise rates further to curb price pressures. Last week, the Reserve Bank of Australia significantly raised its inflation forecast, expecting inflation to peak near 5%, while lowering its economic outlook. The updated forecast was released against the backdrop of policymakers raising interest rates to 4.35%, the third consecutive rate hike this year. The market now suggests a roughly 20% chance of another rate hike in June, but this is fully priced into the 4.6% rate for September.
The Australian dollar is attempting to break out of its multi-day consolidation phase, with the AUD/USD pair hitting a new yearly high near the 0.7300 level. The positive outlook for the pair remains unchanged. The Australian dollar continued last week's optimism, pushing AUD/USD to a year-to-date high above 0.7200, primarily driven by a significant improvement in risk sentiment. The 14-day Relative Strength Index (RSI) is around 60, indicating supporting momentum but not yet entering overbought territory, suggesting solid but not excessive buying pressure. The AUD/USD pair could rebound to 0.7277, the highest level since June 2022, reached on May 6th. A sustained break above this level would support the pair's target of 0.7300 (the psychological level). On the downside, initial support is at the 20-day simple moving average of 0.7177, followed by the psychological level of approximately 0.7100.
Consider going long on the Australian dollar today at 0.7235, with a stop-loss at 0.7220 and targets at 0.7280 and 0.7290.
GBP/USD
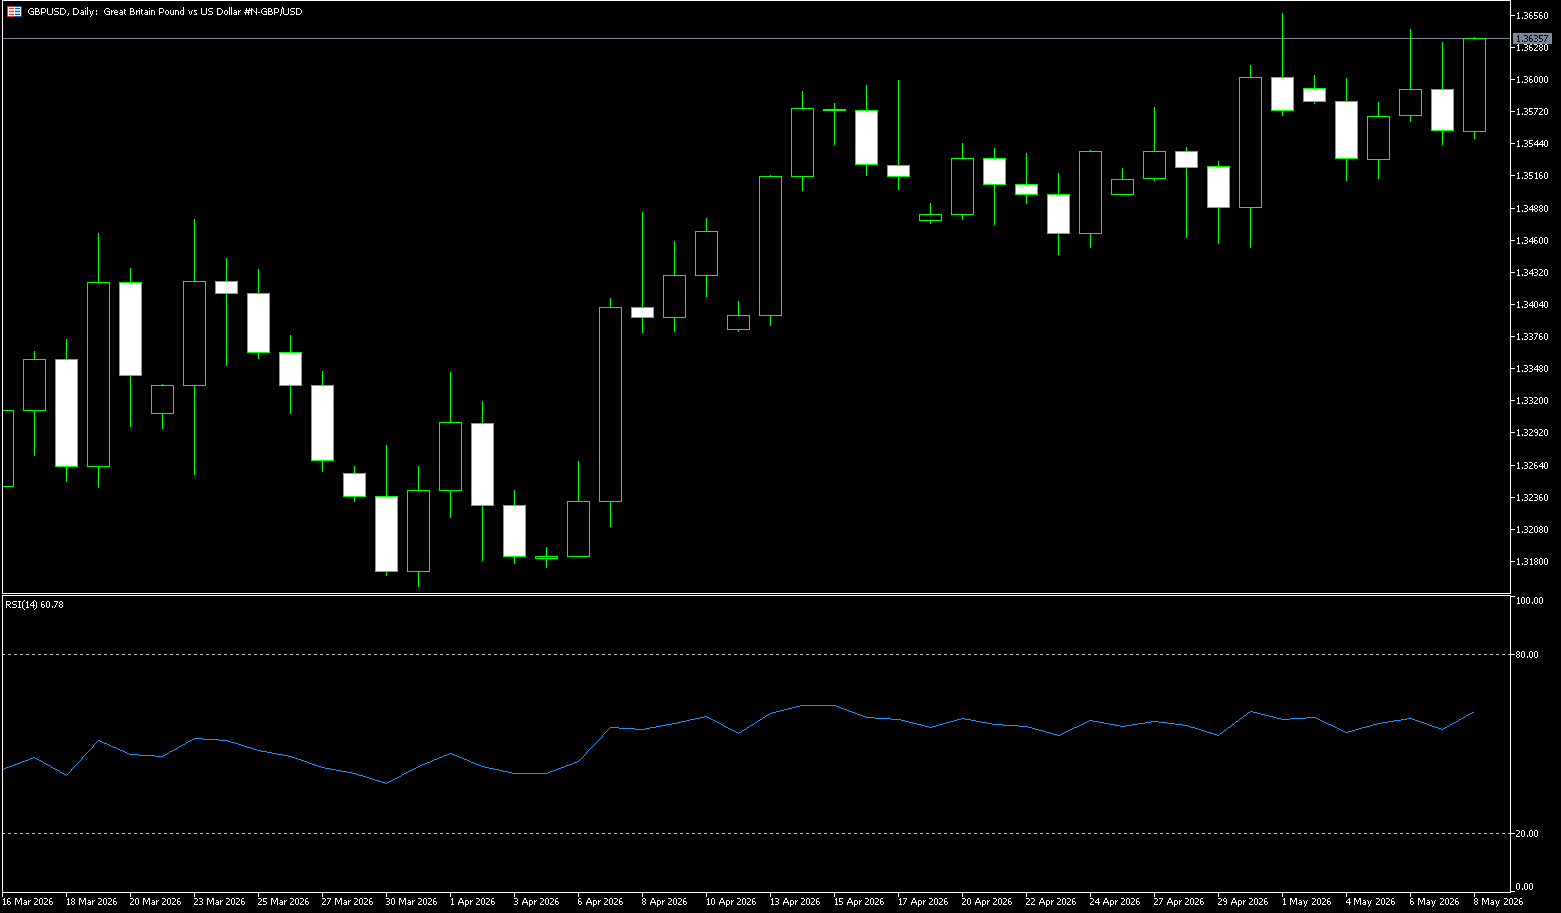
The GBP/USD pair managed to hold above 1.3600 during Monday's Asian session, thanks to some dollar buying. Recent optimism about a potential peace agreement between the US and Iran quickly faded following renewed hostilities in the Strait of Hormuz and significant disagreements over Tehran's nuclear program. Furthermore, renewed hawkish expectations from the Federal Reserve boosted dollar demand, limiting the GBP/USD's rebound from the 1.3550-1.3545 range. However, the Bank of England's statement that a rate hike might be appropriate if inflation persists, coupled with easing concerns about Prime Minister Keir Starmer's stance, has provided support for the pound. This continues to be a driving force for the GBP/USD pair, and some caution is needed before preparing for any meaningful decline.
From a technical perspective, the spot price holding above the 10-day simple moving average at 1.3560 suggests a mildly constructive bias in the near term. Nevertheless, momentum indicators are mixed, with the Relative Strength Index (RSI) hovering near the 55 neutral level and the Moving Average Convergence Divergence (MACD) slightly retreating below zero. This, in turn, suggests that the upward traction is temporary rather than impulsive. On the downside, the 20-day moving average at 1.3543 has strengthened initial support, and a break below this level would lead to further correction towards the psychological level of 1.3500. As long as the GBP/USD exchange rate remains above this moving average, buyers retain a short-term advantage, and the bottoming phase could be prolonged in the absence of any relevant economic data to impact market movements. The 1.3599 (April 17 high) and 1.3600 (psychological level) areas form immediate resistance; a break above these levels would open the way to 1.3700 (psychological level).
Consider going long on GBP at 1.3600 today, with a stop loss at 1.3590 and targets at 1.3670 and 1.3680.
USD/JPY
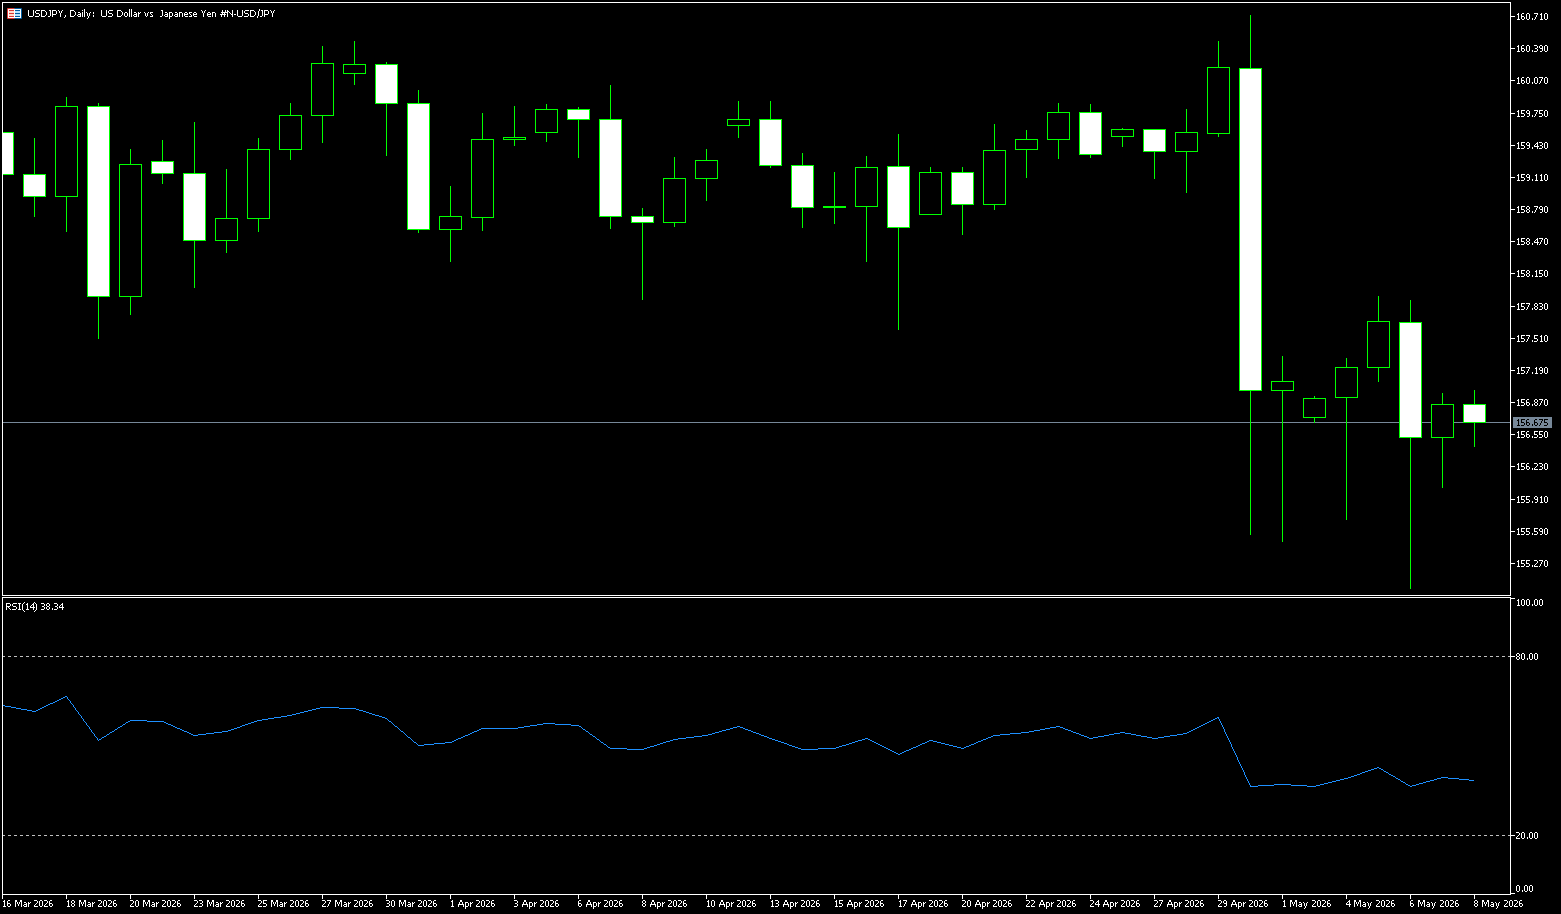
The yen slipped to around 157.10 yen per dollar on Monday, reversing last week's gains, as the dollar strengthened on safe-haven demand after President Trump rejected Iran's response to its peace proposal, dimming hopes for an end to the 10-week conflict. Reports indicated that Iran proposed transferring some of its highly enriched uranium stockpile to a third country while refusing to dismantle its nuclear facilities. Soaring oil prices exacerbated inflation concerns and put pressure on oil-importing economies like Japan. Meanwhile, traders remained vigilant after multiple rounds of alleged intervention by Japanese authorities since April 30, with the total reported intervention amounting to approximately 10 trillion yen. Although Tokyo has not confirmed intervention, Chief Currency Diplomat Atsushi Miura stated that officials are prepared to address speculation in all aspects, noting that the International Monetary Fund (IMF) does not impose strict limits on the frequency of intervention.
The conflict between the US and Iran in the Strait of Hormuz has increased the risk of another surge in oil prices, which could undermine Japan's efforts to prevent the dollar/yen exchange rate from breaking through the 160 mark. According to IMF rules on free-floating exchange rates, the Bank of Japan can intervene a maximum of three times within six months, with each intervention not exceeding three consecutive trading days. Technically, the dollar/yen exchange rate experienced a sharp sell-off after breaking the psychological level of 160.00 at the end of April, with a suspected intervention by the Japanese Ministry of Finance costing over $30 billion pushing the exchange rate down to the 155.05 area. Currently, resistance is located in the 158.14 (14-day moving average) - 158.00 (psychological level) range. A break above this level could test the 159.00 (psychological level). Short-term support is at 156.20-156.27; a break below this level could lead to a test of the 155.05 (last week's low). Further down, the 200-day moving average is around 154.35.
Today, consider shorting the US dollar at 157.38, with a stop-loss at 157.55 and targets at 156.40 and 156.60.
EUR/USD
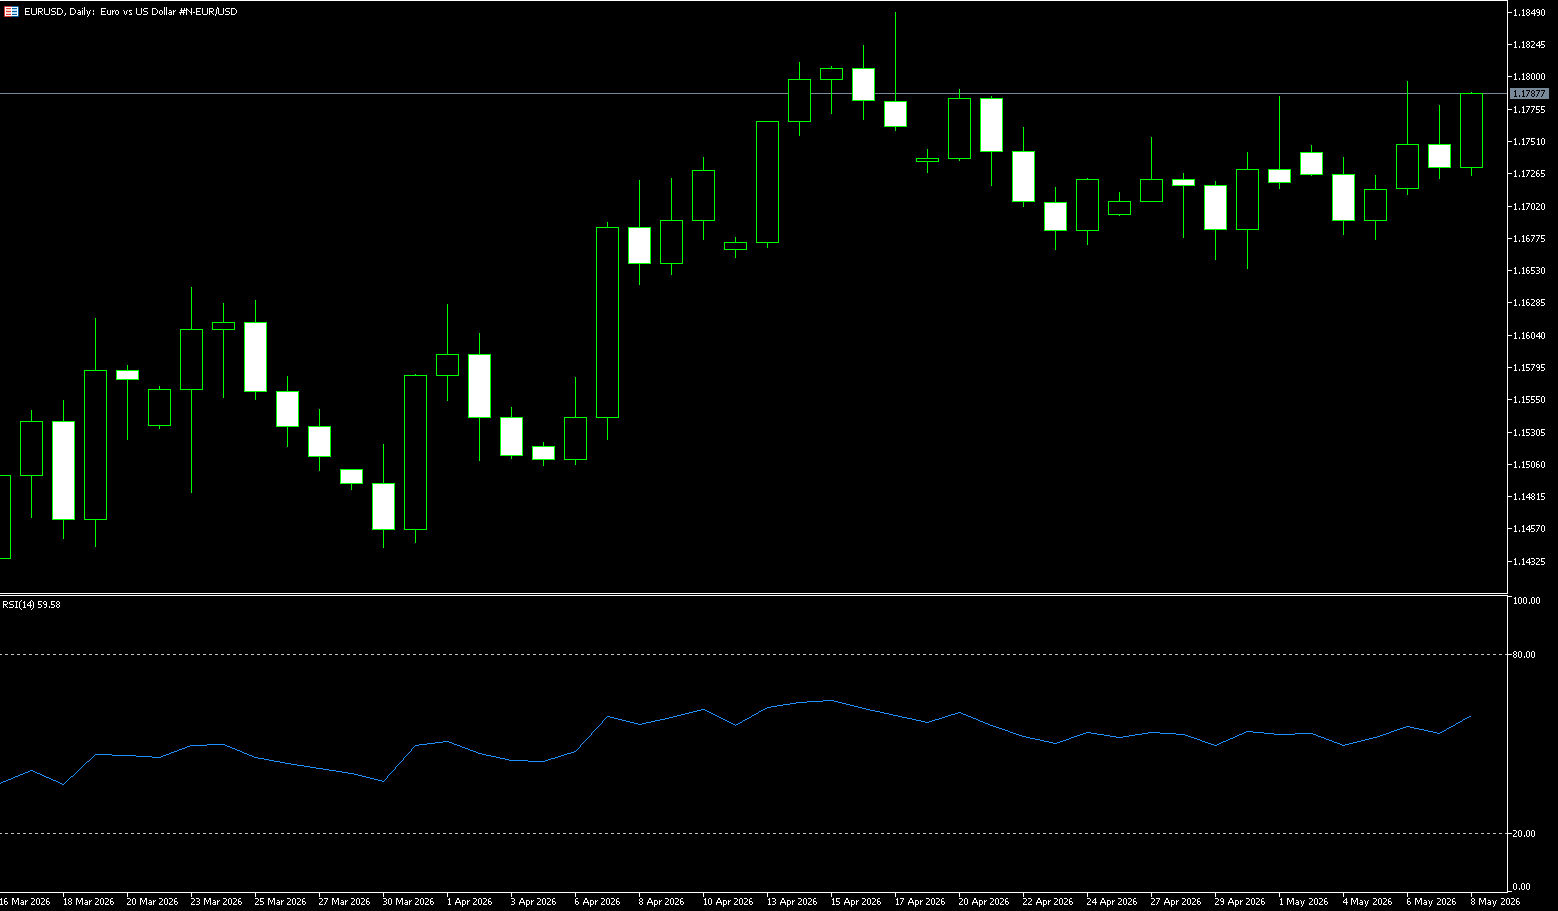
The euro continued its upward trend above $1.1750, reaching its highest level since April 20th, boosted by optimism regarding a potential resolution to the conflict with Iran. US President Trump confirmed that the ceasefire agreement with Iran remains in effect, while Tehran stated it is still reviewing US proposals to end the conflict. US Secretary of State Marco Rubio added that Washington expects Iran to respond quickly. Meanwhile, Trump warned the EU that if the group does not remove tariffs on US goods by July 4, the US will impose "higher" tariffs on EU goods. The currency market expects the European Central Bank to raise interest rates at least twice this year, with a greater than 75% probability of a first rate hike in June. ECB President Christine Lagarde pointed out on Friday that the central bank is prepared to act quickly if necessary, and that the Eurozone's economic starting point before the energy shock was more favorable than before Russia's invasion of Ukraine.
From a daily chart perspective, the euro/dollar pair maintains a generally range-bound, slightly bullish structure. The exchange rate has recently tested the 1.1796 (May 6 high) to 1.1800 (psychological level) area multiple times, but has failed to break through effectively, indicating significant selling pressure in this area. Technically, the daily MACD remains above the zero line, indicating that upward momentum is beginning to weaken. The RSI indicator is currently around 55, indicating a slightly bullish market sentiment. Regarding the moving average system, the 5-day and 10-day moving averages have begun to flatten, while the 20-day moving average continues to rise, indicating that the overall trend of EUR/USD has not yet turned bearish, but the market has entered a consolidation phase. If it can effectively break through 1.1796 (the high of May 6th) to 1.1800 (the psychological level), the market may further test 1.1850 or even the year's high area. Conversely, EUR/USD may weaken again to 1.1700 (the psychological level), pushing the pair back down to between 1.1681 (the 200-day moving average) and 1.1666 (the 38.2% Fibonacci retracement level).
Today, consider going long on EUR/USD at 1.1770, with a stop loss at 1.1760 and targets at 1.1850 and 1.1840.
Disclaimer: The information contained herein (1) is proprietary to BCR and/or its content providers; (2) may not be copied or distributed; (3) is not warranted to be accurate, complete or timely; and, (4) does not constitute advice or a recommendation by BCR or its content providers in respect of the investment in financial instruments. Neither BCR or its content providers are responsible for any damages or losses arising from any use of this information. Past performance is no guarantee of future results.
More Coverage


Risk Disclosure:Derivatives are traded over-the-counter on margin, which means they carry a high level of risk and there is a possibility you could lose all of your investment. These products are not suitable for all investors. Please ensure you fully understand the risks and carefully consider your financial situation and trading experience before trading. Seek independent financial advice if necessary before opening an account with BCR.
BCR Co Pty Ltd (Company No. 1975046) is a company incorporated under the laws of the British Virgin Islands, with its registered office at Trident Chambers, Wickham’s Cay 1, Road Town, Tortola, British Virgin Islands, and is licensed and regulated by the British Virgin Islands Financial Services Commission under License No. SIBA/L/19/1122.
Open Bridge Limited (Company No. 16701394) is a company incorporated under the Companies Act 2006 and registered in England and Wales, with its registered address at Kemp House, 160 City Road, London, City Road, London, England, EC1V 2NX. This entity acts solely as a payment processor and does not provide any trading or investment services.

 English
 简体中文
简体中文
 繁體中文
繁體中文
 Bahasa
Melayu
Bahasa
Melayu
 Tiếng
Việt
Tiếng
Việt
 ไทย
ไทย
 日本語
日本語
 한국어
한국어
 ភាសាខ្មែរ
 español