


0
Currency & Commodity Analysis:
US Dollar Index (DXY)
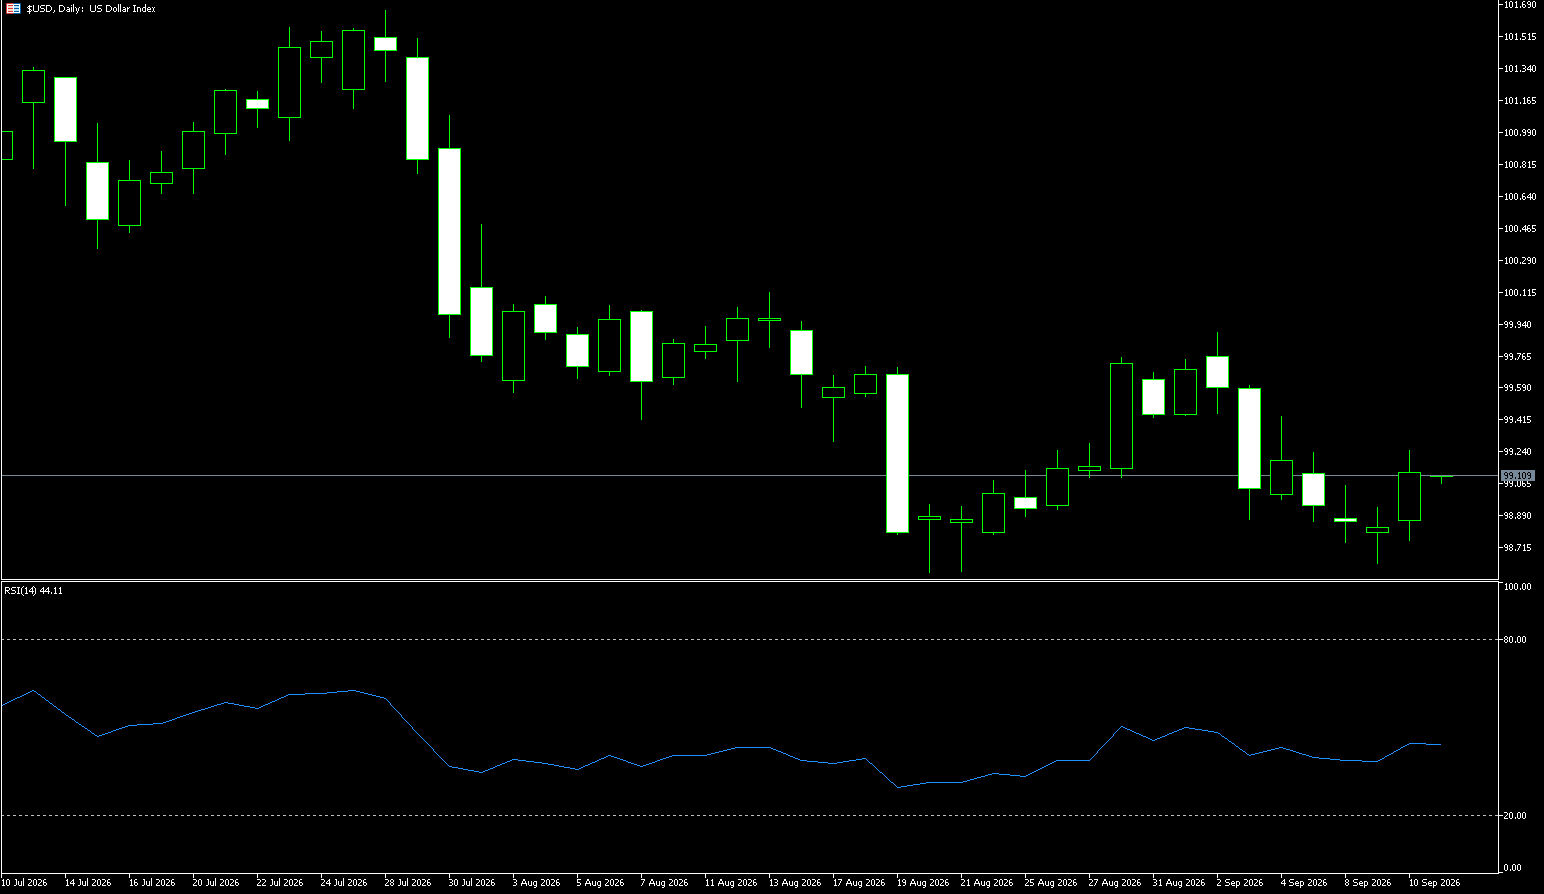
Last week, the US Dollar Index traded within a range, with bulls and bears battling around the 99 level, ultimately resulting in a slight downward shift in the price center. Early in the week, the index rebounded to test the 99.40–99.60 resistance zone but faced rejection and retreated; in the latter half of the week, it came under pressure and fell, touching a low near the 98.60 area. Data released last week indicated that US producer inflation accelerated last month, driven by a rise in wholesale energy prices linked to the conflict involving Iran. Markets currently estimate a roughly 71% probability of a 25-basis-point Federal Reserve rate hike next week, up from 61% prior to the PPI data release. Treasury yields also surged significantly after the US Treasury Department expanded its buyback operations for the first time, as the volume of purchases fell short of expectations. Meanwhile, oil prices spiked above $100 per barrel—fueled by the lack of signs that the US or Iran would back down in the conflict—sparking global concerns.
A disconnect has become increasingly apparent between recent US dollar movements and expectations for US interest rates. On one hand, robust US economic data has led markets to anticipate further monetary tightening by the Fed; on the other, the dollar has struggled to shake off downward pressure, suggesting investors are awaiting clearer inflation signals to confirm the future direction of monetary policy. The dollar's recent weakness reflects a market that has not fully embraced the intensified expectations for rate hikes. With US Treasury yields at relatively high levels, bond capital flows are beginning to feel the impact of interest rate pressures. Market analysts have observed that global investors are reducing allocations to core sovereign bonds faster than to risk assets, as high yields dampen demand for certain bonds. This reallocation of capital could further heighten volatility in global financial markets and influence the dollar through interest rate and exchange rate channels.
Last week, the US Dollar Index traded predominantly below the 99.00 level. As the index remains below both the 9-day (99.12) and 34-day (99.51) exponential moving averages (EMA), the short-term bias remains bearish. This pattern indicates that nearby dynamic resistance is capping any rebound attempts. The 14-day Relative Strength Index (RSI) stands near 44.17, suggesting persistent downward pressure rather than an imminent oversold bounce. Furthermore, technical analysis of the daily chart indicates that the US Dollar Index (DXY) remains within a descending channel, suggesting a continuing bearish trend. However, the FXS Fed Sentiment Index stands at 125.72, firmly placing it in hawkish territory—well above the neutral level of 100. This reading, combined with a high FXS Speechtracker score, confirms a broad shift in market expectations toward tighter monetary policy, which should provide support for the dollar against currencies like the euro and yen in the short term. On the downside, the index may first test the one-month low of 98.56 (recorded on August 20), followed by the 98.26 level (May 13 low) and the 98.00 psychological mark. Initial resistance lies at the 9-day exponential moving average (EMA) of 99.14. Further resistance is found near the upper boundary of the descending channel at 99.40, followed by the 34-day EMA at 99.51. A breakout above this zone of confluent resistance would trigger a bullish reversal, potentially pushing the index toward the 100.00 psychological level.
Consider shorting the US Dollar Index today at 99.20; stop-loss: 99.30; targets: 98.80, 98.70.
WTI Spot Crude Oil
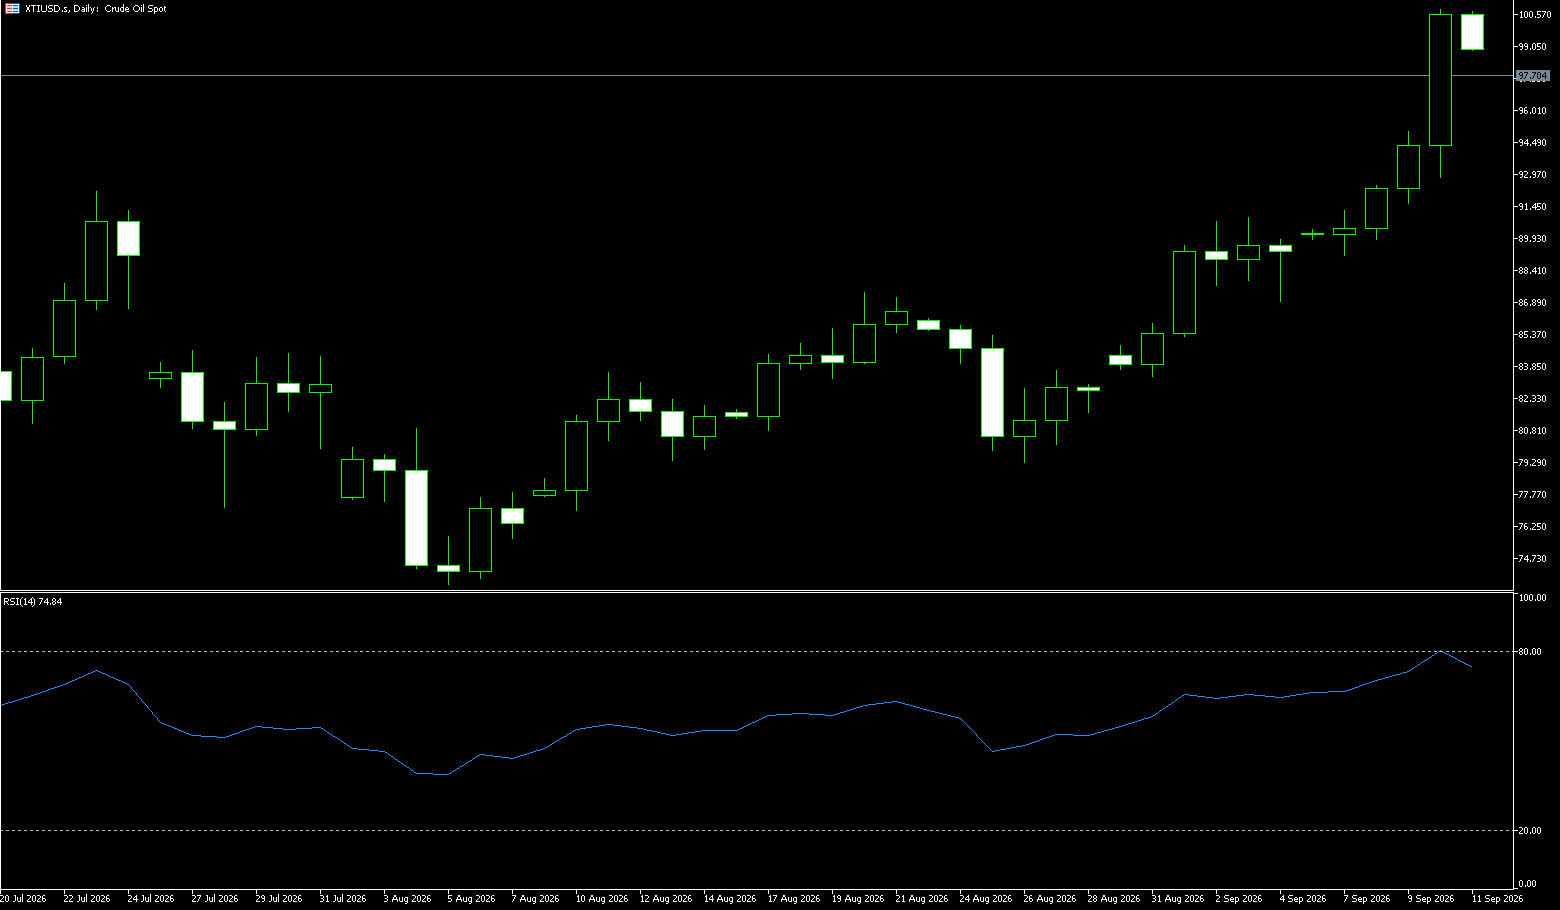
WTI crude oil, the US benchmark, surged over 7% amid escalating attacks in the Middle East, pushing the price above the $100-per-barrel mark for the first time since May 2026. After rebounding from a low of $95.37, WTI traded at $100.85. Although the price subsequently retreated to $96 per barrel, it still posted a weekly gain of over 8% as investors weighed diplomatic efforts regarding the Strait of Hormuz against the ongoing conflict in the region. Gulf foreign ministers are expected to meet their Iranian counterpart in Oman on Monday, part of an effort to secure support for interim arrangements to manage shipping through this strategic waterway. Meanwhile, the International Energy Agency (IEA) significantly downgraded its oil demand outlook, forecasting a daily reduction of 2.5 million barrels in 2026—the largest annual decline since the COVID-19 pandemic—as high fuel prices and tighter supplies weigh on consumption. The IEA noted that demand could fall further if the conflict involving Iran persists. OPEC also lowered its demand growth forecast for 2026 for the fifth consecutive time. However, renewed attacks by the Iran-backed Houthi militia on the Bab el-Mandeb Strait have sparked fresh concerns regarding supply disruptions.
The escalating situation in the Middle East has driven a rapid rise in the risk premium for crude oil supplies; disruptions to shipping in the Strait of Hormuz, attacks on regional energy facilities, and expectations of a prolonged conflict have collectively tightened the oil market. The latest price surge indicates that the market is increasingly pricing in the risk of supply disruptions from the region. International benchmark Brent crude had previously broken back above the $100 mark, with WTI strengthening in tandem—demonstrating that supply-side risks, rather than mere short-term speculative trading, remain the primary driver of rising prices. The market's primary concern has shifted from brief production halts at individual fields or facilities to the threat of systemic supply chain disruptions. Recent industry data shows that crude oil exports from the Gulf region remain significantly below pre-conflict levels; while some shipments continue via covert means, overall flow volumes have yet to normalize.
Last week, WTI crude prices were dominated by the Middle East geopolitical risk premium, exhibiting a pattern of a rapid short-squeeze rally followed by a pullback from highs. Prices climbed steadily early in the week on conflict expectations, breaching the $100 mark—a new high since May—before long positions were liquidated between Thursday night and Friday. Prices retreated sharply from their peak, falling below the $100 level during the session and closing the week with a long upper shadow on the candlestick chart—a classic technical correction following a surge. The oil market currently maintains a landscape of bullish fundamentals and high volatility, necessitating caution regarding the intense tug-of-war between bulls and bears near the $100 level. Moving averages remain in a bullish alignment, indicating the medium-term upward trend remains intact; however, the short-term price has diverged significantly from the 20-day moving average (MA20), the RSI has turned downward after entering overbought territory, and the MACD histogram is contracting alongside a visible bearish divergence signal, clearly indicating a need for a short-term pullback. Weekly chart analysis: The week closed with a bullish candle featuring a long upper shadow; while the candle body remains upward-trending—signaling the preservation of the medium-term bullish structure—immense selling pressure looms overhead, making it inadvisable to chase highs in the short term. On the daily chart, the short-term bias for WTI crude oil remains bullish, as the price holds firmly above the $90 level (a key psychological support) and the 20-day simple moving average (SMA) at $87.73; this indicates that the recent uptrend remains supported despite a recent pullback. The 14-day Relative Strength Index (RSI) stands at 65—hovering just below the overbought zone—suggesting that upward momentum remains constructive, though the market may be prone to consolidation. To the upside, immediate resistance lies at $100 (a psychological level) and $100.85 (last week's high); a decisive break above this area would pave the way for further gains toward the $103 mark. To the downside, initial support is found at $90 (key psychological support), followed by the 20-day SMA at $87.70; a significant challenge to the broader bullish structure would likely require a deeper pullback toward the $85 level.
Consider going long on crude oil today at $96.50; Stop-loss: $96.30; Targets: $99.00, $101.00.
Spot Gold
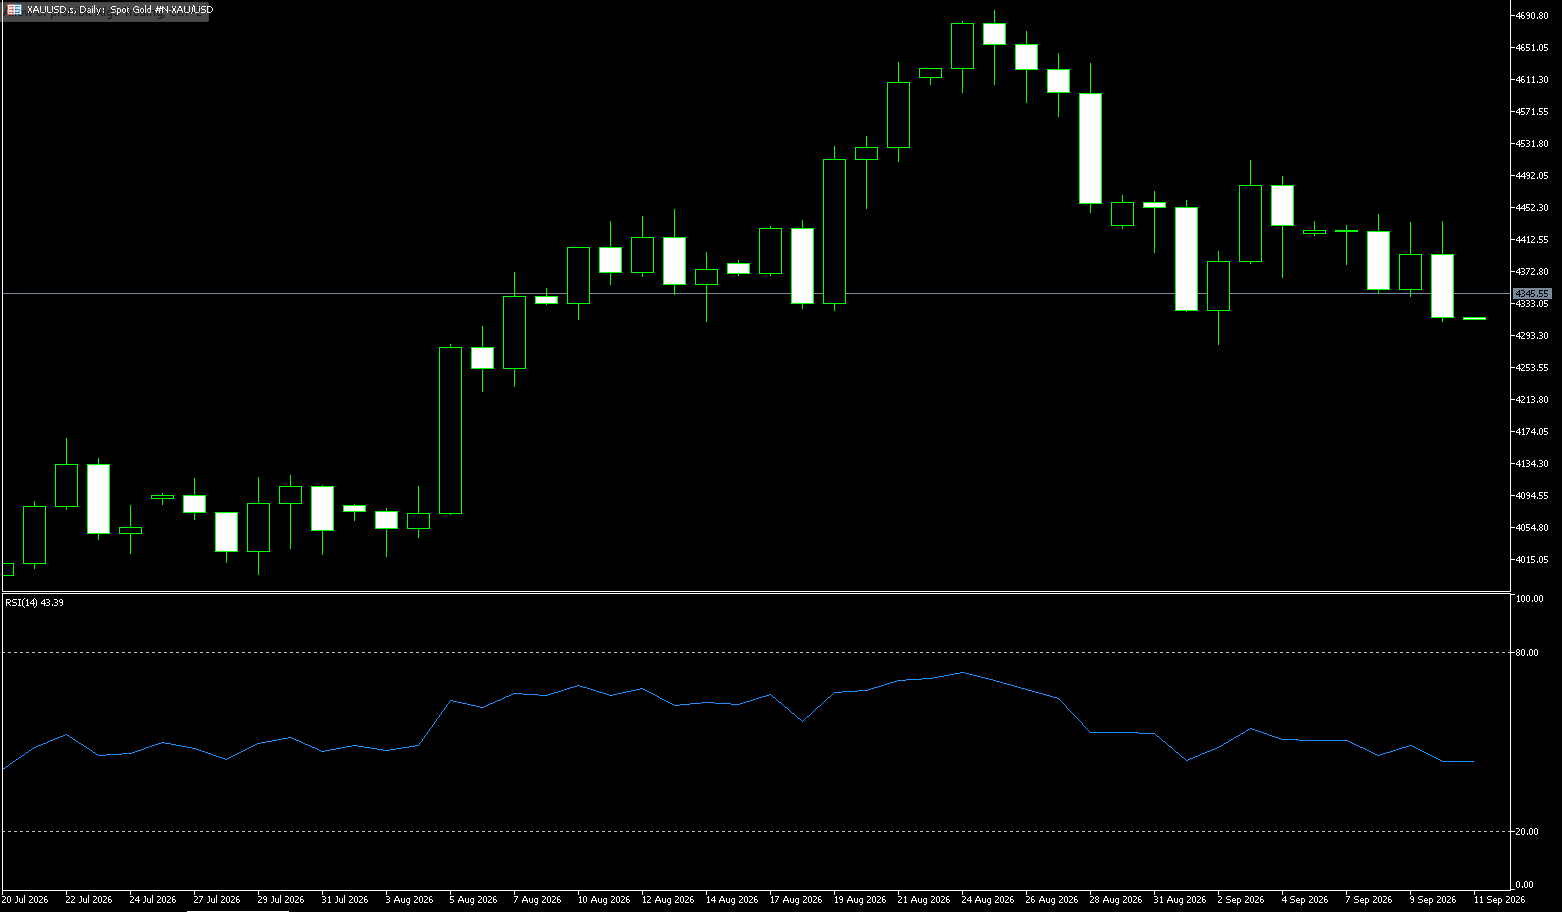
Gold retreated to around $4,300 per ounce last week after data showed US producer prices accelerating in August, driven by a rise in wholesale energy costs resulting from the Iran conflict. Markets currently price in a roughly 71% probability of a 25-basis-point Federal Reserve rate hike next week, up from 61% prior to the PPI data release. While escalating US-Iran tensions have heightened concerns about higher inflation, gold has also been influenced by the pullback in oil prices. Meanwhile, Treasury yields have surged after the US Treasury's initial expanded buyback operation saw lower-than-expected purchasing volume. Non-interest-bearing assets like gold tend to underperform when yields rise. Gold remains on track to fall nearly 2% this week, marking its third consecutive week of decline. Amidst high oil prices, the rebound in precious metals remains constrained; both Brent and WTI crude are trading at their highest levels since May, driving up global inflation and forcing central banks to tighten monetary policy. Oil prices breaching the $100 mark have created inflationary pressure while simultaneously boosting safe-haven demand; upcoming inflation data will serve as a litmus test for the short-term trend. If the data reinforces expectations for interest rate hikes, gold prices may face a pullback; conversely, if the conflict escalates further or inflation is temporarily brought under control, gold could move toward a higher trading range. Overall, gold prices are fluctuating between the 100-day moving average ($4,335) and the 200-day moving average ($4,538), requiring close monitoring of any new developments in the Middle East.
Last week, gold prices experienced a pullback from highs, trading within a narrowing range with a bearish bias. Early in the week, gold attempted a rebound, testing the $4,430–$4,450 resistance zone, but bulls failed to hold their ground. Following US PPI data that exceeded expectations and a subsequent rise in Treasury yields, gold prices came under pressure and retreated, gradually shifting lower to retest the support area near $4,300; the weekly chart is likely to close with a small bearish candle featuring an upper shadow. From a technical perspective, the daily structure for gold remains relatively positive. The fact that the price has reclaimed the level near $4,300 (last week's low) indicates that the medium-term bullish structure remains intact. However, the recent consecutive declines have significantly cooled upward momentum; the 14-day RSI stands at approximately 47.50—a neutral zone indicating neither severe overbought conditions nor clear oversold territory. This suggests a lack of strong trend momentum, with future direction remaining heavily dependent on macroeconomic data.
From a technical perspective, the daily structure for gold remains relatively positive. The price has reclaimed the level near the 100-day moving average of $4,335, indicating that the medium-term bullish structure remains intact. However, recent consecutive declines have significantly cooled upward momentum, suggesting a lack of strong trend momentum and indicating that future direction remains heavily dependent on macroeconomic data. Based on the Bollinger Bands structure, the gold price is currently trading between the lower band at 4,246 and the middle band at 4,462. To the upside, it must first break through the resistance zone around 4,443 (last week's high) and 4,462 (the Bollinger middle band). Successfully establishing a position above this level would shift market focus to 4,538 (the 200-day moving average), a key resistance area for a potential bullish retest. To the downside, the initial level to watch is last week's low near 4,300; a breach of this level could intensify downward pressure, leading to a test of the Bollinger lower band near 4,246. If the price holds the 4,300 mark, the overall structure suggests a corrective phase characterized by oscillation at elevated levels.
Consider going long on gold at 4,343 today; stop-loss at 4,338; targets: 4,380 and 4,390.
AUD/USD
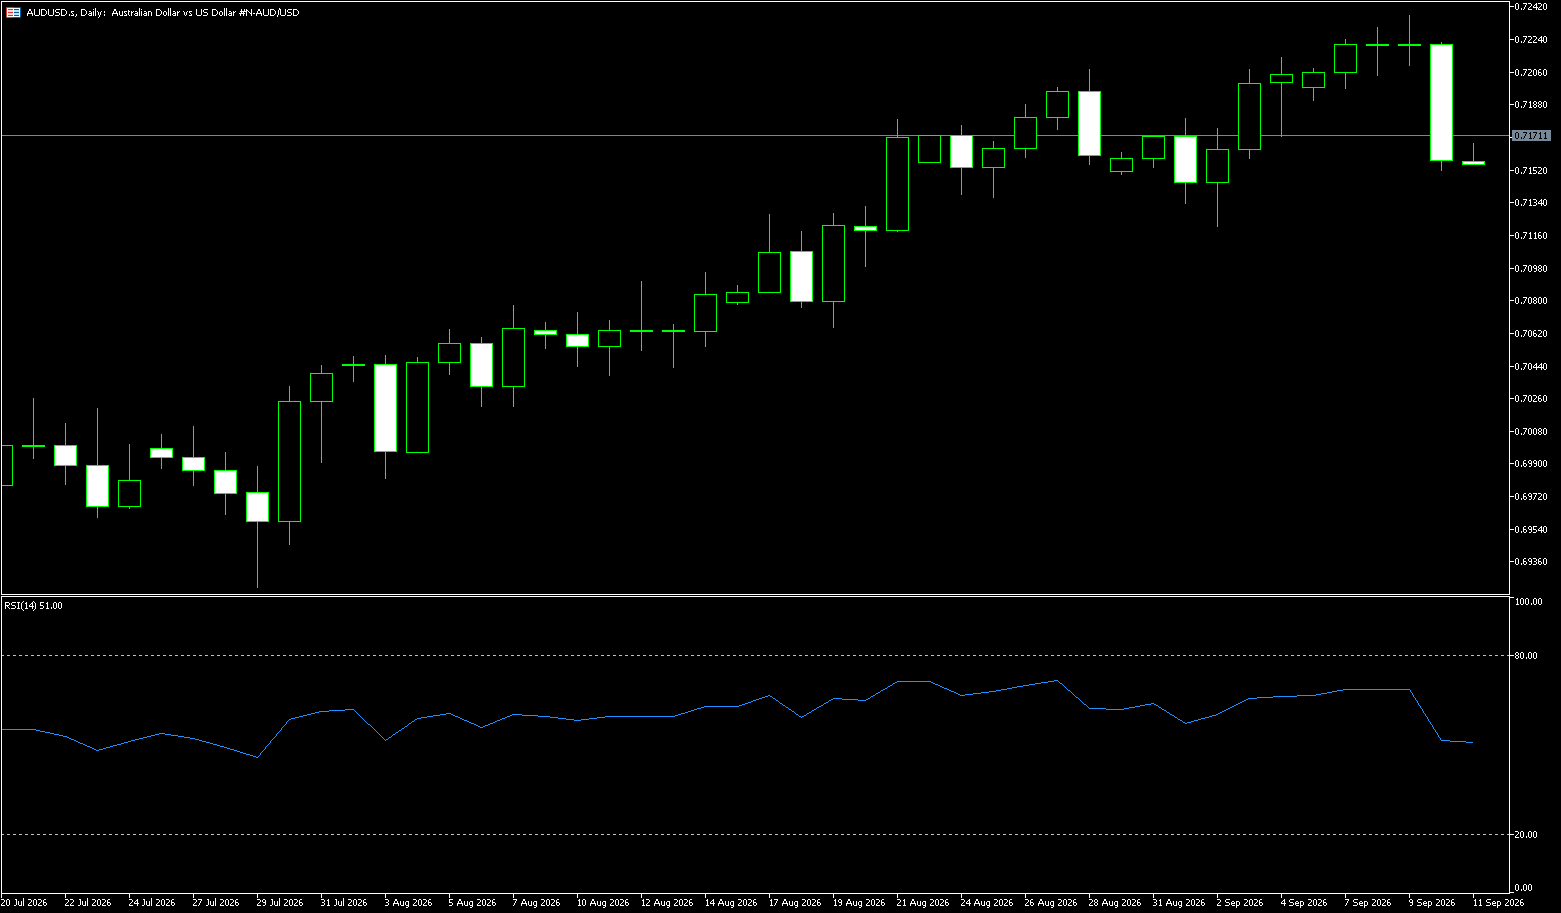
The Australian dollar fell back below $0.72 last week—nearing its lowest level in over a week—and is on track for a weekly loss as the US dollar strengthens amidst a sharp rise in Treasury yields. The dollar rallied following stronger-than-expected US producer inflation data, further fueling market expectations of a potential Federal Reserve rate hike next week. Treasury yields also surged, supported by the US Treasury purchasing less than anticipated in its inaugural expanded buyback operation. Meanwhile, oil prices continued to climb, surpassing $100 per barrel as tensions escalated in the Middle East; this has heightened inflation risks and raised market expectations that central banks may maintain tight monetary policies for longer.
Market bets on a fourth rate hike this year by the Reserve Bank of Australia (RBA) have intensified, with swap contracts now implying an 84% probability of a 25-basis-point increase at this month's meeting. Markets also anticipate the cash rate reaching 4.85% early next year—the highest level since 2008. The RBA has already raised rates three times this year to 4.35%, and the "Big Four" banks forecast another 25-basis-point hike to 4.6% before year-end. Remarks by RBA Deputy Governor Hauser echoed comments made the same day by Assistant Governor Hunter, reinforcing a hawkish signal ahead of the meeting. Hauser provided the clearest signal yet that the central bank is weighing a rate hike this month, identifying inflation as the "single big issue." A "three-headed monster"—Middle East conflict, the AI boom, and supply constraints—is driving inflation. The RBA has raised rates three times to 4.35%, and the major banks expect a further 25-basis-point hike to 4.6% by year-end. Last week, the AUD/USD pair rallied to near 0.7237, briefly testing resistance at the 0.7200 psychological level. Subsequently, the divergence between bulls and bears widened; strong US PPI data drove a rebound in the US dollar, causing the exchange rate to retreat from its highs. It fell sharply before the weekend, hitting a low of 0.7150. The week's price action—characterized by an initial surge followed by a pullback and a shift from high-level oscillation to weakness—was typical of bullish profit-taking. Early in the week, the price remained above the 50-day moving average (0.7066), but after the rally and subsequent retreat, short-term moving averages began to turn downward, exerting pressure on the price. The RSI retreated from around 66 to the 55 range; bullish momentum clearly waned, and a bearish divergence signal appeared at the highs, indicating weakening upward drive. Key takeaway from last week: the broader rebound structure remains intact, but short-term bullish momentum has exhausted, leading to a phase of range-bound correction and intensified tug-of-war between bulls and bears.
Outlook for next week: The primary expectation is for range-bound trading with a bearish bias; the validity of the 0.7130 support level is crucial. If this level holds, the pair will likely continue trading within a wide range; a decisive break below it would open the door for a deeper correction. Strong resistance lies at 0.7200 and 0.7230; a new leg of the rally is unlikely until the price firmly establishes itself above these levels. On the daily chart, AUD/USD is trading near 0.7160–0.7170; a constructive bullish tone remains as long as the spot price holds above the 50-day simple moving average (0.7066). A cluster of potential demand zones lies just below the current price, supported by a strong RSI (14) reading near 68, which is approaching overbought territory. On the upside, initial resistance is seen at 0.7200 (psychological level), followed by 0.7264 (May 14 high) and the nearby 0.7300 level (psychological resistance). On the downside, immediate support appears at 0.7112 (34-day simple moving average), with the 0.7100 level (a round number) acting as nearby support; deeper support lies near the 50-day simple moving average at 0.7066.
Consider going long on the AUD at 0.7160 today; stop-loss: 0.7150; targets: 0.7220, 0.7210.
GBP/USD
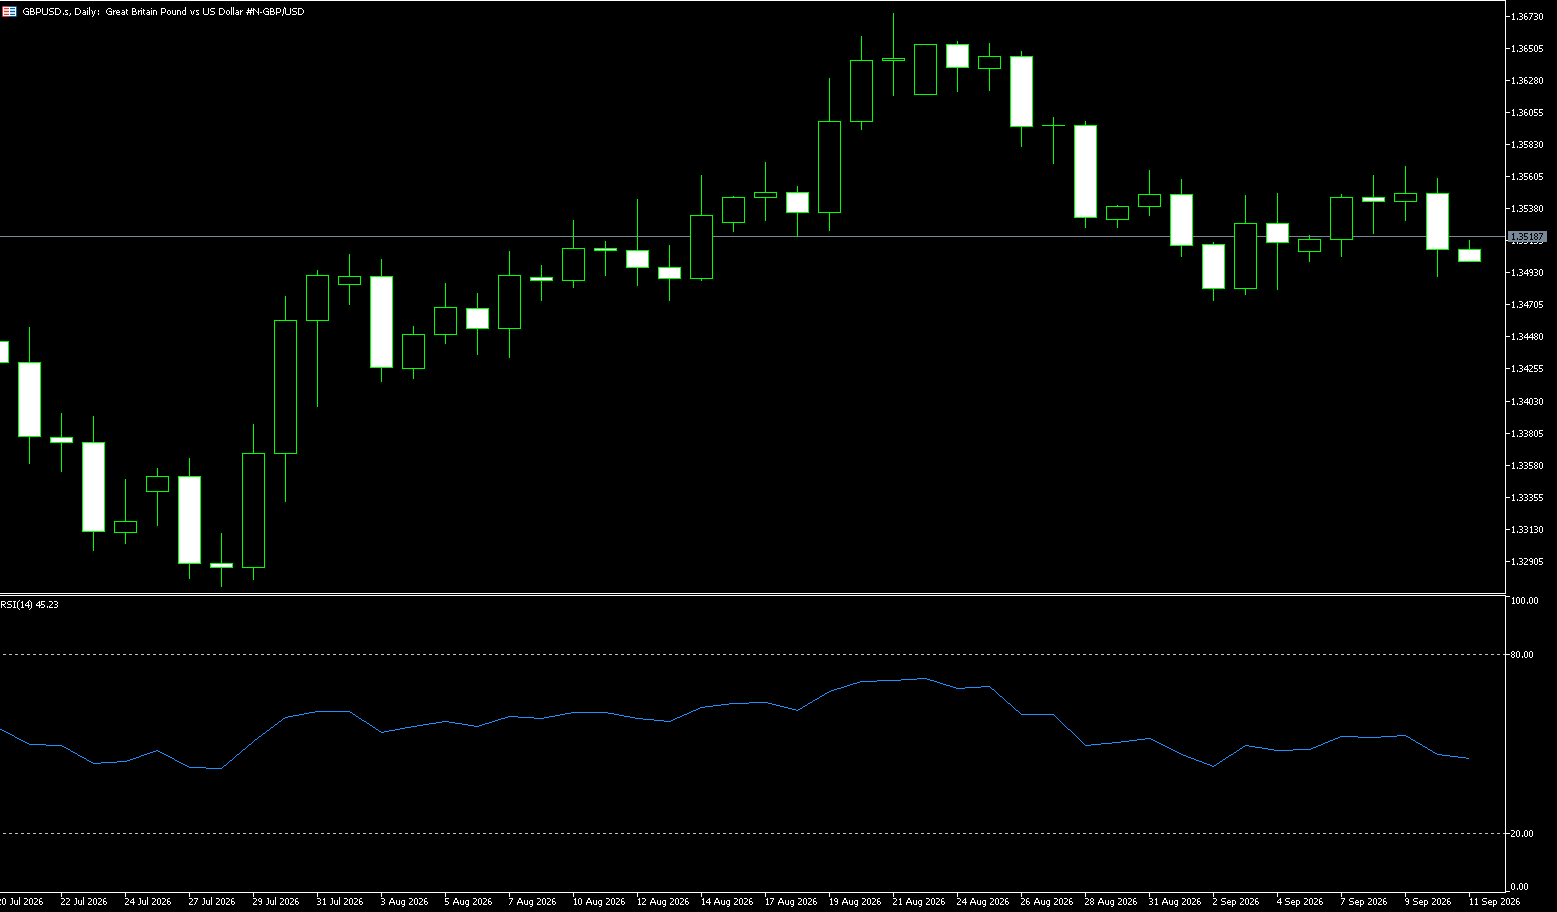
Sterling rose slightly last week to just above $1.3500 as investors digested stronger-than-expected UK GDP data and expectations of further interest rate hikes by the Bank of England. UK GDP grew by 0.4% month-on-month in July, exceeding forecasts, with the services sector driving the expansion. Three-month growth remained steady at 0.4%, matching the previous period. Meanwhile, the recent surge in energy prices has paused; however, Brent crude remains near four-month highs and UK natural gas prices hover near three-and-a-half-year highs, fueling concerns about a resurgence in inflationary pressure. Markets currently fully price in four rate hikes by the Bank of England through the end of 2027, although Governor Bailey recently noted that future decisions depend on economic and geopolitical conditions.
Despite strong UK GDP data and the pound's resilience, UK Gilt movements have been driven primarily by external factors rather than domestic fiscal concerns. Markets maintain the view that the Bank of England will not hike rates further and warn of potential dovish repricing, targeting a rise in EUR/GBP and a decline in GBP/USD in the fourth quarter. Meanwhile, the US dollar traded flat ahead of the key US Consumer Price Index (CPI) report. Stronger-than-expected US Producer Price Index (PPI) data released on Thursday boosted market expectations for a Federal Reserve rate hike next week. Last week, the GBP/USD pair traded within a range, reflecting a neutral yet cautious sentiment, with a core trading band of 1.3470–1.3560. Early in the week, the US dollar remained strong due to the lingering impact of the Non-Farm Payrolls data; consequently, GBP/USD faced slight downward pressure, testing the key Fibonacci support level at 1.3470. Buying interest at this level proved effective, preventing a decisive breakdown. Towards the end of the week, the pair tested the upper resistance zone of 1.3560–1.3570 but failed to hold above it after multiple attempts, establishing this area as a strong short-term supply zone. US inflation data caused volatility, leading the exchange rate to spike and then retreat, ultimately closing near the midpoint of the range. Summary of last week's structure: On the daily chart, medium-term moving averages continued to provide support, and the broader structure remained intact; however, short-term bullish momentum waned, shifting the trend from a gradual upward drift to range-bound consolidation. The week was characterized by oscillation while awaiting data confirmation; rebounds faced repeated resistance, bullish momentum weakened, and the tug-of-war between bulls and bears intensified, preventing a breakout into a clear trend.
Analysis of the technical outlook for the coming week: From a technical perspective, GBP/USD is currently trading below the 200-period simple moving average (SMA) at 1.3517 on the 4-hour chart, giving the short-term outlook a slightly bearish bias, despite the spot price hovering near recent highs. The 38.2% Fibonacci retracement level of the latest swing—located at 1.3522—reinforces the resistance zone in this area. Meanwhile, the Relative Strength Index (RSI) sits near 50, and the MACD histogram is slightly negative, suggesting that upward momentum is fading rather than accelerating. Immediate resistance is concentrated between the 200-period SMA at 1.3517 and the 38.2% Fibonacci retracement level at 1.3522; should buyers regain control, the 23.6% retracement level at 1.3580 and the 1.3600 psychological level would present the next hurdles. On the downside, initial support lies at the 50.0% Fibonacci retracement level near 1.3475, followed by the 61.8% level at 1.3428; a further decline could see a test of the 1.3400 psychological level.
Consider going long on GBP at 1.3510 today; Stop-loss: 1.3500; Targets: 1.3550, 1.3560.
USD/JPY
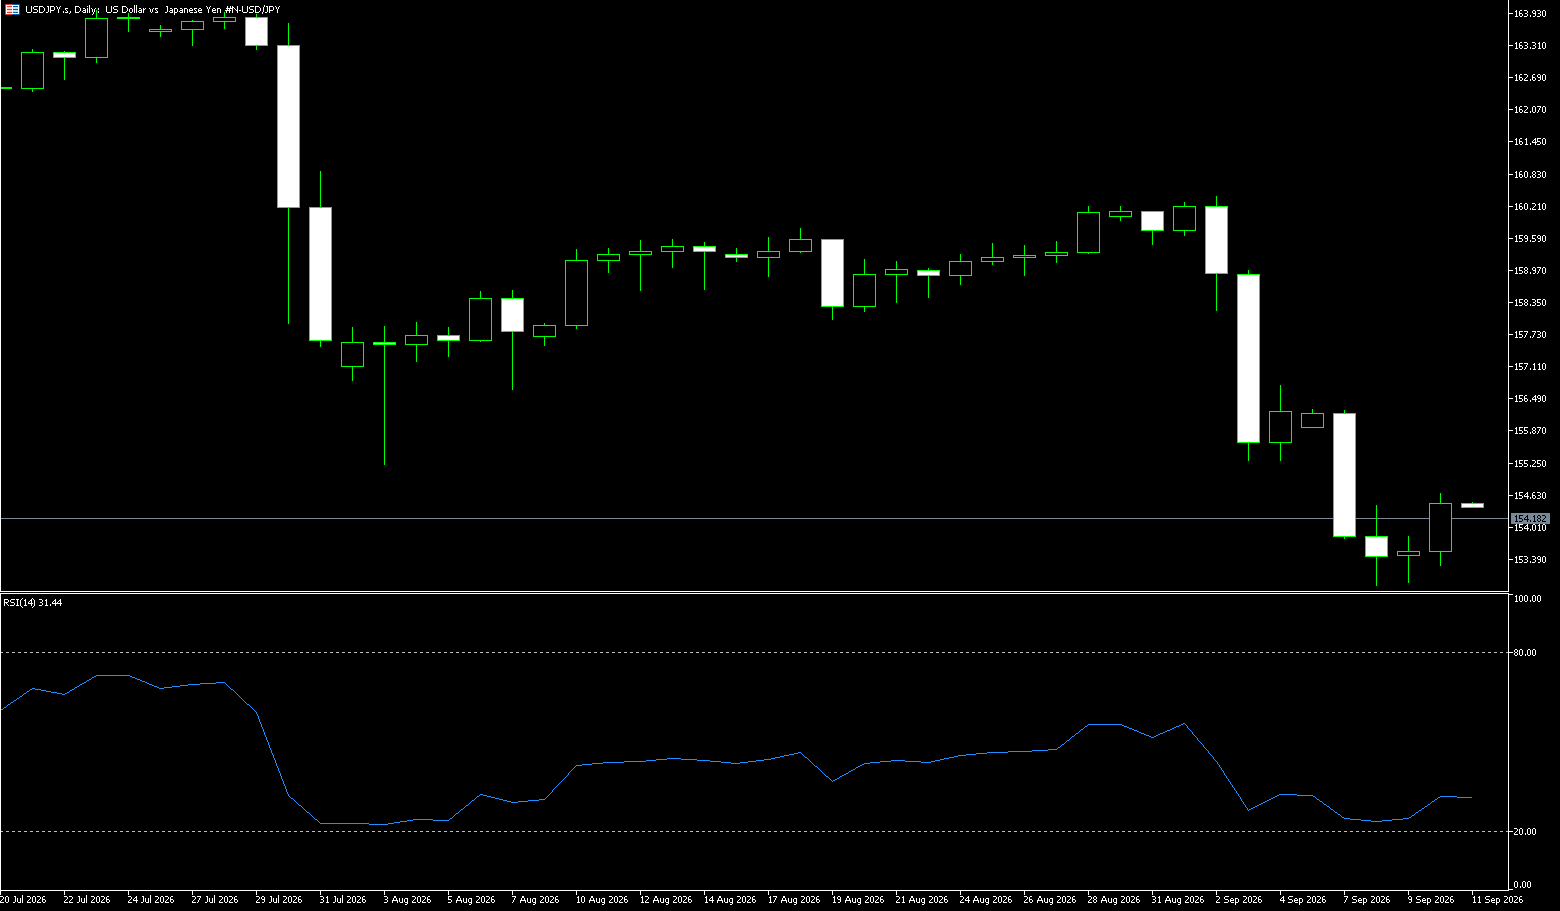
The yen strengthened past the 154-per-dollar mark late last week, reaching a near seven-month high, as data showed US producer inflation accelerating in August, fueling expectations of a Federal Reserve rate hike next week. The yen also faced pressure from surging oil prices and persistent inflation risks, with no signs of de-escalation in the conflict involving the US and Iran. Meanwhile, data showed Japan's producer inflation climbed 7.6% in August, further reinforcing expectations of a Bank of Japan rate hike this month. Sentiment among large manufacturers also improved significantly in the third quarter, hitting its highest level since Q4 2021, bolstered by robust government support measures. Nevertheless, the yen has risen more than 3% so far this month, supported by expectations of more aggressive policy tightening by the Bank of Japan, the unwinding of carry trades, and increased capital repatriation.
Historically, sharp drops of 10% or more in the USD/JPY exchange rate over the short term are not uncommon. However, the key lies in whether such moves are driven by domestic Japanese factors or triggered by external factors—the latter would have broader spillover effects on other markets. The yen's appreciation to date has been driven primarily by domestic factors, allowing emerging markets and carry trades to remain resilient. Historical experience suggests that domestically driven appreciation is usually more manageable, whereas sharp moves triggered by external shocks often coincide with synchronized corrections in global risk assets. Last week saw a sharp collapse from highs followed by intense volatility; the pair opened at 155.90, dipped to a low of 152.89 (a seven-month low), and subsequently staged a technical rebound from oversold levels to close within the 153–154 range. Drivers of the decline included rising expectations of a Bank of Japan rate hike, a pullback in US Treasury yields, and a wave of carry trade unwinding, with stop-loss orders exacerbating the drop. The price broke decisively below both the 20-day and 50-day moving averages, invalidating the previous bullish trend; the MACD formed a bearish cross at high levels with expanding green bars, and the RSI entered oversold territory, indicating a concentrated release of downward momentum—though no clear reversal candlestick pattern has yet emerged. The former support level at 155.30 was decisively broken and has now turned into strong resistance, with the price approaching the year-to-date low of 152.10.
On the daily chart, USD/JPY remains in a clearly bearish structure, trading consistently below the critical zone of 154.57 (7-day moving average) to 155.27 (last Friday's low). This area, previously a key horizontal support and a pivot point between bulls and bears, has now transformed into significant overhead resistance. Unless the price can reclaim the 154.57–155.27 range, the recent downward trend remains intact. In the short term, the 153.00 psychological level and the 152.89 low from early last week serve as the most critical psychological support levels. A decisive break below this support zone, followed by sustained trading beneath it, would signal a new leg of the decline, potentially leading the price to test support near 152.50 or even 152.00.
Consider shorting the US dollar at 153.80 today; stop-loss: 154.00; targets: 153.00, 152.50.
EUR/USD
The EUR/USD exchange rate fell to $1.16 after the European Central Bank (ECB) raised interest rates as expected and revised up its inflation and growth forecasts, while the US dollar strengthened due to rising oil prices and US Producer Price Index (PPI) data. The ECB implemented its second rate hike since the start of the US-Iran conflict, warning that inflation could remain well above its 2% target for an extended period. The central bank maintained its 2026 inflation forecast at 3.0% but raised its projections for 2027 and 2028 to 2.5% and 2.1%, respectively. GDP growth forecasts were also raised to 0.9% for 2026 and 1.4% for 2027. Resurgent energy price pressures are weighing on the inflation outlook; Brent crude oil prices reached $105 per barrel, and European natural gas prices hit a three-and-a-half-year high amid escalating tensions in the Middle East.
Markets now anticipate another rate hike by the ECB in December and further policy tightening in 2027. Meanwhile, the US dollar remains supported following a stronger-than-expected US PPI reading, pushing the implied probability of a Federal Reserve rate hike above 70%. Meanwhile, although the European Central Bank (ECB) raised policy rates by 25 basis points in its Thursday statement and President Christine Lagarde warned that price pressures remain elevated, the Euro has struggled to attract buyers; market experts still anticipate the possibility of one more rate hike this year.
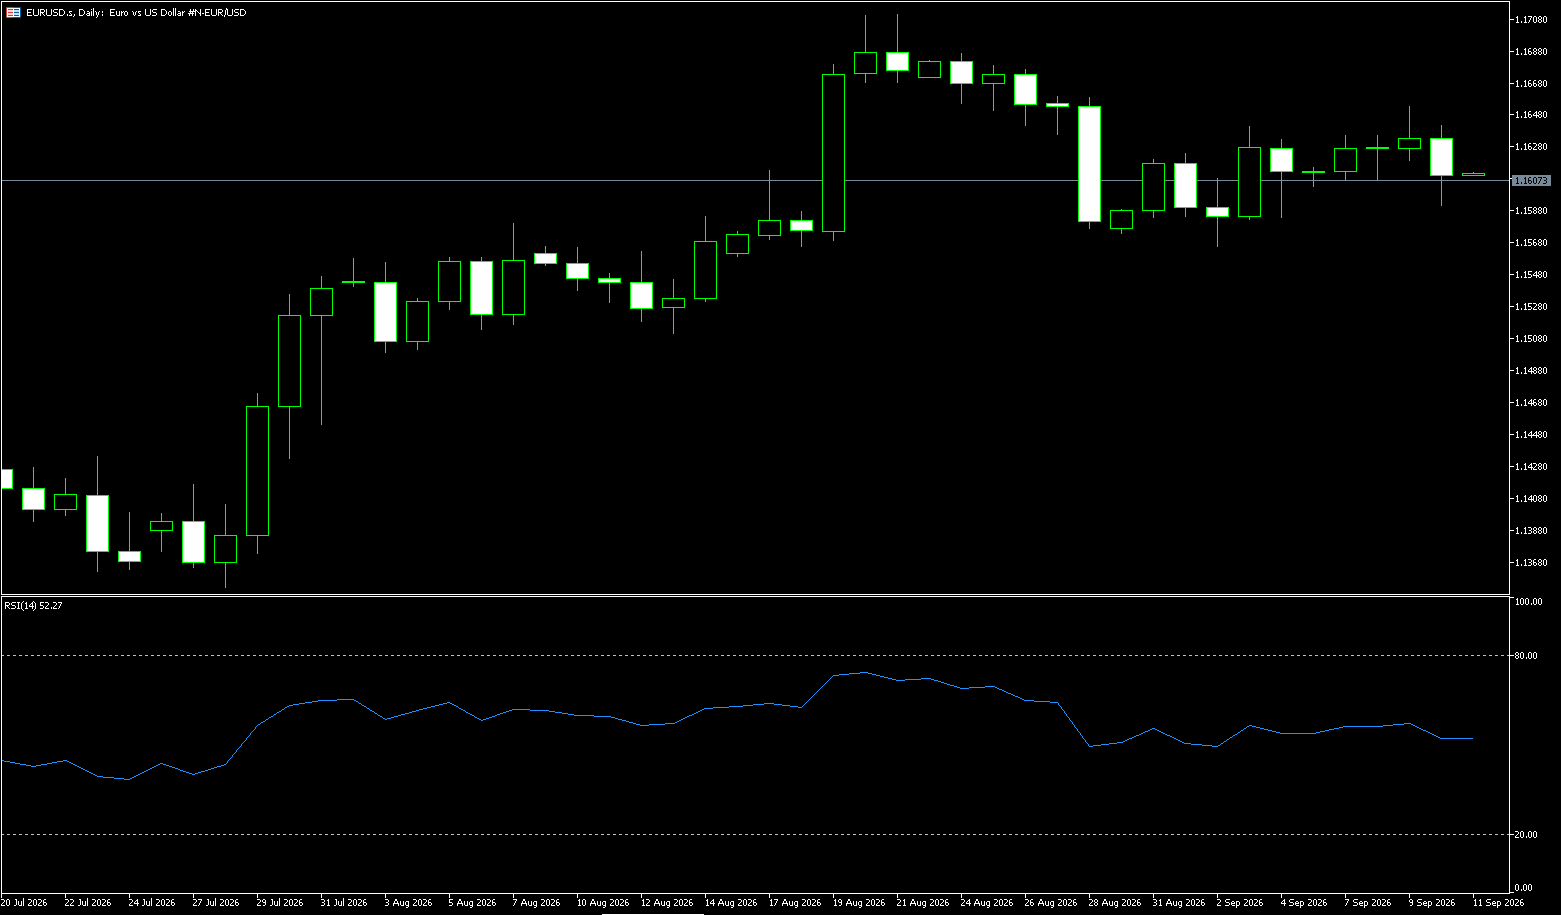
Last week's market characteristics: Trading fluctuated within a high-level range. Following the actual rate hike, the "buy the rumor, sell the fact" dynamic played out, intensifying the battle between bulls and bears and preventing a clear directional trend. The weekly trading range was 1.1580–1.1690. While the ECB raised rates to 2.50% on Thursday, Lagarde’s guidance was neutral, offering no commitment to continued future hikes; consequently, the Euro failed to sustain its rally and pulled back to close near 1.1620. Daily chart structure: The pair remained within a range-bound pattern with a slight bullish bias, though short-term upward momentum has waned. MACD histograms above the zero line are contracting, and the RSI holds in the neutral 50 zone, indicating a balance between bullish and bearish forces with no clear directional trend. Key logic from last week: ECB rate hike expectations were already priced in, making the actual hike a "sell the fact" event. Market focus shifted to US inflation data and expectations for the Federal Reserve's September meeting; fluctuations in US Treasury yields impacted the US Dollar, capping the Euro's upside potential. Weak manufacturing in the Eurozone and rising oil prices further limited the scope for Euro bulls, resulting in a market defined by two-way tug-of-war dynamics.
Analysis of technical trends for the coming week: On the daily chart, EUR/USD is trading around the 1.1600 psychological level. The pair is hovering near the 30-day exponential moving average (EMA) at 1.1597, suggesting a sideways trend. The 14-day Relative Strength Index (RSI) is oscillating between 50.00 and 55.00, further indicating a contraction in volatility. To the upside, immediate resistance for the pair lies near the recent 10-day range high of 1.1641, followed by the August high of 1.1711. On the downside, the recent support level lies near 1.1566, the low of the past ten days; below that, the psychological mark of 1.1500 serves as a key support zone. A sustained break below this area would be required to undermine the current constructive tone and pave the way for a deeper pullback.
Consider going long on the Euro at 1.1588 today; stop-loss: 1.1575; targets: 1.1640, 1.1650.
Stock Analysis:
Australia ASX 200 Stock Index
Market Overview:
The Australian ASX 200 index fell 78 points, or 0.9%, closing at 8,741 on Friday—its lowest level in seven weeks. The benchmark index declined for the fourth consecutive session, marking its worst week in six months with a 3.0% drop. Market sentiment weakened due to surging crude oil prices, casting doubt on expectations for a rapid easing of Australian inflation. Reserve Bank of Australia (RBA) Deputy Governor Hauser indicated that further rate hikes would be discussed at the September meeting, while Assistant Governor Hunter warned of limited tolerance for heightened cost pressures. The country's 10-year government bond yield surged above 5.3%—the highest level since May 2011—tracking the rise in US Treasury yields and reinforcing expectations for tighter borrowing conditions.
Broad-based declines were seen across sectors, with healthcare, non-energy minerals, technology, and consumer goods stocks leading the losses. Major mining companies saw significant drops: BHP fell 4.3%, Rio Tinto 3.7%, and Fortescue 2.4%. South32 (-4.4%), Northern Star Resources (-2.3%), and Evolution Mining (-2.0%) also underperformed. In contrast, the "Big Four" banks posted gains ranging from 0.6% to 2.5%.
Sector Performance:
Top Performers: Defensive sectors such as utilities and consumer staples showed relative resilience; the energy sector strengthened slightly, supported by resilient oil prices, which helped offset some of the broader market decline.
Worst Performers: Materials (mining) and technology sectors led the losses; volatility in global metal prices and a pullback in US tech stocks spilled over into the Australian market. The banking and financial sector faced pressure, as market expectations for delayed RBA rate cuts weighed on financial stock valuations.
Technical Analysis:
Last week, the ASX 200 experienced a volatile pullback; short-term bullish momentum has clearly waned. While the medium-term trend remains neutral-to-bullish, the index has entered a critical testing zone. Last week, the index fell below the 20-day EMA (near 9043) and subsequently broke through the 50-day EMA (8992); however, the price currently remains above the 200-day EMA (8829). The RSI(14) has retreated to around 39, entering a weak zone, though it has not yet reached oversold territory (<30); this indicates bearish dominance without extreme selling pressure, suggesting the potential for continued choppy oscillation or a weak rebound in the short term—avoid "bottom fishing" at this stage. Candlestick pattern: The weekly close was bearish, with highs gradually shifting lower; this reflects a pullback structure from a high level rather than a one-sided crash. Intraday trading saw multiple tests of the 8930–8950 support zone, which served as the focal point of the battle between bulls and bears this week.
Technical outlook for next week: Oscillating with a bearish bias; key range is 8830–9040. Await a breakout in direction; expect repeated testing of lows, with any rebound likely serving as a corrective move. Upside scenario (lower probability): If the price holds above 8950 at the open, a rebound to test 9040 is possible. A decisive break above 9040 on high volume is required to restore a bullish-leaning oscillation pattern, targeting 9080–9100. If the rebound stalls near 9040 and retreats, it indicates weakness, pointing to a likely secondary test of the lows. Downside scenario (base case): If the 8930–8950 support level is broken on a daily closing basis during the week, the price will likely test 8830 (200-day EMA). Critical note: A weekly close below 8830 would signal a shift to a bearish medium-term trend, opening the door for a deeper pullback; if 8830 holds, the market will likely enter a period of sideways consolidation to build a base. Indicator outlook: RSI is expected to oscillate between 35 and 45; a rebound opportunity from oversold conditions would likely only emerge if the price drops further and the RSI approaches 30. MACD daily chart shows a risk of a continuing "death cross" and expanding bearish (green) histogram bars. Trading Strategy (Short-term Perspective)
Trading Strategy (Short-term 3–5 day horizon; approach for Futures/Index CFDs)
Long Strategy (Confirmation-based only; do not attempt to "bottom-fish" or guess the low)
1. Conditions: Price reclaims 8950 + intraday volume expansion + RSI recovers to > 45;
2. Entry: Test long positions on a pullback to the 8940 area;
3. Take Profit: 9030–9040; add to position upon breakout, targeting 9080;
4. Stop Loss: Below 8900; abandon the long strategy if this level breaks.
Short Strategy (Baseline Approach)
1. Entry: Test short positions if the price faces resistance in the 9020–9040 range and RSI fails to rise above 50;
2. First Target: 8930;
3. Second Target: 8830;
4. Stop Loss: Above 9060; exit short positions if the price breaks above the 20-period EMA.
Key Risk Warnings:
1. Internal Macro Risks: Australian inflation data and RBA official commentary. If inflation rebounds, rate-cut expectations will be further delayed, continuing to pressure the financial and real estate sectors and dragging down the ASX200; conversely, a decline in inflation could trigger a rebound.
2. External Correlation Risks: US equities (especially Nasdaq), the US Dollar Index, and copper/iron ore prices. Resource stocks carry significant weight in the ASX200; commodity price volatility can directly cause significant overnight gaps in the index, and AUD exchange rate fluctuations impact mining sector earnings forecasts.
3. Technical Breakdown Risk: If the weekly close falls below 8830 (200-period EMA), the medium-term trend weakens and downside potential expands; do not attempt to "bottom-fish" with heavy positions against the trend.
4. Trading Risks: Index futures and CFDs involve leverage and carry high overnight gap risk. Significant time zone differences between the Australian market and the domestic market mean overnight positions are prone to large losses upon market opening; manage position sizes carefully and avoid holding heavy positions overnight.
Dow Jones Industrial Average
Market Overview:
U.S. stocks rebounded strongly on Friday (September 11), snapping a four-day losing streak. Crude oil prices retreated significantly from their weekly highs, easing investor concerns about a sustained surge in energy costs. Meanwhile, the market largely absorbed the pressure of potential rate hikes signaled by the latest inflation data; expectations that the Federal Reserve would further tighten monetary policy next week failed to prevent a rally in risk assets.
The Dow Jones Industrial Average rose 509.19 points (0.98%) to close at 52,573.29; the S&P 500 gained 0.86% to 7,656.98; and the Nasdaq Composite climbed 0.96% to 26,333.04.
Prior to this, the three major indices had fallen for four consecutive sessions, with the Dow marking its longest losing streak since late April. Despite Friday's notable rebound, U.S. stocks posted overall losses for the week. The Dow fell 1.6%, the S&P 500 dropped 0.8%, and the Nasdaq declined approximately 0.7%—marking the first weekly loss for the indices in three weeks. Reuters data shows that the S&P 500 is currently down about 2% from its all-time closing high set on August 13, though it remains up roughly 12% year-to-date.
Sector Performance:
Leading Sectors (Bullish Scenario: Rate hike implemented; signals released indicating no further hikes for the remainder of the year)
1. Energy (Chevron [CVX] is the sole representative in the Dow) – Drivers: Geopolitical conflict in the Middle East supports oil prices; the sector demonstrates resilient earnings amidst high inflation. If oil prices remain firm at high levels, CVX is poised to be the strongest component within the Dow.
2. Consumer Staples (Coca-Cola [KO], Procter & Gamble [PG], Walmart [WMT]) – A defensive sector offering stable cash flow and reliable dividends in a high-inflation environment; a top choice for capital seeking a safe haven during cycles of rising interest rates. 3. Financials (JPM, V, AXP, GS, TRV; the sector with the highest weighting in the Dow Jones): Rationale—If interest rate hikes are implemented and the "dot plot" indicates the terminal rate has peaked, bank net interest margins are expected to stabilize; payment stocks benefit from a "soft landing" scenario. Risk—If there are hints of continued rate hikes, the financial sector could quickly turn downward.
Sectors likely to lead declines (Bearish scenario: Dot plot raises the terminal rate, implying further hikes ahead):
1. Dow Jones Information Technology (AAPL, MSFT, GOOGL, NVDA, IBM, CSCO): High-valuation growth stocks that are highly sensitive to US Treasury yields; if the Fed leans hawkish, valuations come under pressure, making this the biggest drag on the Dow.
2. Healthcare (UNH, JNJ, MRK, AMGN): Persistent capital outflows; rising interest rates suppress healthcare valuations; the insurance segment faces pressure from rising medical costs, resulting in weak short-term upside potential.
3. Industrials (BA, CAT, HON, 3M): Cyclical sector; high interest rates dampen capital expenditure expectations; a hawkish Fed could lead to downward revisions in manufacturing orders, making the sector prone to underperforming the broader market.
Technical Analysis:
The market trended downward for most of last week, briefly breaking below the previous support zone of 52,200–52,400 (turning that support into short-term resistance). A strong rebound occurred before the weekend—rising 0.98% in a single day—which recovered some intraday losses and snapped a four-day losing streak; this represents a technical rebound following a sharp decline rather than a trend reversal. The daily RSI has retreated from highs into a neutral-to-weak range without yet reaching deep oversold territory. The MACD histogram is contracting and showing signs of a "death cross," indicating the release of bearish momentum, though Friday's rebound slightly tempered that selling pressure. Volume characteristics: High volume accompanied the decline, whereas Friday's rebound saw lower volume than the sell-off; this indicates a "low-volume recovery," casting doubt on the sustainability of the bullish move. Key Conclusion: Regarding the short-term pullback within a high-level bull market, Friday's rebound represents a technical retracement following a breakdown; until confirmed by trading volume, the pullback cannot yet be declared over.
Technical Outlook for Next Week: Bull-Bear Watershed: 53,000. Bullish Scenario (Oscillating Rebound): If the price stabilizes in the 52,800–53,000 range and rises above the 20-day moving average on increased volume, the current short-term pullback will likely pause, with upside targets at 53,600–54,000. Prerequisites: US Treasury yields retreat, and inflation data does not exceed expectations. Bearish Scenario (Secondary Test): Rebound lacks strength; failure to hold 52,800 leads to another decline. A decisive break below 51,600 confirms a deepening pullback, targeting the 51,000 area. Neutral Scenario (Most Likely; Range-bound): Price oscillates within the 51,600–53,000 box, repeatedly testing support and resistance levels. Following Friday's rebound, the battle between bulls and bears intensifies; awaiting guidance from Federal Reserve commentary.
Trading Strategy:
Operational Strategy (Short-term Perspective)
Short-term (Next Week) Strategy (Technical analysis only; does not constitute investment advice)
Suitable for a 3–5 day horizon; strictly control position sizes, prioritize light-position test trades, and avoid heavy-position bets.
1. Bullish Approach (Trend-following/Confirmation only): Do not attempt to "bottom fish" prematurely. Wait for stabilization after a retest of the 52,000–52,200 level, combined with an hourly RSI "golden cross" and a volume surge, before opening a small long position. Place stop-loss below 51,550; set first take-profit at 52,800 and second at 53,600. 2. Bearish Strategy (Shorting on resistance-capped rebounds): If the price rebounds to the 52,800–53,000 resistance zone and shows signs of stalling, pulling back, or closing with a bearish (red) candlestick, consider opening a small short position. Place the stop-loss above 53,150; set the first target at 52,000 and the second at 51,600.
3. Wait-and-See Strategy (Recommended): If the market moves sideways within a narrow 52,200–52,800 range after opening—without a clear breakout in volume and price—remain on the sidelines and do not enter the market. Choppy markets often trigger stop-losses on both sides; wait for a directional breakout before following the trend.
Key Risk Warnings:
1. Fundamental Event Risk: Next week's US CPI inflation data is a critical variable. Inflation exceeding expectations would drive up US Treasury yields, directly pressuring the Dow Jones Industrial Average (DJIA) and triggering a rapid decline; conversely, inflation coming in below expectations could spark a sharp rebound, potentially hitting stop-loss orders.
2. Technical Risk: Current conditions represent a corrective consolidation within a bull market; rebounds are corrective rather than a trend reversal. Low-volume rebounds are highly likely to act as "bull traps"; do not mistake a technical bounce for the start of a new rally.
3. Component Stock and Sector Risk: The Dow's 30 components are dominated by leaders in the financial, industrial, and consumer sectors. Fluctuations in US Treasury yields directly impact the banking sector, while rising oil prices affect industrial stocks, thereby amplifying index volatility.
4. Leverage Warning: Index futures and CFDs involve inherent leverage. During periods of high volatility, price gaps can lead to slippage and failure to execute stop-loss orders, creating a risk of liquidation (account wipeout).
Disclaimer: The information contained herein (1) is proprietary to BCR and/or its content providers; (2) may not be copied or distributed; (3) is not warranted to be accurate, complete or timely; and, (4) does not constitute advice or a recommendation by BCR or its content providers in respect of the investment in financial instruments. Neither BCR or its content providers are responsible for any damages or losses arising from any use of this information. Past performance is no guarantee of future results.
More Coverage



2026 © - All Rights Reserved by BCR Co Pty Ltd
Risk Disclosure:Derivatives are traded over-the-counter on margin, which means they carry a high level of risk and there is a possibility you could lose all of your investment. These products are not suitable for all investors. Please ensure you fully understand the risks and carefully consider your financial situation and trading experience before trading. Seek independent financial advice if necessary before opening an account with BCR.
BCR Co Pty Ltd (Company No. 1975046) is a company incorporated under the laws of the British Virgin Islands, with its registered office at Trident Chambers, Wickham’s Cay 1, Road Town, Tortola, British Virgin Islands, and is licensed and regulated by the British Virgin Islands Financial Services Commission under License No. SIBA/L/19/1122.
Open Bridge Limited (Company No. 16701394) is a company incorporated under the Companies Act 2006 and registered in England and Wales, with its registered address at Kemp House, 160 City Road, London, England, EC1V 2NX. Open Bridge Limited acts solely as a payment processor for BCR Co Pty Ltd and does not provide any financial, trading, or investment services on its behalf. Open Bridge Limited's role is limited to payment processing.


 English
 简体中文
简体中文
 繁體中文
繁體中文
 Bahasa
Melayu
Bahasa
Melayu
 Tiếng
Việt
Tiếng
Việt
 ไทย
ไทย
 日本語
日本語
 한국어
한국어
 ភាសាខ្មែរ
 español