


0
US Dollar Index
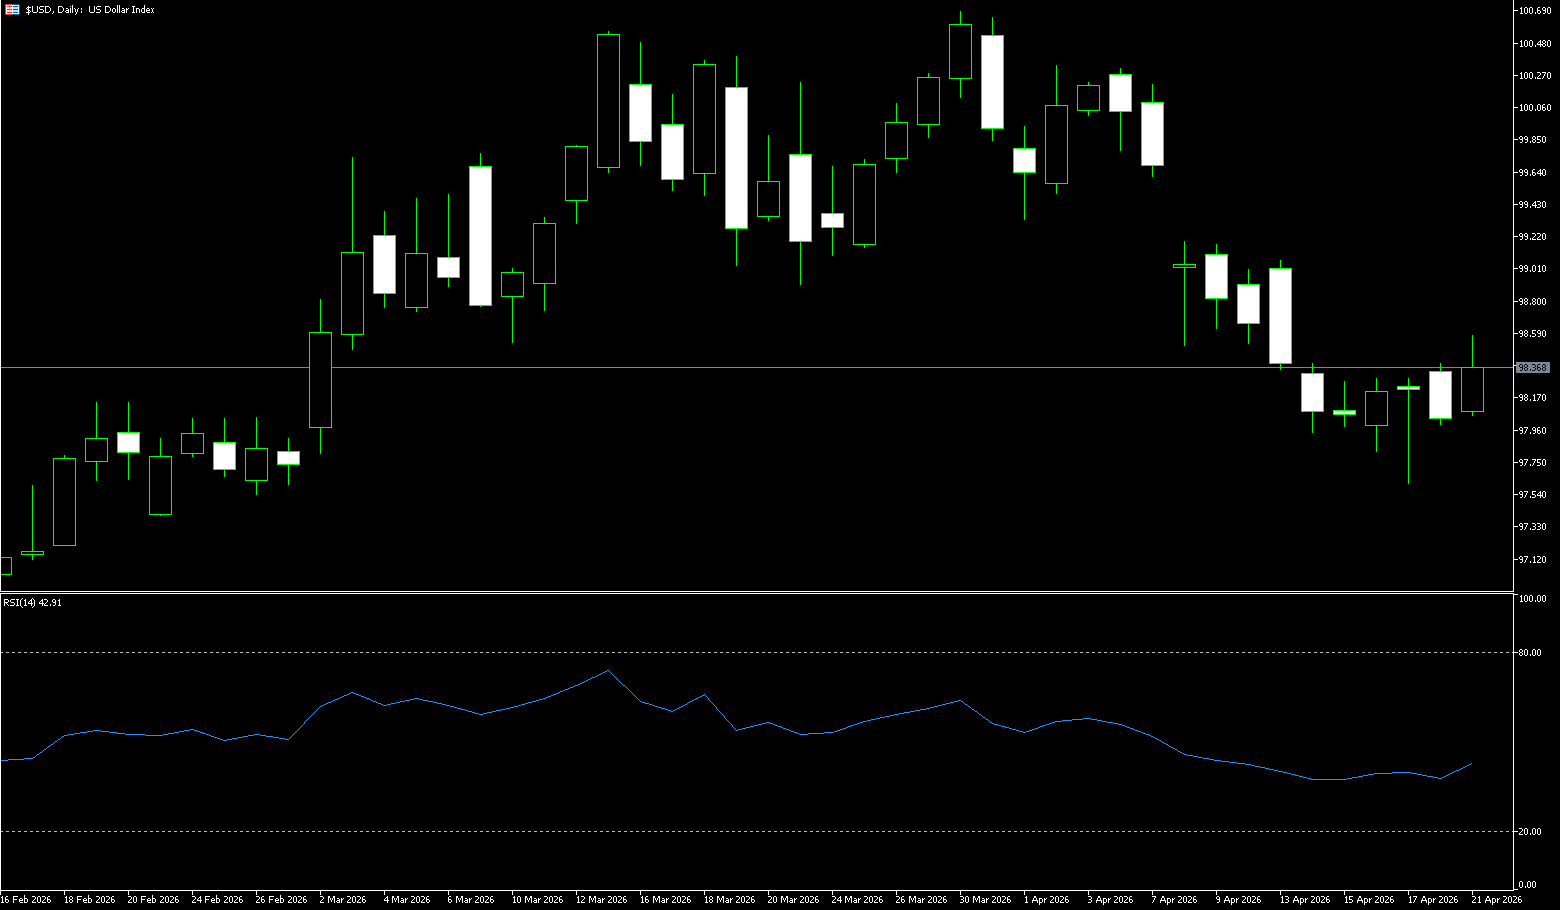
The US dollar index rose slightly to 98.35 on Tuesday, its highest level in nearly a week, as uncertainty in the Middle East prompted moderate safe-haven flows. It remains unclear whether Iran will hold a second round of talks with the US before Wednesday's ceasefire deadline, and the Strait of Hormuz remains largely closed. Meanwhile, high oil prices continue to exacerbate inflation concerns. In addition, investors are closely watching Kevin Warsh's Senate confirmation hearing as the next Federal Reserve Chairman. Warsh believes the Fed needs significant reforms to avoid repeating past mistakes of inflation, calling for institutional changes in policy implementation, including a new inflation framework. Besides using interest rates and the Fed's balance sheet to combat inflation, Warsh also emphasized the need for clearer and more effective communication from the Fed.
The US dollar index initially surged to its highest level in nearly a week earlier on Monday. However, the market is always unpredictable. As trading progressed, the dollar index failed to hold onto its gains, eventually giving back some and turning lower. The US dollar index retreated after hitting a five-day high of 98.35 and is expected to hold around 98.00. The RSI indicator remains around 40, indicating weakening short-term downward momentum and a need for correction. The MACD histogram shows a significant decrease in green bars, and the fast line shows signs of turning upwards, indicating weakening bearish pressure. On the upside, the 200-day simple moving average at 98.53 should be considered, followed by the 99.00 level (a psychological level). On the downside, the dollar may find technical support around 97.82 (last week's low) and the 98.00 psychological level, where it could rebound. A break above these levels would target the 97.50 level.
Today, consider shorting the US Dollar Index at 98.50, with a stop-loss at 98.60 and targets at 98.00 and 97.90.
WTI Crude Oil
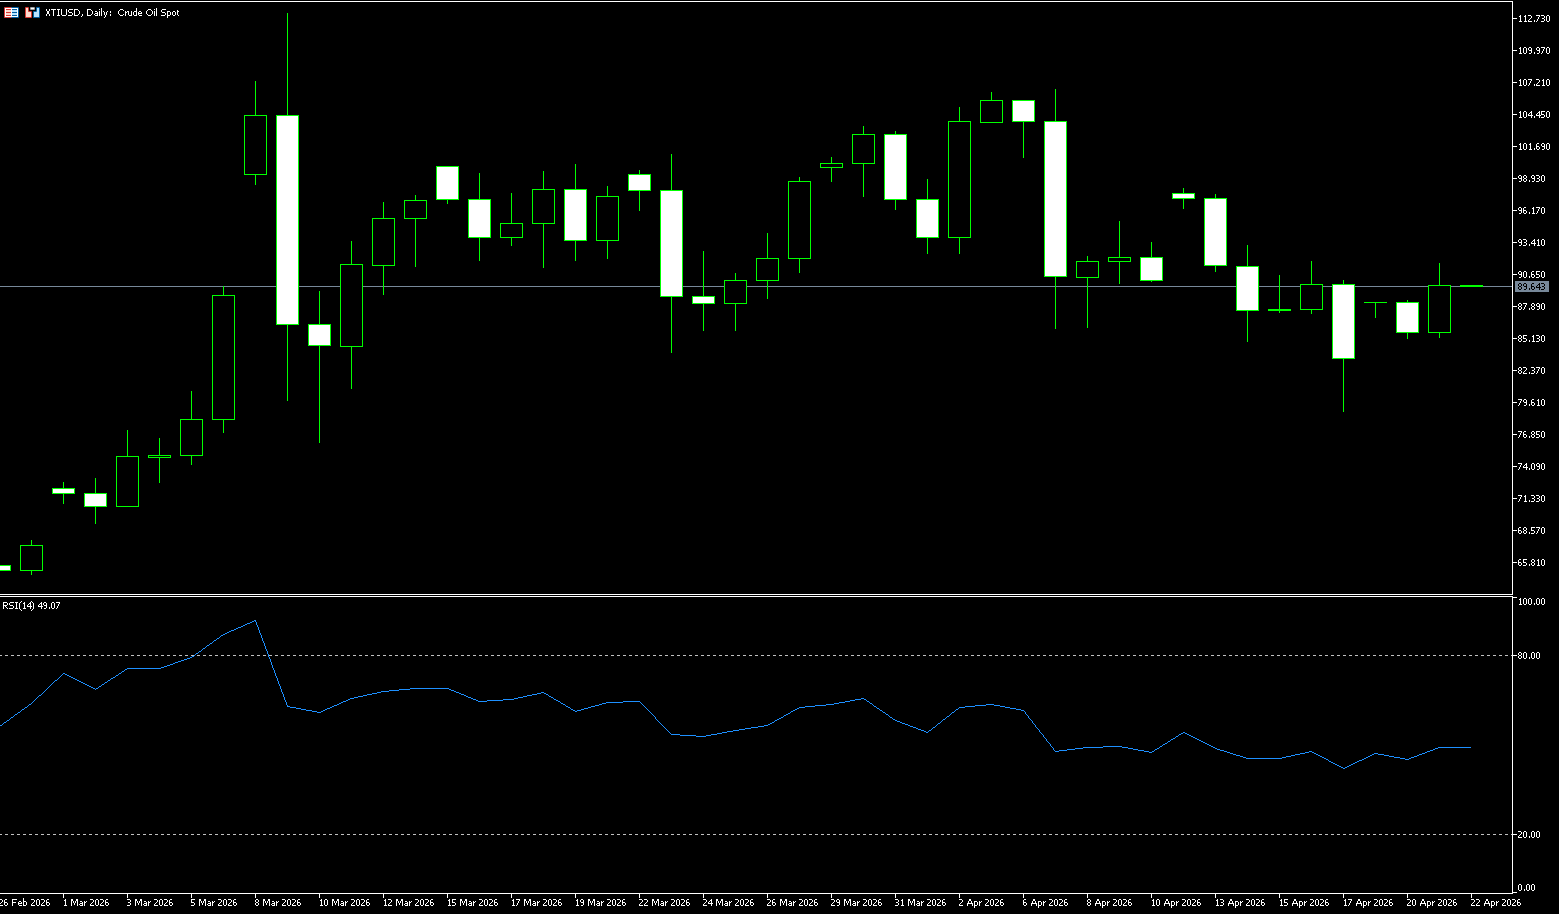
Oil prices fell on Tuesday, with US WTI crude oil dropping more than 1% to trade around $86.75 per barrel, after briefly touching $85.50 per barrel at the open. Oil prices surged on Monday, marking the largest single-day gain in nearly two weeks. Escalating tensions between the US and Iran directly pushed up risk premiums, with market concerns about shipping safety in the Strait of Hormuz, coupled with rising expectations of supply disruptions from some Middle Eastern oil-producing countries, significantly strengthening short-term bullish sentiment. From a fundamental perspective, the renewed tensions between the US and Iran are a key factor supporting oil prices. As the ceasefire deadline approaches, market concerns about further escalation intensify, and energy supply risks are being re-incorporated into the price system. Especially given the continued uncertainty surrounding key shipping routes, the Strait of Hormuz handles approximately 20% of global seaborne crude oil transport, and its passage directly impacts global supply stability. While diplomatic negotiations remain possible, significant differences in positions among the parties make a rapid easing of the situation unlikely in the short term. Meanwhile, market expectations for a supply recovery remain cautious.
Overall, the current crude oil market is in a phase of multiple factors at play, with price fluctuations driven more by expectations than by fundamental trends. Before the release of API data and further clarification of the geopolitical situation, the market is likely to maintain a volatile pattern. WTI crude oil is currently trading within a key range, reflecting the market's repeated balancing act between geopolitical risks and supply and demand expectations. On the one hand, the US-Iran tensions provide a floor for oil prices; on the other hand, inventory data and macroeconomic uncertainties limit upside potential. In the short term, oil prices are likely to remain range-bound, awaiting a new catalyst to break the equilibrium. Technically, the daily chart shows that oil prices have entered a consolidation phase after a surge and subsequent pullback, maintaining an overall volatile structure. $88.50 (the high at the beginning of the week) and the psychological level of $90 constitute key resistance levels; if the bulls cannot effectively break through these levels in the short term, upside potential will be limited. On the downside, $85 provides short-term support. A break below this level could lead to a further decline towards the key support area of $82.
Today, consider going long on crude oil at $86.70, with a stop-loss at $86.55 and targets at $89.00 and $88.00.
Spot Gold
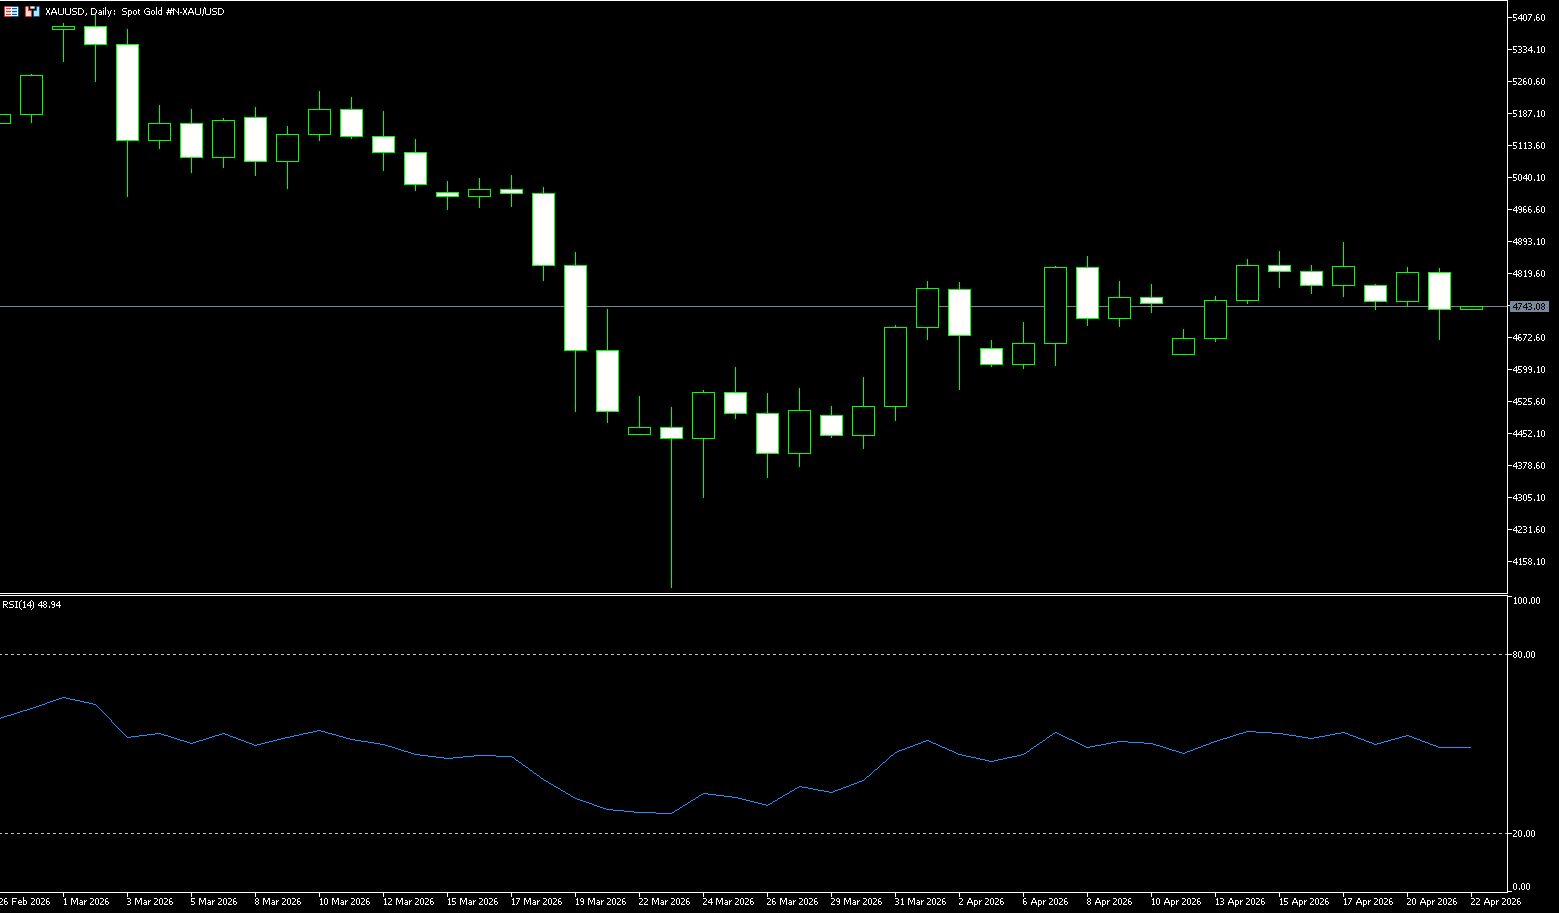
On Tuesday morning in Asian trading, spot gold rose slightly, trading around $4,726 per ounce, benefiting from a weaker dollar. Despite the approaching expiration of the two-week ceasefire agreement between the US and Iran, and the lack of clear progress on whether the second round of talks could be held before the ceasefire ends, the market remained generally optimistic. It is reported that US Vice President Vance's motorcade departed from the White House at 6:13 AM Beijing time on the 21st. In the current highly tense global financial markets, gold, as the most classic safe-haven asset, has never seen its price fluctuations so captivating. In the past week, spot gold staged a dramatic "V-shaped" reversal—falling to a one-week low before rebounding strongly. Behind this is not merely the fluctuation of numbers, but the result of a complex interplay of geopolitical storms, a shifting dollar trend, and dramatic volatility in the global energy market. On Tuesday (April 20th) in early Asian trading, spot gold traded in a narrow range, currently hovering around $4,726 per ounce.
The gold market is currently at a critical crossroads. The bears' logic is clear and direct: rising US Treasury yields increase the opportunity cost of holding gold, a non-interest-bearing asset. Escalating tensions in the Middle East could lead to a surge in oil prices, further pushing up the dollar and bond yields, which slightly tilts the outlook for gold prices downwards. Technically, the next upside target for gold bulls is a close above the strong resistance level of $5,000, while bears hope to establish a top at the current price level. However, the support from the bulls should not be underestimated. The real existence of geopolitical risks and the threat of a ceasefire agreement breaking at any time provide solid safe-haven demand support for gold. The current price fluctuation within the $4,700-$4,850 per ounce range indicates a short-term balance between bulls and bears. Support levels to watch are $4,668.50 (Monday's low); a break below this level could see a move towards $4,600.00 (a psychological level). Resistance levels are: first, at $4,850; if bulls regain momentum, the 50-day moving average around $4,889.50 could present new selling pressure.
Consider going long on spot gold today at $4,720, with a stop-loss at $4,715 and targets of $4,780 and $4,790.
AUD/USD
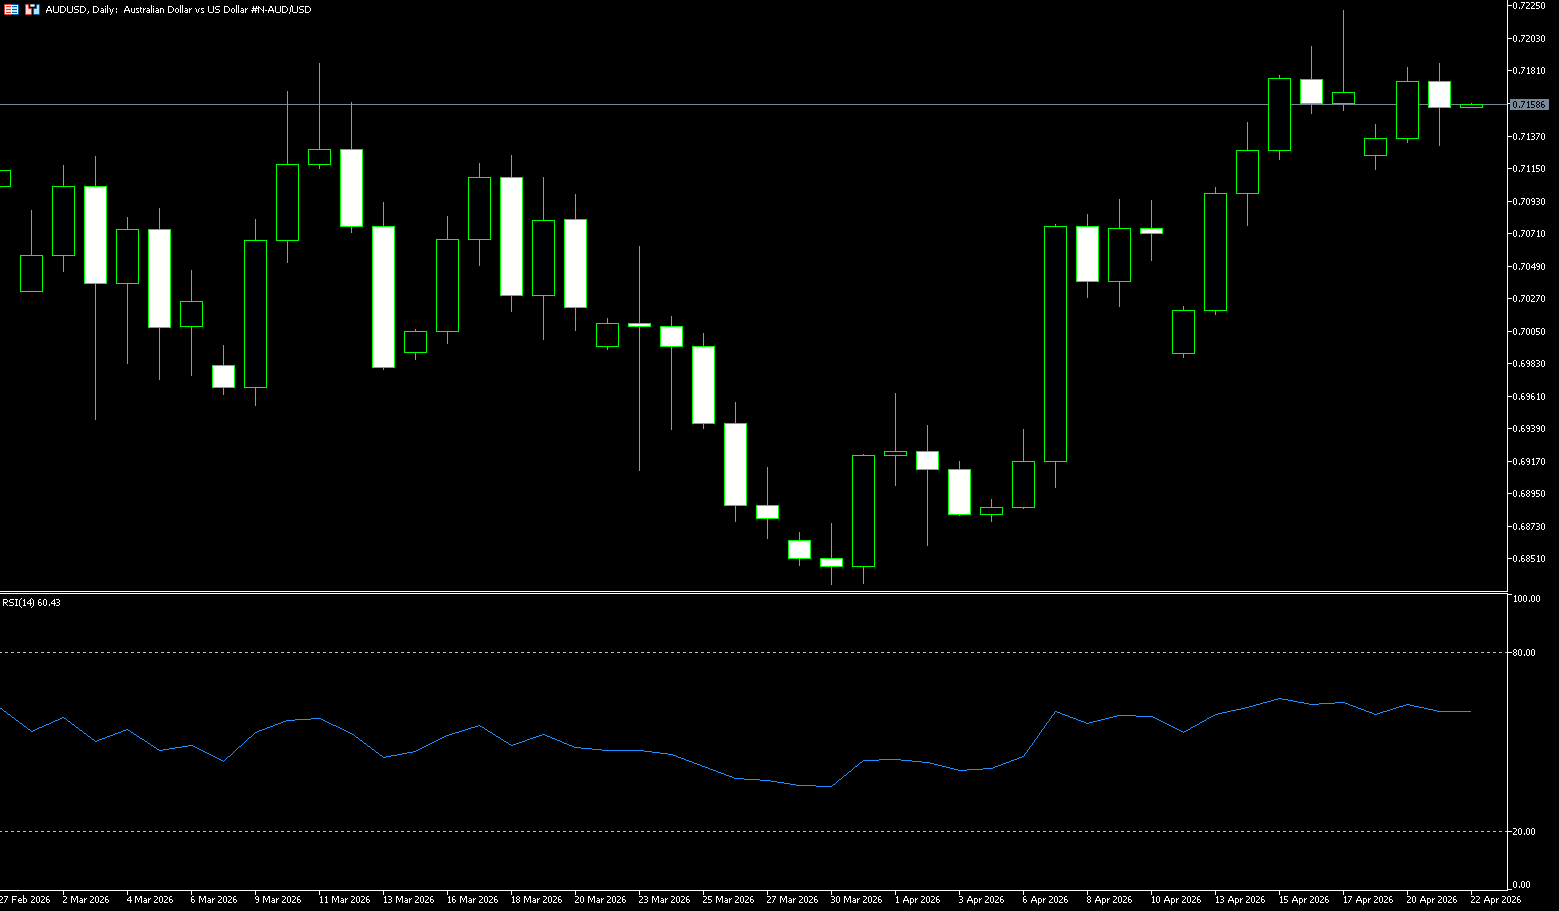
The Australian dollar is hovering around $0.7160, trading near a four-year high, as markets continue to focus on developments in the Middle East conflict. The ceasefire in the Iran war has come under renewed pressure after the US seized an Iranian cargo ship in the Gulf of Oman, prompting Tehran to threaten retaliation and reclaim control of the Strait of Hormuz. Markets are now focused on a second round of talks between the US and Iran as the current ceasefire nears its expiration. Iran is reportedly reconsidering its involvement, while President Trump has indicated he may not extend the ceasefire without a deal. The ongoing conflict has triggered a historic energy supply shock, fueling inflation risks and expectations of further central bank rate hikes. In Australia, a strong labor market has reinforced bets on tightening, with the market pricing in a 75% probability of a Reserve Bank rate hike next month. Investors are now awaiting the upcoming PMI report this week for further clues about the health of the economy.
On the daily chart, the Australian dollar is trading around 0.7160 against the US dollar, maintaining a short-term bullish bias as the spot price holds steady above the 55-day, 100-day, and 200-day simple moving averages between approximately 0.70 and 0.67. The pair is approaching a key upper resistance level at the Fibonacci swing high and around 0.7188, while the Relative Strength Index (RSI) (14) is at 63, indicating solid positive momentum approaching overbought territory, even though the Average Directional Index (14) is near 20, suggesting the overall trend strength remains moderate. On the upside, near-term resistance lies at the 0.7200 level; a daily close above this level would open the way to the resistance levels of 0.7283 (May 2022 high) and subsequently 0.7300. On the downside, initial support is seen near the psychological level of 0.7100, with further demand expected around 0.7047 (50-day simple moving average); a deeper pullback could extend to the psychological level of 0.7000.
Consider going long on the Australian dollar today at 0.7140, with a stop-loss at 0.7130 and targets at 0.7180 and 0.7190.
GBP/USD
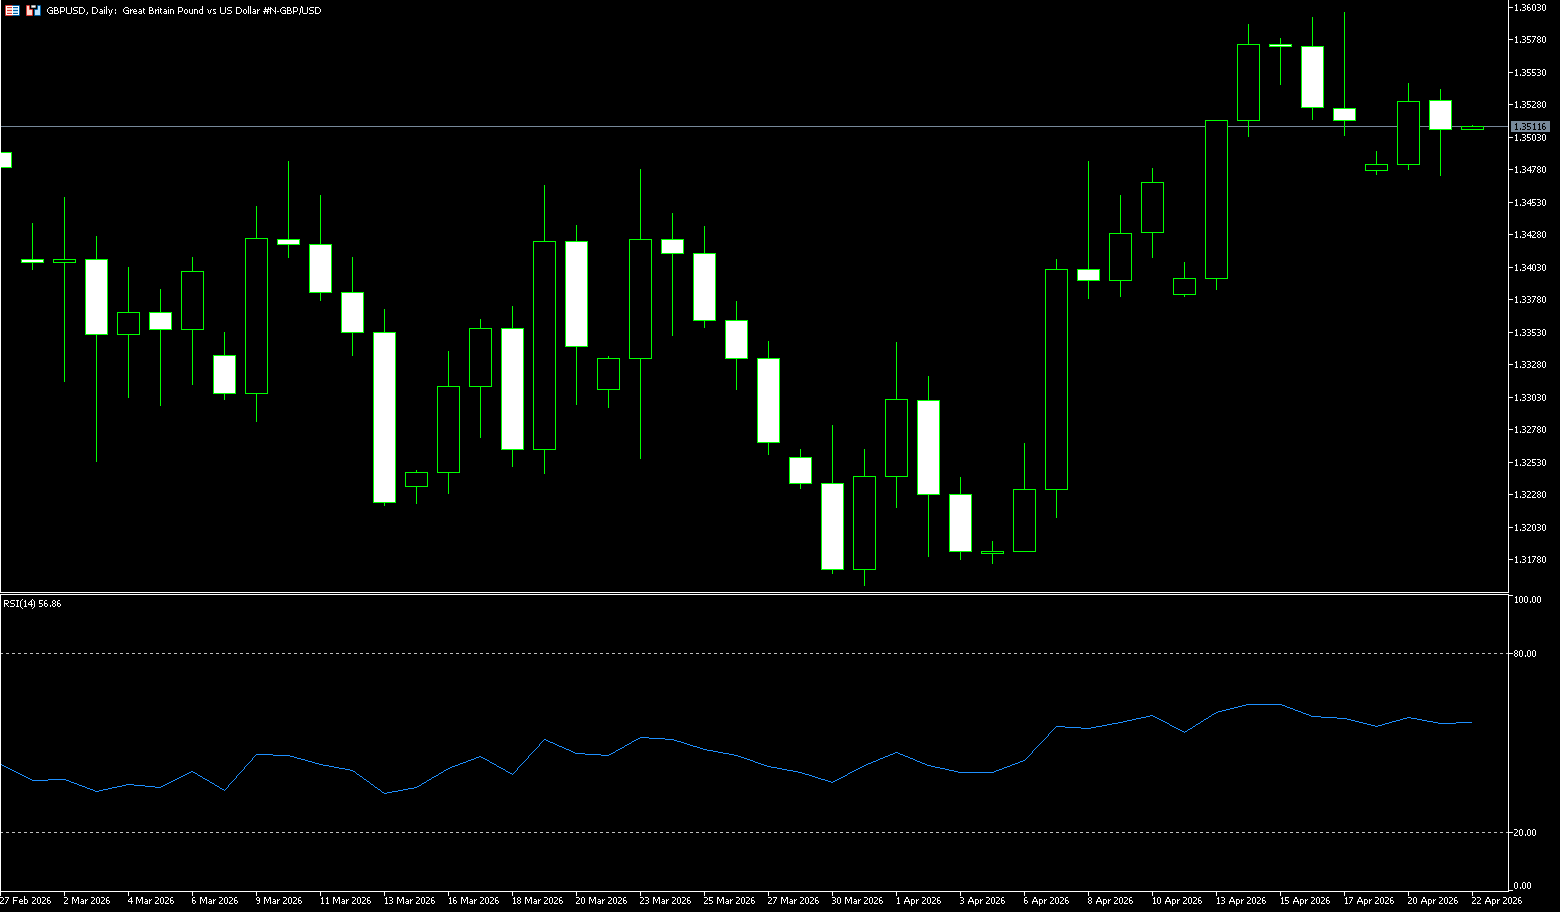
The pound found new buying support above 1.3500 in early European trading on Tuesday. The UK unemployment rate unexpectedly fell to 4.9% in the three months to February, better than the expected 5.2% and previously reported at 5.2%. This positive data boosted the pound with renewed buying support. Investors turned to safe-haven assets amid escalating tensions between the US and Iran. Oil and gas prices surged after the US Navy seized an Iranian vessel, and Tehran shelled ships and closed the Strait of Hormuz again, reversing earlier hopes of reopening. Brent and WTI futures rose about 6%, erasing most of Friday's losses. Traders increased their expectations for a Bank of England rate hike this year by about six basis points, although only one hike is fully priced in. Political uncertainty is also impacting market sentiment, with scrutiny intensifying over Prime Minister Keir Starmer's appointment of Peter Mandelson as US ambassador. Starmer is scheduled to speak to Parliament, and further testimony from officials involved in the review process is expected.
Overall, the current movement of the pound against the dollar is mainly influenced by two forces: on the one hand, geopolitical risks and a stronger dollar are pushing the exchange rate down; on the other hand, expectations for UK monetary policy are providing support for the pound. This interplay of bullish and bearish factors has resulted in a weak and volatile structure for the exchange rate. From a technical perspective, on the daily chart, the pound against the dollar showed signs of pullback after reaching a high of 1.3600, failing to continue its breakout, indicating increasing selling pressure above. The price has currently fallen back to around 1.3500, a key psychological support level. A decisive break below this level could lead to further declines towards 1.3438 (the 55-day moving average), or even lower than the 1.3400 level, shifting the overall trend from upward to consolidation. If the GBP/USD pair regains its footing above 1.3550, a technical rebound to the psychological level of 1.3600 is possible.
Today, consider going long on GBP at 1.3490, with a stop-loss at 1.3480 and targets at 1.3540 and 1.3550.
USD/JPY
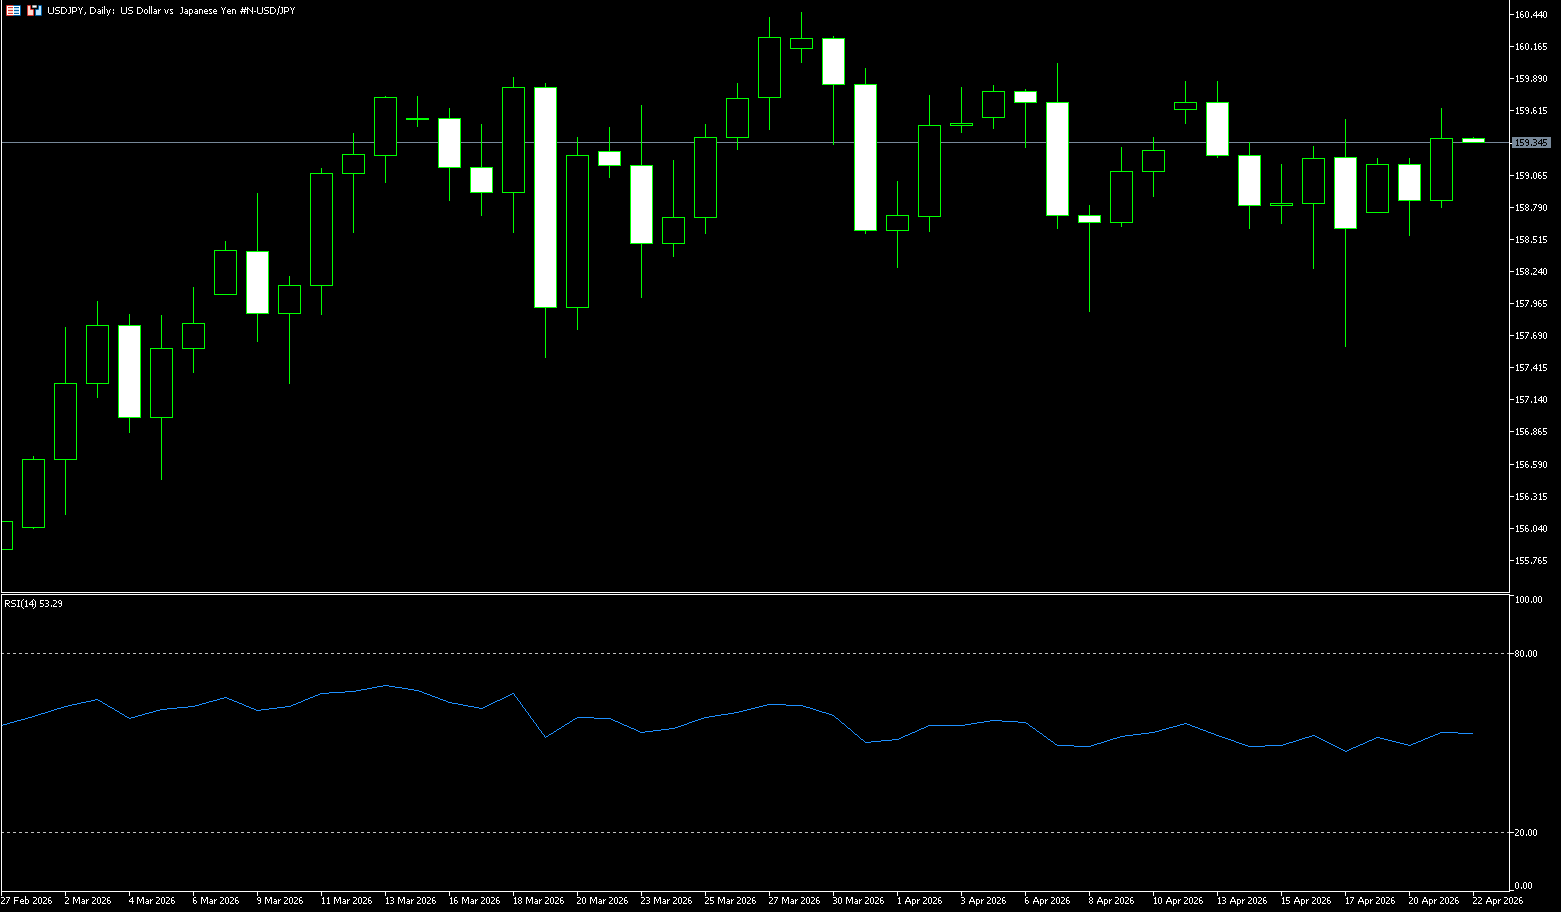
USD/JPY consolidated around 159.00 during Tuesday's late European session. The major currency pair is struggling to find direction as investors await confirmation hearings at 14:00 GMT for Kevin Warsh, the new Federal Reserve chairman nominated by US President Donald Trump. Investors will be closely watching Warsh's remarks to determine whether his decisions during his tenure will align with Washington's economic agenda or prioritize maintaining the Fed's independence. Since returning to the White House, President Trump has repeatedly criticized the Fed, particularly Chairman Jerome Powell, accusing him of failing to aggressively cut interest rates. Geopolitically, tensions between Iran and the US could escalate on Tuesday evening or Wednesday morning in the Islamic Republic of Iran. A new round of talks is underway in Fort Deutsche Bahn.
The daily chart shows USD/JPY trading sideways around 159.00. The price has been consolidating near the 10-day simple moving average (SMA) around 158.95 for a month, indicating a sideways trend. The 14-day Relative Strength Index (RSI) is around 50, suggesting that momentum has returned to a neutral state rather than showing a strong directional signal. On the upside, near-term resistance is at 159.24 (the 20-day SMA). A sustained break above this level would strengthen the pair's upward momentum, potentially pushing towards the psychological level of 160 and the March high of 160.46. Key support lies at 158.00 (the psychological level) and the 50-day SMA area around 157.67.
Consider shorting USD at 159.50 today, with a stop-loss at 159.70 and a target of 158.60. 158.70
EUR/USD
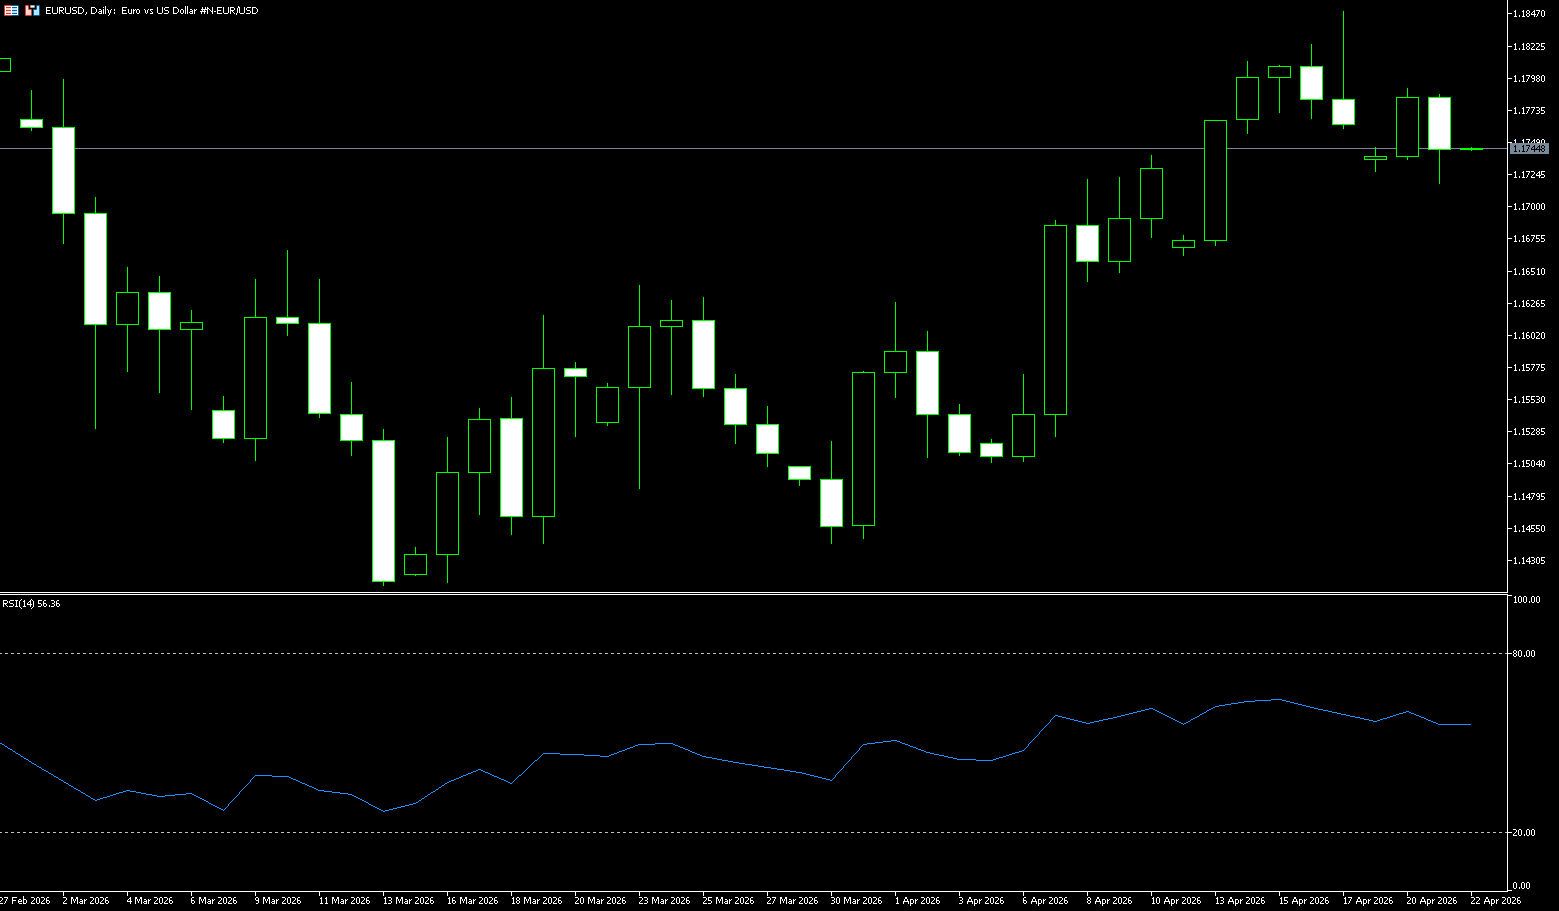
The euro/dollar pair traded sideways, hovering around $1.18, just slightly below pre-conflict levels reached last week, as the market priced in a new setback in US-Iran negotiations. Tensions escalated over the weekend when the US Navy fired on and boarded a cargo ship flying the Iranian flag. This reversal came quickly: on Friday, the Iranian foreign minister stated that the Strait of Hormuz would be fully open to commercial navigation during the 10-day ceasefire between Israel and Lebanon. Furthermore, it remains unclear whether US and Iranian officials will meet before Tuesday's 14-day ceasefire expires. Meanwhile, the European Central Bank will make a decision later this month, and this meeting is not expected to change borrowing costs. Instead, focus remains on the June meeting, although developments in the Middle East could alter the outlook. On Friday... The International Monetary Fund (IMF) stated that it expects the European Central Bank (ECB) to raise interest rates by approximately 50 basis points in 2026 to maintain a neutral policy stance.
The euro rebounded after a gap-down opening against the dollar on Monday, maintaining a neutral stance on the EUR/USD pair. Further upside potential exists for EUR/USD, but gains are expected to be limited near the psychological level of 1.1800, with 1.1830, the late February high, acting as a major resistance level. Over the next 1-3 weeks, EUR/USD is expected to fluctuate between 1.1667 (50-day moving average) and 1.1830 (late February high), with upward momentum remaining cautious. The euro opened with a gap-down to 1.1728, rebounded to 1.1790, and ultimately closed at 1.1787. While further gains are possible, given the lack of significant strengthening of upward momentum, any rise is likely limited to testing 1.1800. 1.1830. Support is at 1.1728 (early week low). A break below 1.1700 (psychological level) would indicate that the current mild upward pressure has subsided.
Consider going long on the Euro today at 1.1730, with a stop loss at 1.1720 and targets at 1.1780 and 1.1890.
Disclaimer: The information contained herein (1) is proprietary to BCR and/or its content providers; (2) may not be copied or distributed; (3) is not warranted to be accurate, complete or timely; and, (4) does not constitute advice or a recommendation by BCR or its content providers in respect of the investment in financial instruments. Neither BCR or its content providers are responsible for any damages or losses arising from any use of this information. Past performance is no guarantee of future results.
More Coverage


Risk Disclosure:Derivatives are traded over-the-counter on margin, which means they carry a high level of risk and there is a possibility you could lose all of your investment. These products are not suitable for all investors. Please ensure you fully understand the risks and carefully consider your financial situation and trading experience before trading. Seek independent financial advice if necessary before opening an account with BCR.
BCR Co Pty Ltd (Company No. 1975046) is a company incorporated under the laws of the British Virgin Islands, with its registered office at Trident Chambers, Wickham’s Cay 1, Road Town, Tortola, British Virgin Islands, and is licensed and regulated by the British Virgin Islands Financial Services Commission under License No. SIBA/L/19/1122.
Open Bridge Limited (Company No. 16701394) is a company incorporated under the Companies Act 2006 and registered in England and Wales, with its registered address at Kemp House, 160 City Road, London, City Road, London, England, EC1V 2NX. This entity acts solely as a payment processor and does not provide any trading or investment services.

 English
 简体中文
简体中文
 繁體中文
繁體中文
 Bahasa
Melayu
Bahasa
Melayu
 Tiếng
Việt
Tiếng
Việt
 ไทย
ไทย
 日本語
日本語
 한국어
한국어
 ភាសាខ្មែរ
 español

