


0
Commodity & Currency Analysis:
US Dollar Index
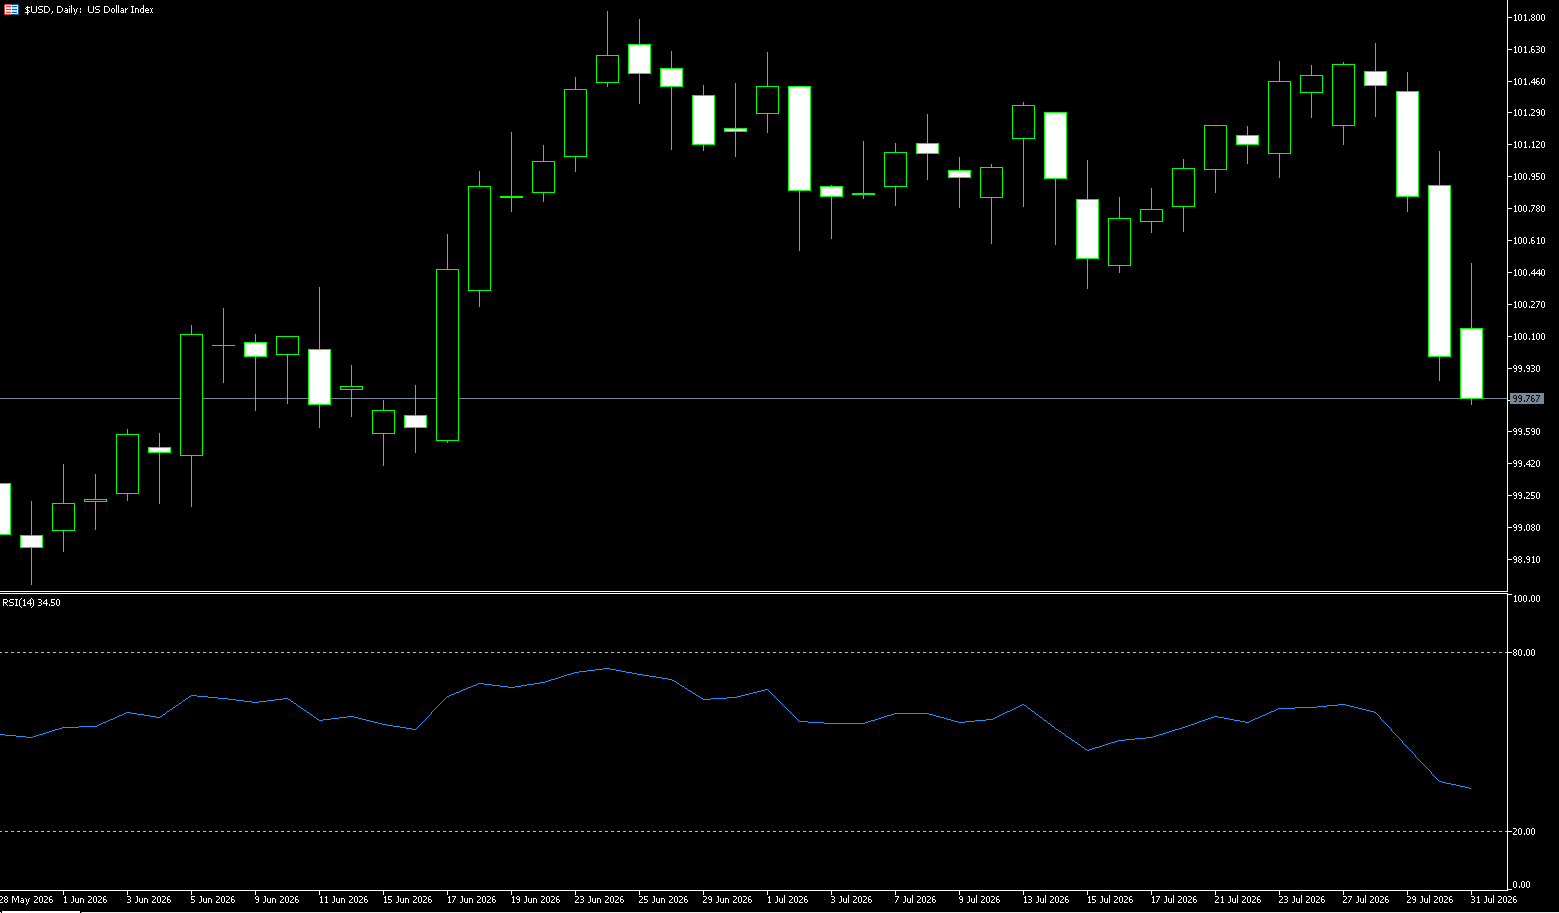
The US dollar index recorded a 1.65% decline last week, closing at 99.78. After falling to a low of 99.42 on Monday, it rebounded to around 99.90. This is not a mild correction, but the most intense weekly sell-off since the end of January. Looking at the monthly chart, the dollar's weakness doesn't even need technical indicators to confirm it—the visible upper shadow and bearish body tell a story of a steady retreat for the bulls. The Fed's interest rate decision deprived the dollar bulls of their last pillar of support, while the Japanese authorities' intervention in the currency market after months of uncertainty dealt a heavy blow to the dollar against the yen. With these two factors intertwined, non-dollar currencies collectively rallied, with the euro and pound both rising more than 1.4% for the week, while the dollar plummeted 3.6% against the yen, becoming the most volatile currency among the G10. The Fed has entered a phase of "hawkish language, dovish actions," and this inconsistency is unlikely to sustain the dollar's position. Overall, the previously crowded dollar bulls are undergoing a painful position clearing.
The daily chart shows that the dollar index fell from a high of 101.640 last week, hitting a low of 99.42 this morning, and is currently trading at 99.85. Currently, the US dollar index has clearly broken below the Bollinger Band midline support of 100.88, and has further declined to below the lower Bollinger Band line {99.85}, once reaching a low of 99.42, the low of June 15th. On the MACD indicator, both DIFF and DEA are below the zero line, and the green histogram is still expanding, showing no signs of bottom divergence or convergence. The RSI (14) has fallen from its high to around 33, not yet entering the oversold zone, indicating continued downward momentum. The large bearish candlestick on the weekly chart has completely wiped out the gains of the previous weeks, with the bearish signal reaching a four-star level. Therefore, the downside target is the low of 99.38 on June 15th; a break below this level would target the psychological level of 99.00. On the upside, the psychological level of 100 can be considered, with the next level targeting the area around 100.45 {last Friday's high}.
Today, consider shorting the US Dollar Index at 100.10, with a stop-loss at 100.20 and targets at 99.65 and 99.60.
WTI Spot Crude Oil
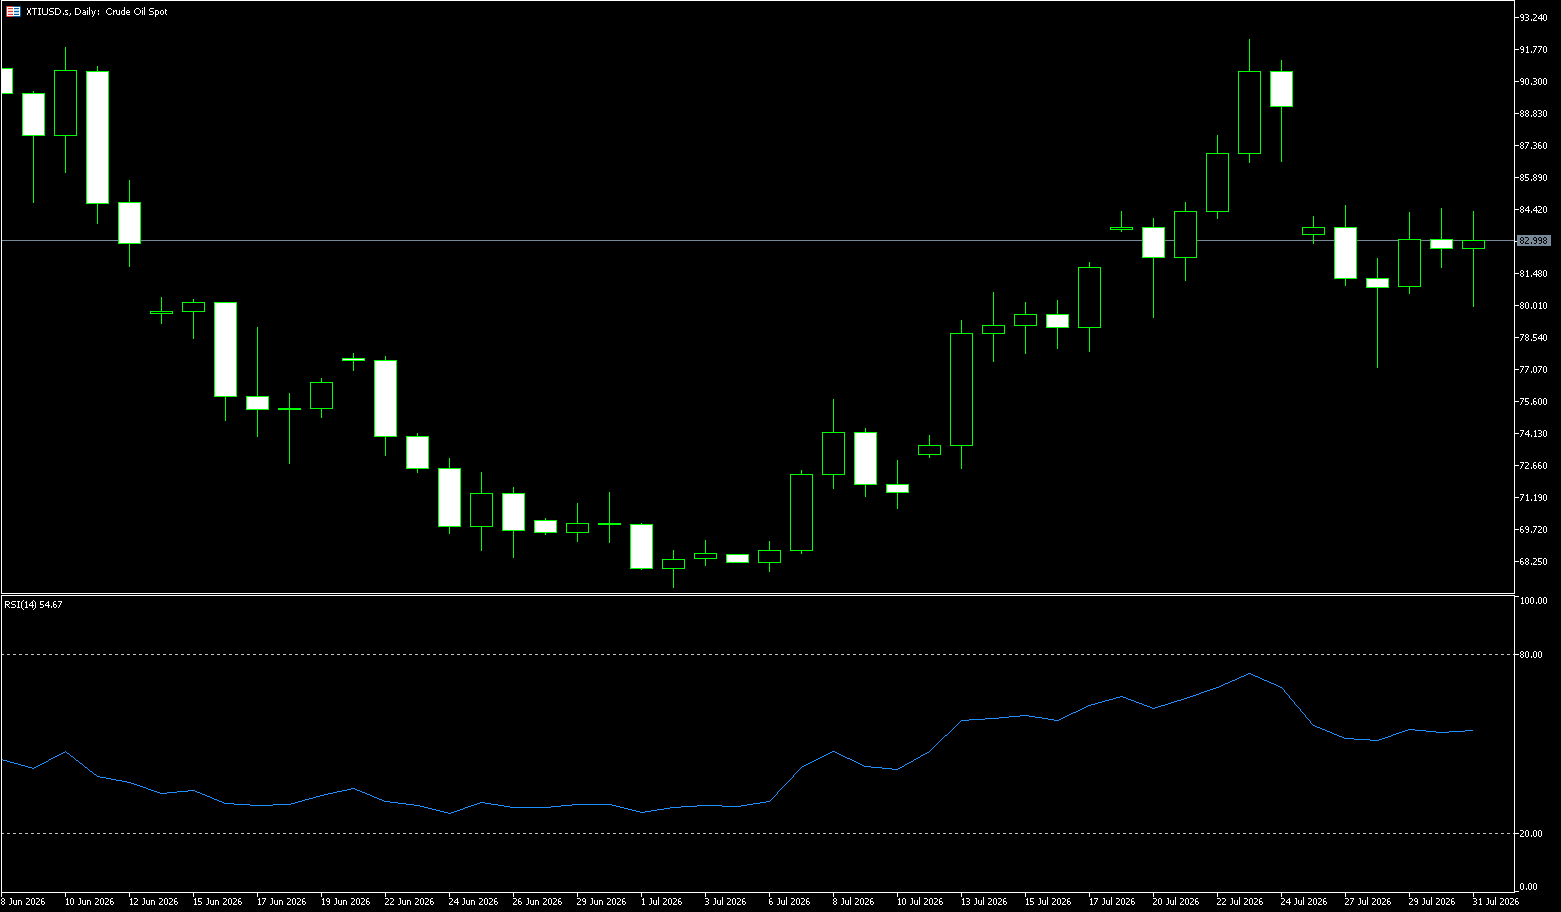
Trump stated over the weekend that he agreed to cancel strikes against Iran, and the US resumed negotiations with Iran on the 3rd to exert pressure. US crude oil opened nearly 7% lower on Monday, briefly falling below $80/barrel to a low of $78.57/barrel, and is currently trading around $78.70/barrel. Iran's Fars News Agency reported that the Revolutionary Guard prevented two oil tankers from passing through the Strait of Hormuz, and four others changed course. Kpler ship tracking data also showed that two Very Large Crude Carriers (VLCCs) left the strait on Friday, and overall shipping volume was sparse. Meanwhile, a drone attack on the Egyptian Mediterranean port of Damieta caused two liquefied gas tankers to catch fire, exacerbating the threat to shipping through the Suez Canal. In addition, the Ukrainian military launched a strike against Russia. A fire broke out at a refinery in Ergograd during an attack. Market analysts say the trading logic has shifted from the war itself to shipping data. Fundamentally, surveys indicate further upside potential.
US crude oil rebounded nearly 40% from around $67.08 (July low) to $92.25 (July 23 high), primarily driven by a risk premium resulting from disruptions to Middle Eastern supply and transportation. However, the rapid pullback near $92.25 suggests the market is beginning to differentiate between "actual supply losses" and "worst-case scenario premiums." The daily price touched the Bollinger Band at $91.02 before retreating, but remains above Monday's low of $77.57 and the 200-day moving average of $75.24. This indicates that the medium-term rebound structure remains intact; the MACD fast and slow lines remain positive but have not continued to diverge significantly upwards, reflecting that new funds are more cautious about chasing higher prices. The $80 level (a psychological barrier) is the initial resistance, followed by $81.73 (the 55-day moving average). If supply recovers faster than inventory replenishment, the price fluctuation center may gradually shift downwards to Monday's low of $77.57 and then to $75.24 (the 200-day moving average).
Today, consider going long on crude oil at $78.60, with a stop-loss at $78.45 and a target of $80.00. 81.00
Spot Gold
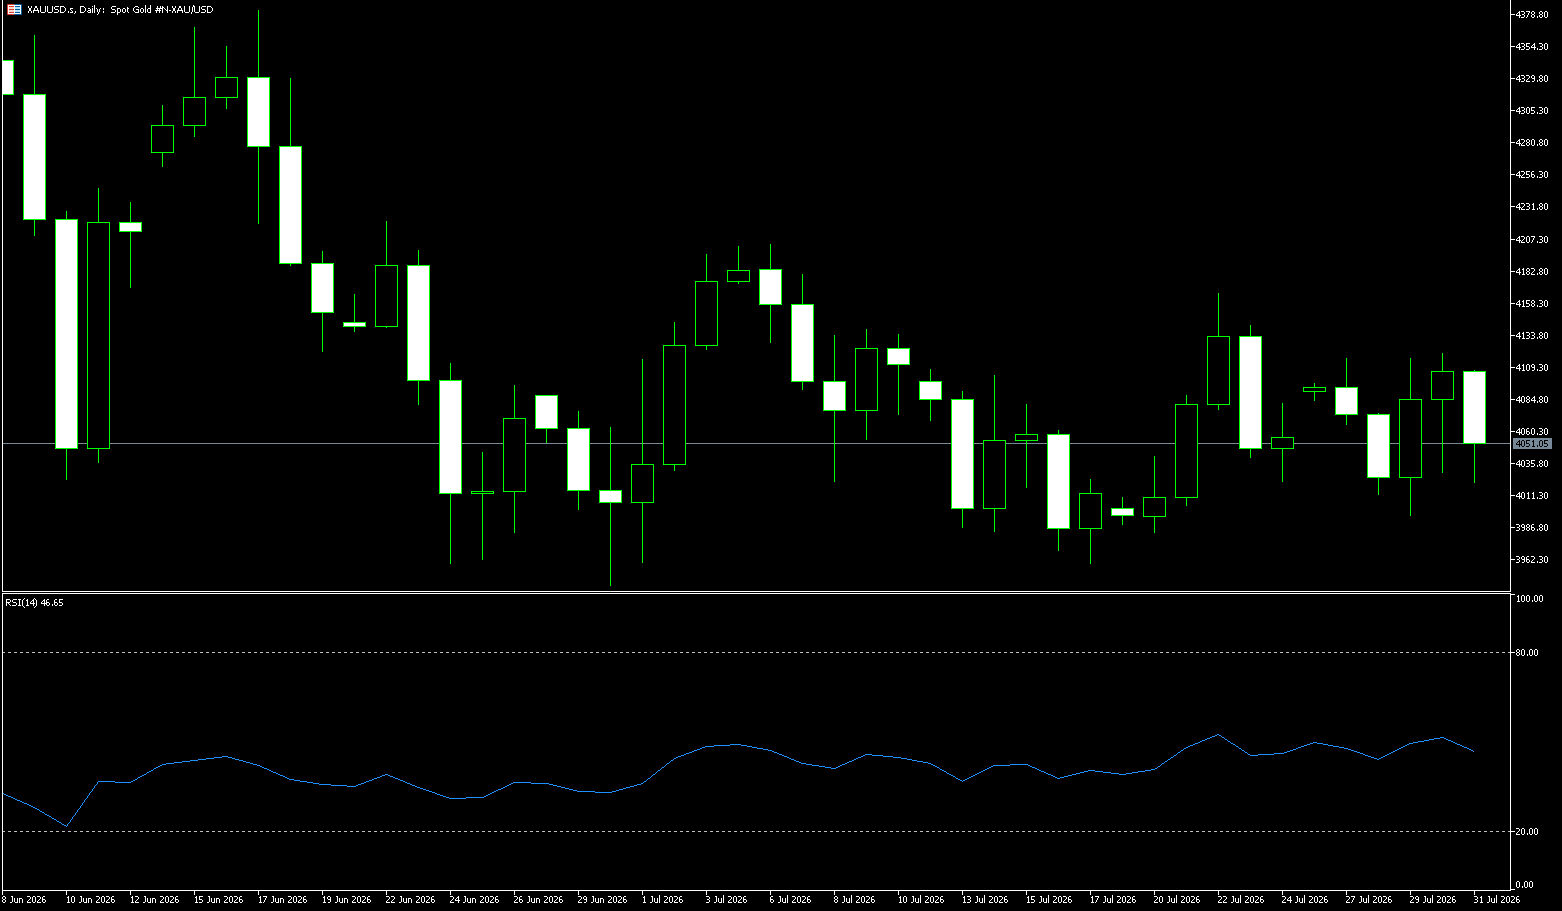
Gold rose above $4,050 an ounce on Monday, recovering losses from the previous session, after President Trump said peace talks with Iran would resume today, causing oil prices to fall and easing concerns about inflation and interest rate prospects. Trump said key Middle Eastern allies, including Saudi Arabia, urged him to suspend planned strikes and seek a diplomatic agreement instead, while reiterating calls for the swift reopening of the Strait of Hormuz. Investors are also turning their attention to a data-packed week for the US labor market, with the highly anticipated monthly jobs report due on Friday. Last week, the Federal Reserve kept interest rates unchanged, despite dissenting opinions from three officials who warned that prolonged delays could ultimately lead to… More aggressive policy tightening may be needed. Currently, the market estimates a 68% probability of a 25 basis point rate hike by the Federal Reserve in September.
Combining current fundamental and technical signals, the previous surge in gold prices has likely ended, and the market has shifted from a one-sided upward trend to a consolidation phase with bulls and bears battling it out. There is a lack of sustained upward momentum in the short term, and a pullback to test the 4,000-3,982 range is possible. Overall, the market is expected to consolidate without a clear trend, and future movements will heavily depend on key data and policy expectations. It is premature to predict the future trend within a defined range. Technically, after breaking below the 4,062 (20-day moving average) short-term support, the price has continued to decline, indicating short-term weakness. The psychological level of 4,000 is a key support level. The price of 3,982, the low point of last month (November 20th), provides strong structural and psychological support. Multiple tests of this level have failed to break through, indicating strong support effectiveness. The 20-day moving average at 4,062 has now become short-term resistance. The next key level is the psychological barrier of $4,100. In the short term, the price is likely to fluctuate within the $4,000-$4,100 range, but this range is not fixed. If significant data is released later, it could easily break the current consolidation pattern and trigger a breakout.
Today, consider going long on gold at 4,045, with a stop-loss at 4,040; targets: 4,080; 4,090.
AUD/USD
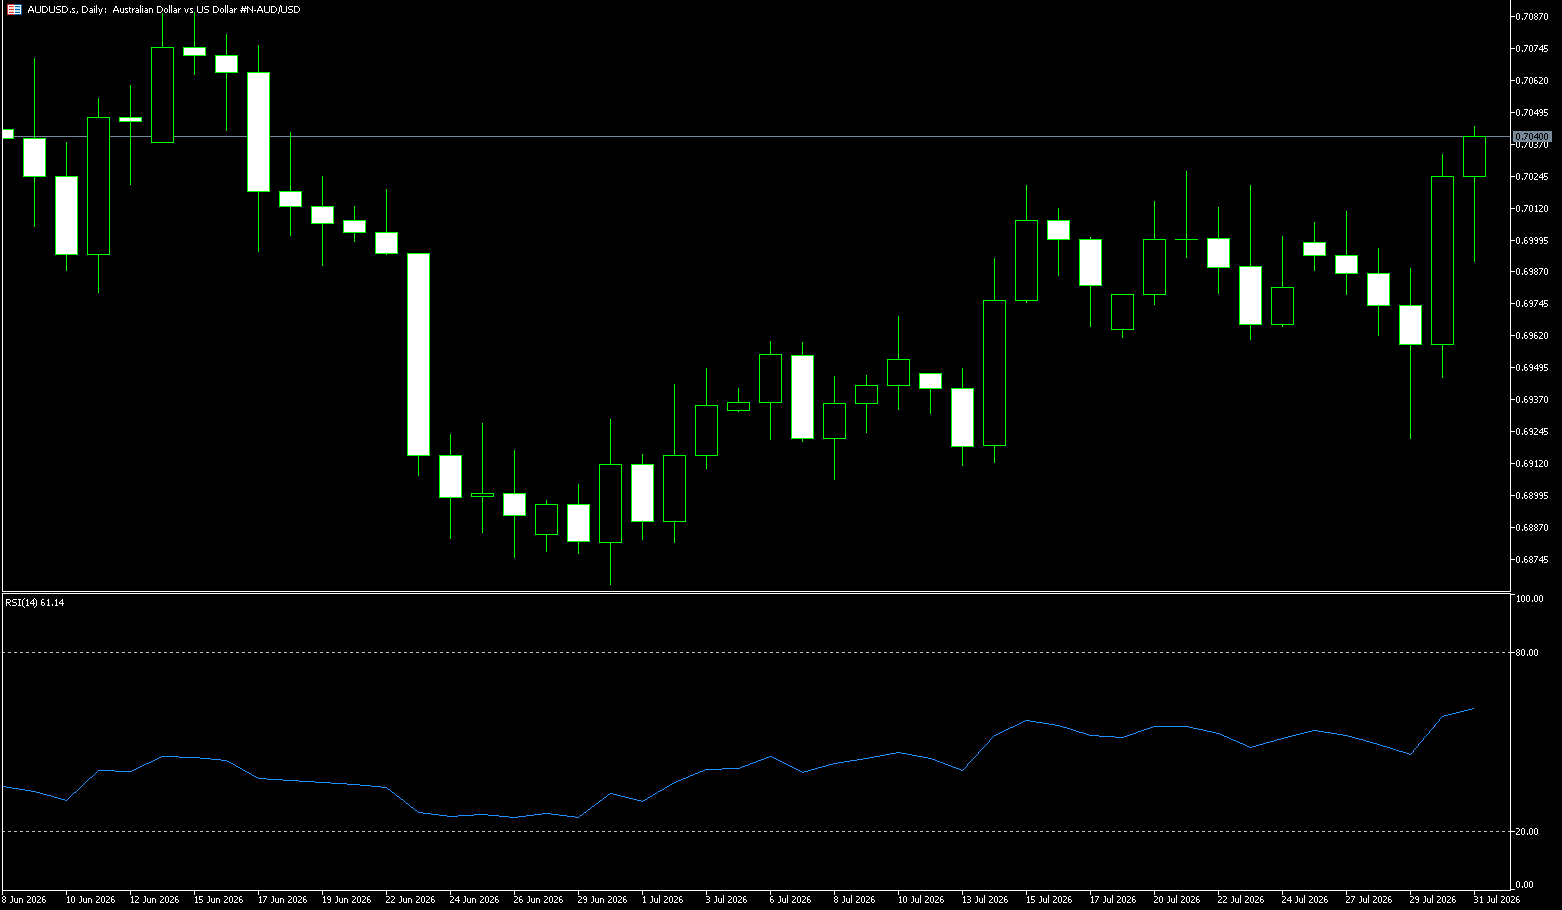
The Australian dollar rose above US$0.70, nearing a seven-week high, supported by broad-based dollar weakness and hopes for Middle East diplomatic negotiations. The dollar weakened after Japan confirmed its coordination with the US Treasury in yen purchases, strengthening the Australian dollar. On the other hand, US President Donald Trump stated that peace talks with Iran would resume following calls from key Middle Eastern allies for a diplomatic solution and the reopening of the Strait of Hormuz, boosting risk sentiment. In Australia, the market has little expectation of a rate hike by the Reserve Bank at its next meeting, with a September hike being highly unlikely. However, the market is roughly even on the probability of a November rate hike, reflecting the risk that third-quarter inflation data may be stronger than expected. The central bank has already raised rates three times this year, and the accumulated tightening policy is increasingly putting pressure on the housing market, with house prices falling by 0.7% in July.
The Australian dollar/US dollar pair encountered resistance near the 100-day simple moving average at 0.7052, retreating after reaching near 0.7050 earlier on Monday, a new high since June 17. Technically, the pair broke through the 0.7020 resistance level last week, representing the 38.2% Fibonacci retracement of the May-June decline, considered a key trigger for the AUD/USD bulls. Indeed, the Relative Strength Index (RSI) hovers around 53, and the MACD is slightly positive, suggesting that buyers still dominate the short-term bias while facing nearby resistance. However, the 100-day simple moving average at 0.7052, and subsequently the 50.0% retracement at 0.7069, are likely to continue to provide immediate resistance. A daily close above this resistance zone would open the way for a test of the 0.7100 (psychological level) and the 61.8% retracement at 0.7117. On the downside, initial support is at the 38.2% Fibonacci retracement level of 0.7021, with further support at 0.6946 (July 30 low) and the 200-day simple moving average at 0.6913.
Consider going long on the Australian dollar at 0.6990 today, with a stop loss at 0.6980 and targets at 0.7060 and 0.7050.
GBP/USD
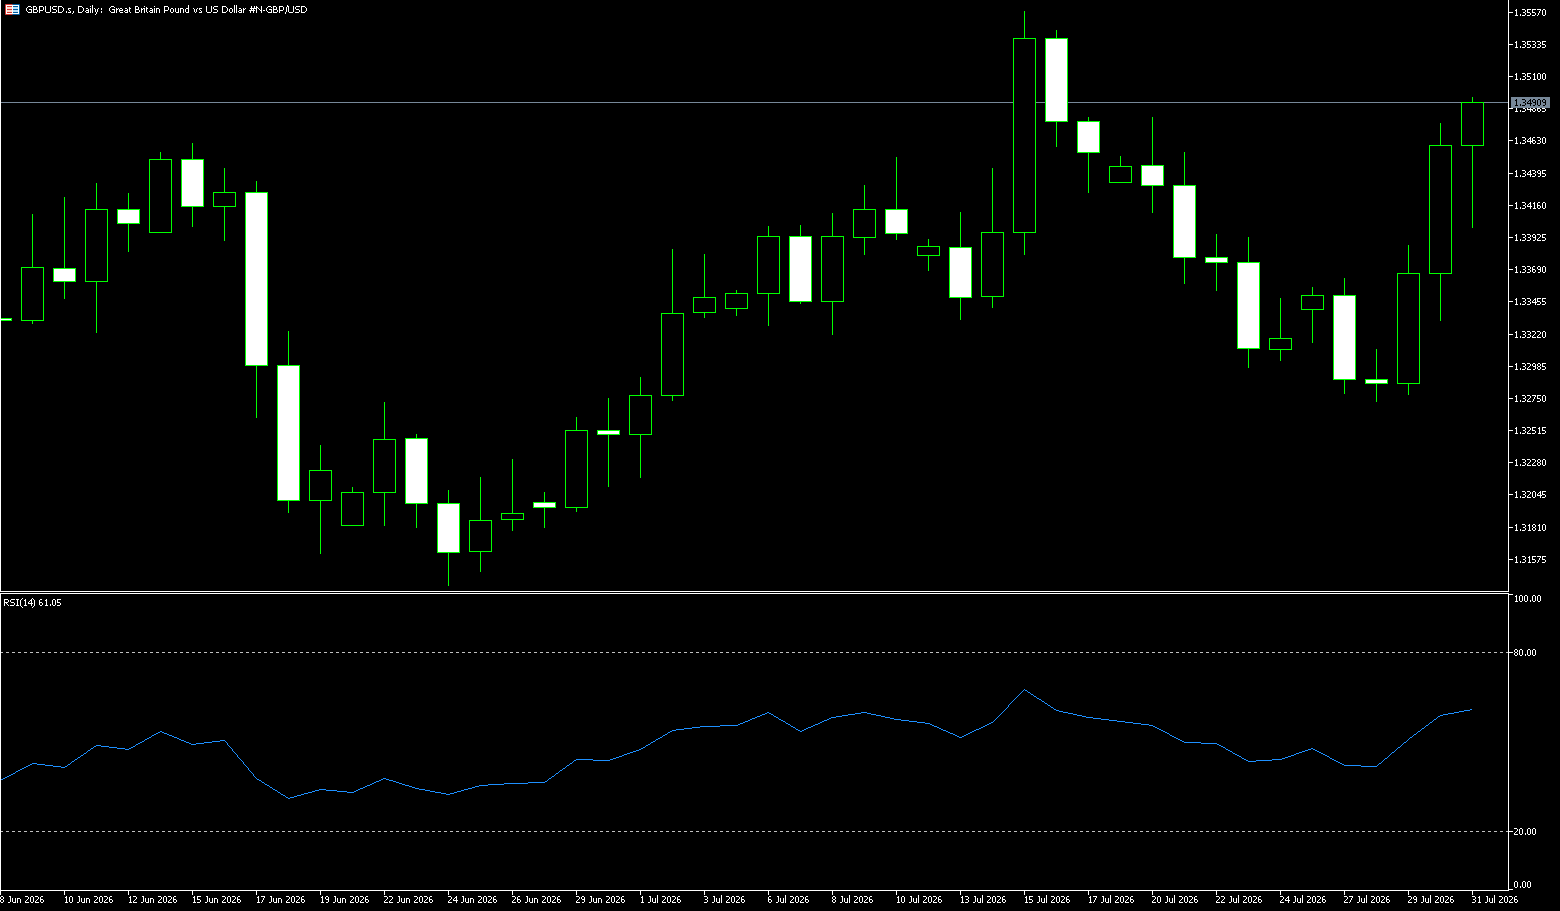
The pound/dollar pair gave up its gains after three consecutive days of increases, trading around 1.3440 in Asian trading on Monday. Risk aversion eased as reports surfaced that US President Trump had paused planned strikes, fueling hopes for a diplomatic breakthrough between the US and Iran. This pressured the dollar and allowed the pair to regain its footing. The Bank of England decided last week to keep interest rates unchanged, but left room for potential rate hikes given the ongoing uncertainty of the US-Iran conflict. This is the difference between a hawkish central bank and one in a country facing funding problems. The approximately £24 billion in deferred spending and tax measures ahead of the October budget also maintain this interpretation. Until the budget addresses this issue, the pound will continue to translate positive news into small gains and negative news into sharp declines.
The pound/dollar pair's rebound near a six-week low of 1.3300 was capped as selling pressure continued to linger above the 1.3500 (psychological level) and 1.3506 (previous high) areas. Despite later pressure, the pound/dollar pair rose, reversing some of last week's sharp decline. At the beginning of the week, the highly anticipated meeting between US President Trump and Chinese President Xi Jinping failed to achieve substantial results on the Iran war, influenced by renewed geopolitical tensions over the weekend. From a daily chart perspective, the pound/dollar pair has corrected after a continuous rise, currently falling back to around 1.3460. Short-term momentum has weakened, but the overall structure remains oscillating with a slightly bullish bias. The pair has remained near major moving averages after breaking through a key area, and the upward trend has not been completely broken. Resistance is seen at the psychological level of 1.3500 and the area around 1.3558 (the high of July 15th). As for support, a decisive break below 1.3400 would bring the 1.3364 (50-day simple moving average) back into focus.
Today, consider going long on GBP at 1.3420, with a stop-loss at 1.3410 and targets at 1.3470 and 1.3480.
USD/JPY
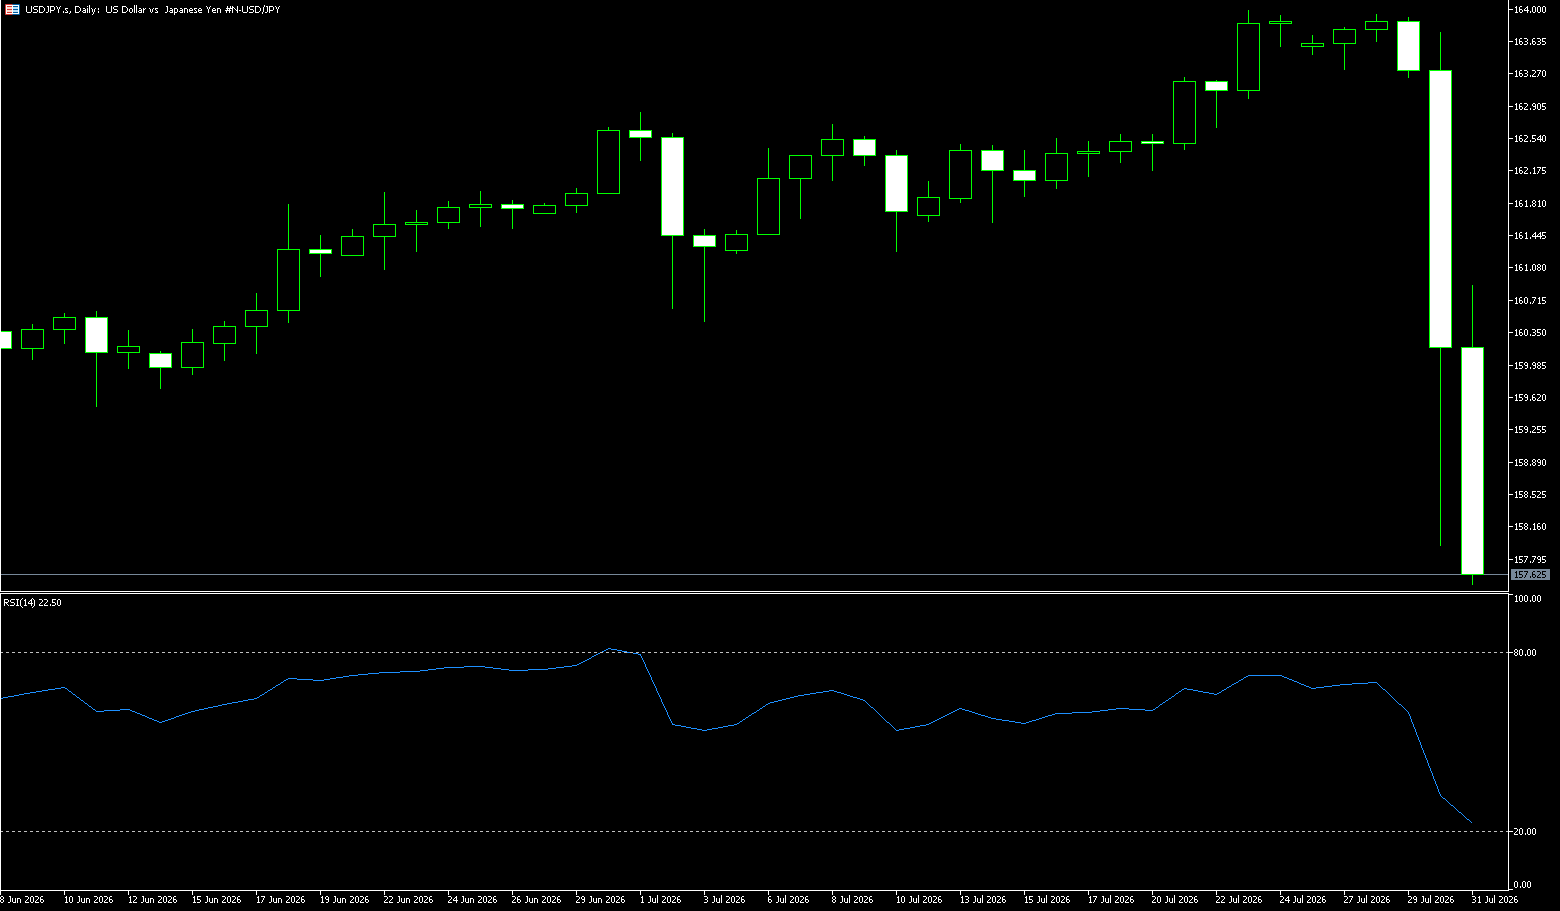
The USD/JPY pair closed last week at 157.35, a weekly drop of 3.96%, an extremely rare weekly fluctuation recently. So far this week, USD/JPY has fallen further to 155.23, its lowest level since February. Two major catalysts for the yen were triggered almost simultaneously. First, the Bank of Japan announced on Friday that it would maintain its interest rate at 1%, but Governor Kazuo Ueda released a clear hawkish signal after the meeting. The market characterized this meeting as a "hawkish hold-up," and expectations for a September rate hike immediately increased. A stronger impetus came from direct intervention. In late last week, Japanese authorities entered the market to buy yen and sell dollars. On that day, the spot trading volume of yen on the EBS platform hit a 10-year high, and the trading volume of yen futures also broke historical records. In a sluggish liquidity environment, intervention can generate a far greater impact than usual, and even mere expectations can trigger heightened market sensitivity. The Bank of Japan is poised to raise interest rates to 1.25% by the end of the year; while this rate hike path is slow, its direction is undeniable.
The USD/JPY pair closed last week at 157.35, a weekly drop of 3.96%, an extremely rare weekly fluctuation recently. On the daily chart, the pair further fell to a six-month low of 155.23 this morning. Currently, USD/JPY has plummeted from its high of 163.98, breaking through the 9-day moving average at 160.71 and the psychological level of 160.00, and is now approaching the lower Bollinger Band at 155.92. The MACD formed a death cross at a high level and is accelerating downwards, with the green histogram bars continuing to lengthen, indicating a strong bearish signal at the four-star level. Last week's candlestick pattern showed consecutive large bearish candles, with the bulls offering virtually no resistance. On the other hand, uncertainty surrounding the Middle East situation may drive the USD/JPY pair higher. Key support levels to watch are 155.23 (a six-month low) and 155.00 (a psychological level); a break below these levels could lead to a test of the 152.30 level (the February low). If this area holds, a rebound is possible. Resistance levels are 157.17 (Monday's opening price) and 158.00 (a psychological level).
Consider shorting the USD at 157.30 today, with a stop-loss at 157.45 and a target of 156.20. 156.00
EUR/USD
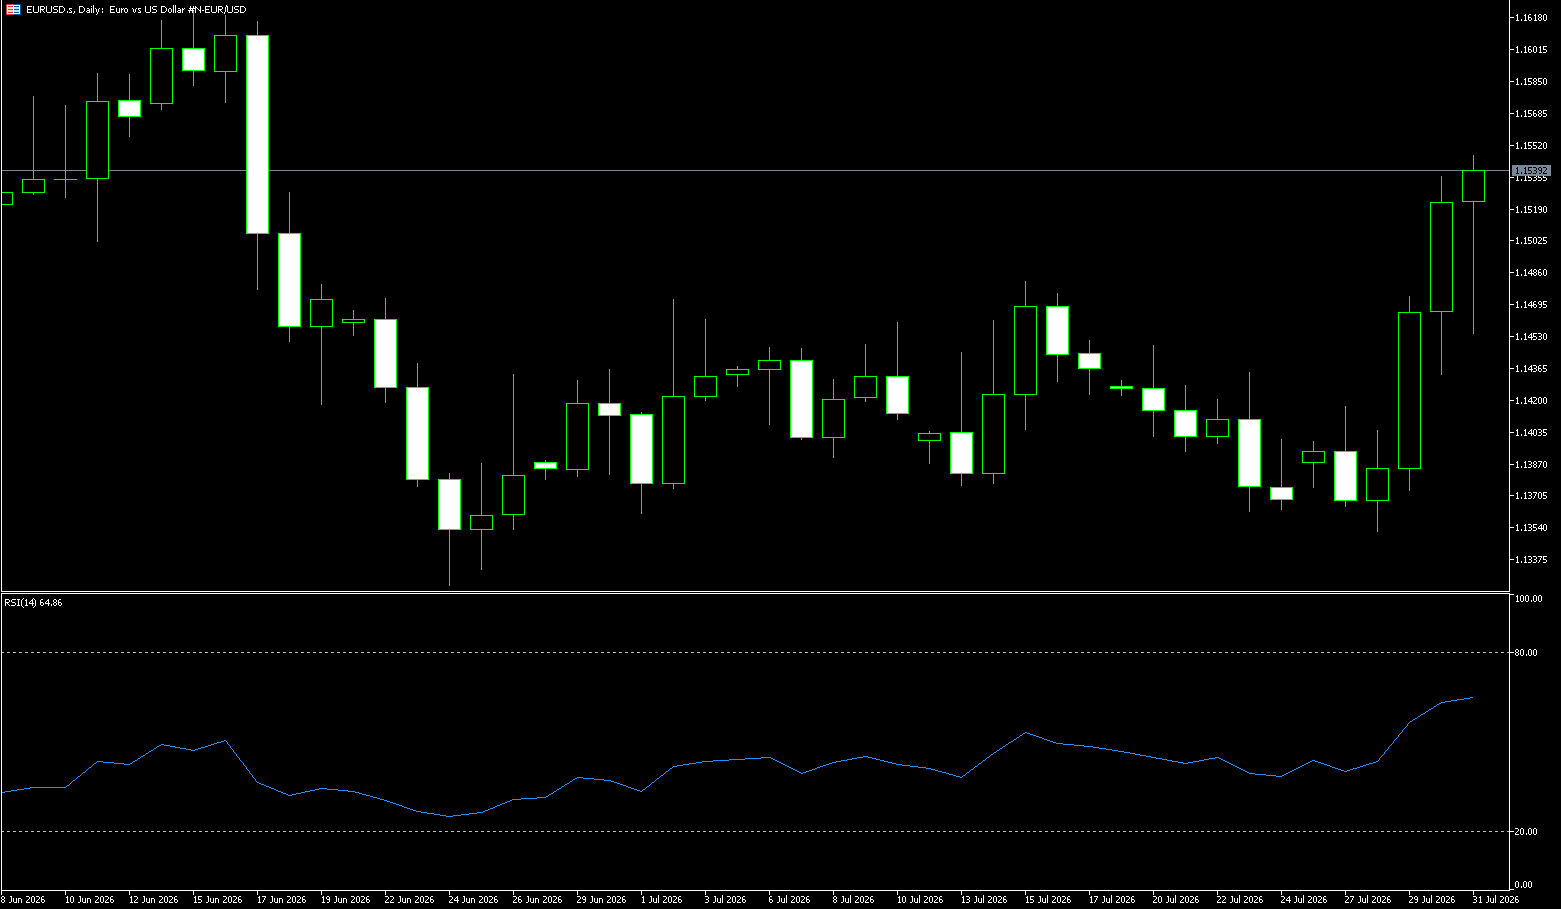
The euro attracted buying interest for the fifth consecutive trading day on Monday. Spot prices rose to a new high since June 17th during the Asian session, breaking through the mid-range of 1.1500, and seem poised for further gains against the backdrop of a generally weakening dollar. The euro opened the week slightly higher at 1.1535 against the dollar. Intraday volatility appeared mild, with a weekly gain of 1.46%. The euro's rebound was more of a "passive stroke of luck"—a sharp drop in the dollar provided a tailwind, rather than a significant improvement in the euro's own fundamentals. This week, the Eurozone lacked significant data guidance, with market focus entirely on the US-Japan event. Nevertheless, the euro's ability to hold firmly above 1.15 indicates weakening bearish pressure and a short-term bottom being established. Most market traders believe that the current trend of the euro is highly dependent on changes in the US dollar. If the US dollar index continues to slide below the 100 mark, the euro has a chance to challenge a higher resistance area. However, some cautious voices suggest that the euro itself lacks the driving force for an active rise, and once the US dollar experiences a technical rebound, the euro's gains may be quickly reversed.
The current trend of the euro is highly dependent on changes in the US dollar. If the US dollar index continues to slide below the 100 mark, the euro has a chance to challenge a higher resistance area. However, some cautious voices suggest that the euro itself lacks the driving force for an active rise, and once the US dollar experiences a technical rebound, the euro's gains may be quickly reversed. The daily chart shows signs of marginal improvement: EUR/USD {June 15} has rebounded from the previous low of 1.1324 and is currently above the Bollinger Band middle line at 1.1430, testing the 100-day moving average area of 1.1568. Technical indicator RSI (14) The price has rebounded from its low to around 61, nearing the overbought level. The MACD shows a weak red bar near the zero line, and the DIFF and DEA are close to forming a golden cross, indicating a weak bullish nascent stage with a signal strength of three stars. Therefore, the upside targets are the 100-day moving average at 1.1568 and the psychological level of 1.1600. On the downside, consider the 5-day moving average at 1.1487 and the Bollinger Band middle line at 1.1430.
Today, consider going long on the Euro at 1.1496, with a stop loss at 1.1488 and targets at 1.1540 and 1.1550.
Stock Analysis:
Australian ASX 200 Stock Index
Basic Market Overview:
The Australian Securities Exchange (ASX) 200 index rose 43 points, or 0.5%, to close at 9,019 on Monday, reversing earlier losses and extending last week's momentum. Investor sentiment improved after a rebound in US stock index futures, thanks to President Trump's decision to pause further action against Iran. Locally, Australian factory activity in July was revised upward, supported by slowing inflation. In China, a major trading partner, policymakers pledged to continue providing monetary support in the second half of 2026, vowing to maintain liquidity and adjust tools as needed.
Domestic earnings season also drew attention, with AMP, Nick Scali, James Hardie, and REA Group set to release earnings reports, providing insights into corporate resilience during the five-month Iran war. 4DMedical shares surged 9.1%, leading healthcare stocks, while Treasury Wine Estates rose 5.9%, outperforming consumer goods. Three of the four major banks saw their share prices rise between 0.2% and 0.8%. In contrast, energy stocks underperformed, with oil prices declining; Woodside fell 1.4% and Santos fell 1.9%.
Sector Performance:
Leading Sectors (Closing Change)
1. Utilities +2.10% [Strongest Performer] Key Stock: Origin Energy. The sector led the gains, with funds favoring high-dividend defensive assets.
2. Industrials +1.36% Stimulated by M&A news (FleetPartners, Steadfast), infrastructure and business services stocks strengthened.
3. Consumer Discretionary +1.10% Representative Stock: Domino’s Pizza (DMP) +6.25%
4. Healthcare +Approximately 1.0% Leader: 4DMedical (4DX) +9.09%. Growth stocks in the sector were favored by funds.
5. Consumer Staples + Approximately 1.0%
Leading Stock: Treasury Wine Estates (TWE) +5.90%
Leading Sectors (Closing Change)
1. Energy -1.19% [Weakest Performer] Falling oil prices directly pressured oil and gas stocks; Woodside Energy (WDS) -1.4%, Santos (STO) -1.9%.
2. Communications -0.01% (Flat or Weak)
3. Materials Slightly Lower Iron ore prices were under pressure, with Fortescue Metals (FMG) leading the decline, dragging down the mining sector.
Technical Analysis:
The index opened slightly lower on Monday morning, briefly dipped during the session, but rebounded strongly in the afternoon, completely recovering its intraday losses and closing near its intraday high. The ASX200 closed at 9019.3 points on Monday, up 0.5% (+43 points) for the day, continuing last week's upward trend and regaining its footing above the 9000 level. Driving factors: Easing geopolitical tensions in the Middle East and stronger US stock futures; upward revisions to Australian July manufacturing data and slowing inflation, leading the market to lower expectations for further rate hikes by the Reserve Bank of Australia; and continued positive expectations for Chinese pro-growth policies, which benefited Australian resource exports. Monday's close showed a bullish reversal, indicating a short-term advantage for the bulls. However, the index has reached the upper edge of its long-term trading range, and selling pressure is gradually increasing. The daily RSI has rebounded to around 58, not yet severely overbought, suggesting further upside potential. The MACD histogram is expanding moderately without any bearish divergence. Structurally, the index has been trading within a large range of 8500-9100 for the past four months, currently approaching the upper boundary. A breakout requires sustained volume support. Failure to effectively hold above 9080 could easily trigger a pullback from the range. Tuesday's scenarios are predicted as follows: 1. Optimistic scenario: Holding above 9060 → testing 9130; 2. Neutral scenario: Fluctuating between 9000 and 9060; 3. Pessimistic scenario: A break below 8970 → testing the 8900 support level.
Trading Strategies:
The following are technical trading ideas only and do not constitute investment advice. Leveraged trading may result in losses exceeding the principal.
Bull Strategy (Playing the Upward Breakout):
• Conservative Entry: Buy on dips within the 8970-8990 range after a pullback and stabilization.
• Aggressive Entry: Buy after confirming a breakout above 9060.
• Take Profit: First target 9085-9130
• Stop Loss: Long positions should be stopped out below 8900.
Bear Strategy (Playing the Sideways Resistance and Pullback):
• Shorting Conditions: A rally to the 9060-9080 range followed by resistance and repeated failures to break through, showing clear signs of stalling.
• Take Profit Target: 8970 → 8920
• Stop Loss: Exit above 9105.
Key Risk Warnings:
Earnings Season Risk:
This week, many Australian blue-chip companies will release their earnings reports. Weaker-than-expected earnings from resource, real estate, and financial stocks could easily trigger a rapid pullback in these sectors, dragging down the index. External Macroeconomic Risks
Overnight performance of US stocks and fluctuations in US Treasury yields; a renewed rebound in international oil prices could reignite global inflation expectations, suppressing stock market valuations; significant fluctuations in the Australian dollar exchange rate could impact earnings expectations for resource stocks.
Geopolitical Risks
Renewed tensions in the Middle East could rapidly increase risk aversion, suppressing risk assets and triggering a rapid index correction.
Technical Structural Risks
The index has been hovering near the upper boundary of a large trading range for an extended period, failing to break through effectively after multiple attempts. Once bullish momentum weakens, a rapid pullback is possible; be wary of "false breakouts" that could be trapping bulls.
Japan Stock Market Index (JP225)
Basic Market Overview:
The Nikkei 225 index fell 0.94% to close at 63,755 points, while the broader Topix index fell 1.08% to 3,960 points, reversing gains from the previous trading day, as the yen continued its rebound after Japan confirmed a coordinated foreign exchange purchase operation with the US Treasury. The Treasury also warned of the need for additional coordinated intervention if necessary and stated that it was maintaining close contact with US authorities. A stronger yen has clouded the profit prospects of Japan's export-oriented industries and reduced the attractiveness of domestic stocks to foreign investors.
Financial, consumer, and technology stocks were generally hit hard, with Sumitomo Mitsui falling 2.9%, Toyota Motor down 3.4%, and Amphenol down 3.3%, all among the biggest losers. In corporate news, despite Fanuc raising its full-year guidance due to strong sales and profit growth, its share price still plummeted by more than 14%.
Sector Performance:
Leading Sectors (Relatively Strong):
1. Precision Machinery
2. Air Transportation
3. Metal Products
Strong Stock: SoftBank Group bucked the trend and closed higher; safe-haven domestic demand-driven airline stocks showed resilience.
Leading Sectors (Hardest Hit):
1. Transportation Machinery (Automobiles, Largest Loss)
Representatives: Toyota Motor, Honda, Suzuki; the stronger yen suppressed overseas revenue, with Suzuki falling more than 6.7% in a single day.
2. Real Estate
3. Land Transportation
4. Electronic Components/Semiconductor Equipment (Export Technology)
Representatives: Advantest, Murata Manufacturing, Tokyo Electron; FANUC's over 17% drop dragged down sentiment in the automation supply chain.
5. Large Financial Institutions (Banks, Trading Companies)
Representatives: Mitsubishi UFJ Financial Group, Mitsui & Co., and other currency-sensitive trading companies.
Technical Analysis:
The USD/JPY pair fell sharply to around 155 on Monday. Lowered profit forecasts for leading exporters and concentrated selling of export-heavy stocks by foreign investors were the main reasons for the index's decline. The Japanese Ministry of Finance stated that it did not rule out further coordinated intervention, amplifying market panic due to anticipated exchange rate volatility. Monday's close was 63754.90 points, down 607.12 points, a decrease of 0.94%. On the other hand, after Friday's sharp rise, a large amount of long positions accumulated unrealized profits, which were realized and exited on Monday; coupled with a sharp drop in the South Korean KOSPI index, this suppressed risk sentiment across the Asia-Pacific region. Technical Analysis: The index has retreated from its high, indicating a temporary slowdown in the short-term bullish trend. The RSI has fallen from overbought territory to a neutral-to-bearish zone; the MACD histogram continues to contract, posing a risk of a death cross. Technically, the index has formed a bearish engulfing pattern after a surge, entering a period of consolidation. The key indicator to watch is the USD/JPY exchange rate, which is the primary indicator for the day. Continued yen strength will put pressure on the index; a slight yen pullback would provide an opportunity for the export sector to recover. Tuesday's Scenario: Optimistic Scenario: Holding the 63400 support level, a rebound to test 64400 is possible; further recovery momentum is needed after a stable hold. Pessimistic Scenario: A decisive break below 63400 and continued decline, testing the key support level of 62800.
Trading Strategy:
Tuesday Trading / Operation Strategy (Applicable to Short-Term Swing Trading)
Bull Strategy (Cautious Buying on Dips, Avoid Chasing Highs)
1. If the price retraces to the 63400-63500 range and stabilizes, and the exchange rate also stops falling, consider a small long position; place a stop loss below 63250.
2. The first profit target for the long position is 64200, and the second profit target is around 64900; reduce positions in batches when reaching resistance levels, and do not blindly expect new highs.
3. Strictly avoid chasing highs at levels without support.
Bear Strategy (Follow the Trend and Play the Pullback)
1. If the price rebounds to the 64200-64400 resistance range and encounters resistance without a significant breakout, consider a small short position; place a stop loss above 64550.
2. The first target for the short position is 63500; if it breaks below this level, continue to look for support at 62800.
Key Risk Warnings:
**Maximum Exchange Rate Uncertainty Risk:**
Repeated expectations of intervention in the US and Japanese currency markets mean that sharp fluctuations in the USD/JPY exchange rate will directly impact the export-heavy stocks in the Nikkei 225, easily amplifying daily index volatility. If the yen appreciates rapidly again, the index will likely face renewed pressure.
**External Market Linkage Risk:** Overnight US stock market movements, US Treasury yield fluctuations, and South Korean stock market volatility will directly impact the Asian morning session.
**Heavyweight Stock Performance Risk:** Leading companies in the robotics, semiconductor, and automotive sectors are currently in the earnings reporting season. A single leading company's earnings disappointment could quickly drag down the index.
**Liquidity and Volatility Risk:** The Nikkei 225 experiences significant intraday volatility. Overseas leveraged trading carries the risk of rapid and substantial losses and increased slippage. Please strictly control your position size and stop-loss orders.
Disclaimer: The information contained herein (1) is proprietary to BCR and/or its content providers; (2) may not be copied or distributed; (3) is not warranted to be accurate, complete or timely; and, (4) does not constitute advice or a recommendation by BCR or its content providers in respect of the investment in financial instruments. Neither BCR or its content providers are responsible for any damages or losses arising from any use of this information. Past performance is no guarantee of future results.
More Coverage






Risk Disclosure:Derivatives are traded over-the-counter on margin, which means they carry a high level of risk and there is a possibility you could lose all of your investment. These products are not suitable for all investors. Please ensure you fully understand the risks and carefully consider your financial situation and trading experience before trading. Seek independent financial advice if necessary before opening an account with BCR.
BCR Co Pty Ltd (Company No. 1975046) is a company incorporated under the laws of the British Virgin Islands, with its registered office at Trident Chambers, Wickham’s Cay 1, Road Town, Tortola, British Virgin Islands, and is licensed and regulated by the British Virgin Islands Financial Services Commission under License No. SIBA/L/19/1122.
Open Bridge Limited (Company No. 16701394) is a company incorporated under the Companies Act 2006 and registered in England and Wales, with its registered address at Kemp House, 160 City Road, London, England, EC1V 2NX. Open Bridge Limited acts solely as a payment processor for BCR Co Pty Ltd and does not provide any financial, trading, or investment services on its behalf. Open Bridge Limited's role is limited to payment processing.


 English
 简体中文
简体中文
 繁體中文
繁體中文
 Bahasa
Melayu
Bahasa
Melayu
 Tiếng
Việt
Tiếng
Việt
 ไทย
ไทย
 日本語
日本語
 한국어
한국어
 ភាសាខ្មែរ
 español