


0
The US Dollar Index
At the year-end, the divergence in monetary policy between the Federal Reserve and other major central banks worldwide intensified, becoming a core factor suppressing the US dollar index. The downward trend of the dollar is expected to continue in 2026, but the decline will be significantly narrower. Accelerated recovery in overseas economies and a reduction in the Federal Reserve's federal funds rate will be the two key drivers of the dollar's weakness. Meanwhile, in 2025, the dollar ended with its worst performance in nearly a decade, falling 9.5% against a basket of major currencies, marking its deepest annual decline since 2017. The US dollar index once plummeted to a 3.5-year low of 96.22. However, the market's pessimistic expectations for the dollar are not without uncertainty, as multiple potential risk events could overturn the current trend. First, if the US Supreme Court rules the White House's tariff policies illegal, it will trigger severe turmoil in global financial markets, highlighting the dollar's appeal as a traditional safe-haven asset and driving capital back to dollar-denominated assets. Second, if the US introduces a large-scale tax cut bill, coupled with a continued investment boom in the artificial intelligence industry, it will effectively boost US GDP growth, making "American exceptionalism" the main market theme again, thereby weakening the necessity of the Federal Reserve's loose monetary policy. More importantly, if core negative factors such as the divergence in monetary policy and the narrowing gap in economic growth between the US and Europe fail to materialize, investors' views on the US dollar will undergo a fundamental shift.
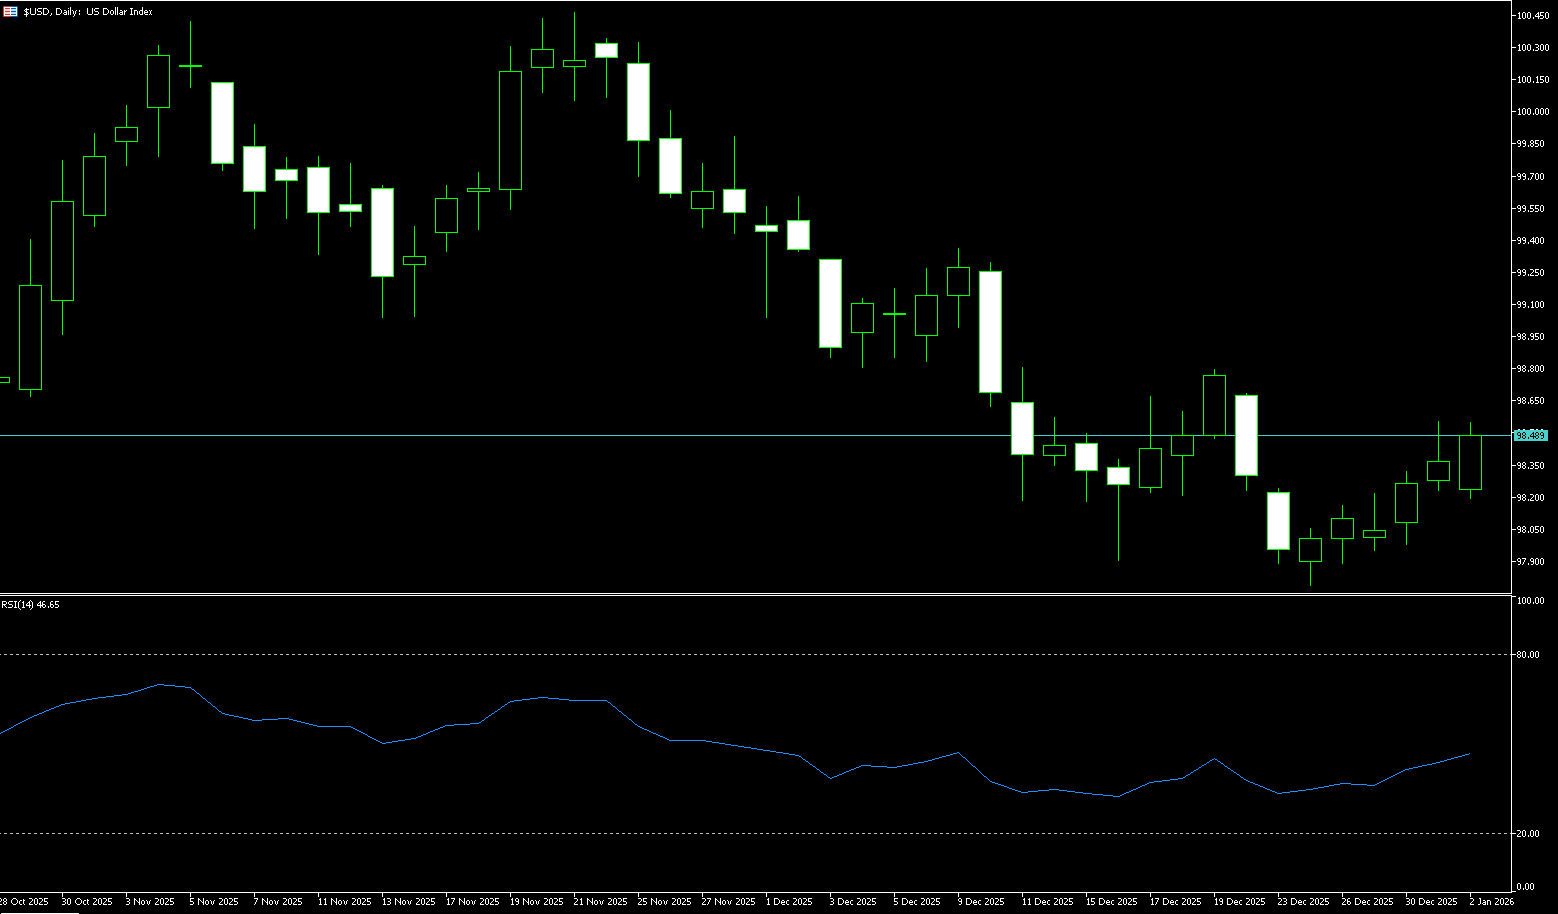
Historical trends may provide support for the dollar. Looking back at 2017, during Trump's first term as president, the dollar index weakened significantly; however, by 2018, the dollar had gradually recovered some of its losses. This pattern of "rebound the following year" may repeat itself in 2026. Currently, the dollar index is generally showing a weak and volatile trend this week, with intense short-term battles between bulls and bears. A break below 98.00 (the psychological level) and 97.75 (the low of December 24th) would likely give way to bearish sentiment. The daily chart shows a short-term bearish bias, with weak rebounds and an overall fragile position. Furthermore, the price action after rebounding from 97.75 has been somewhat hesitant. The Relative Strength Index (RSI) is below the 50 midline, indicating moderate downward pressure, but it has not yet entered oversold territory, suggesting insufficient rebound momentum. The 10/20/50-day simple moving averages are all in a bearish alignment, providing resistance. On the upside, if the US dollar index can regain above 98.50 (last week's high), the upward momentum may extend to 98.90 (the 200-day simple moving average) and the 99.00 (psychological level); however, if it breaks below 98.00 and 97.75 (the December 24 low), the short-term direction may turn bearish. The target will be 97.46 (the October 1 low), and in extreme cases, the 97.00 (psychological level).
Today, consider shorting the US Dollar Index around 98.57; Stop loss: 98.70; Target: 98.10; 98.00
WTI Crude Oil
WTI crude oil traded in a narrow range on the first trading day of 2026, currently hovering around $57-58. The core contradiction in this market is clear: the risk premium from geopolitical friction is providing support, but a stronger dollar, coupled with inventory accumulation and increased drilling activity, is limiting the rebound. Oil prices are more like "taking a breather after the decline" rather than immediately returning to a one-sided trend. Previously, crude oil prices recorded their biggest annual drop in five years, and the market is weighing the upcoming OPEC+ talks against the evolving geopolitical situation. The cartel is scheduled to hold a virtual meeting on January 4th, and the organization is expected to maintain its November agreement to suspend further production increases. Geopolitical developments remain a key backdrop as Washington increases pressure on Venezuela's energy sector and targets Chinese and Hong Kong companies and vessels suspected of circumventing export restrictions. Furthermore, tensions between Russia and Ukraine escalated during the New Year period, with both sides striking Black Sea port facilities and disrupting key energy infrastructure. Additionally, the market noted that global supply and storage levels remain ample, while reduced holiday travel demand last week may put downward pressure on prices.
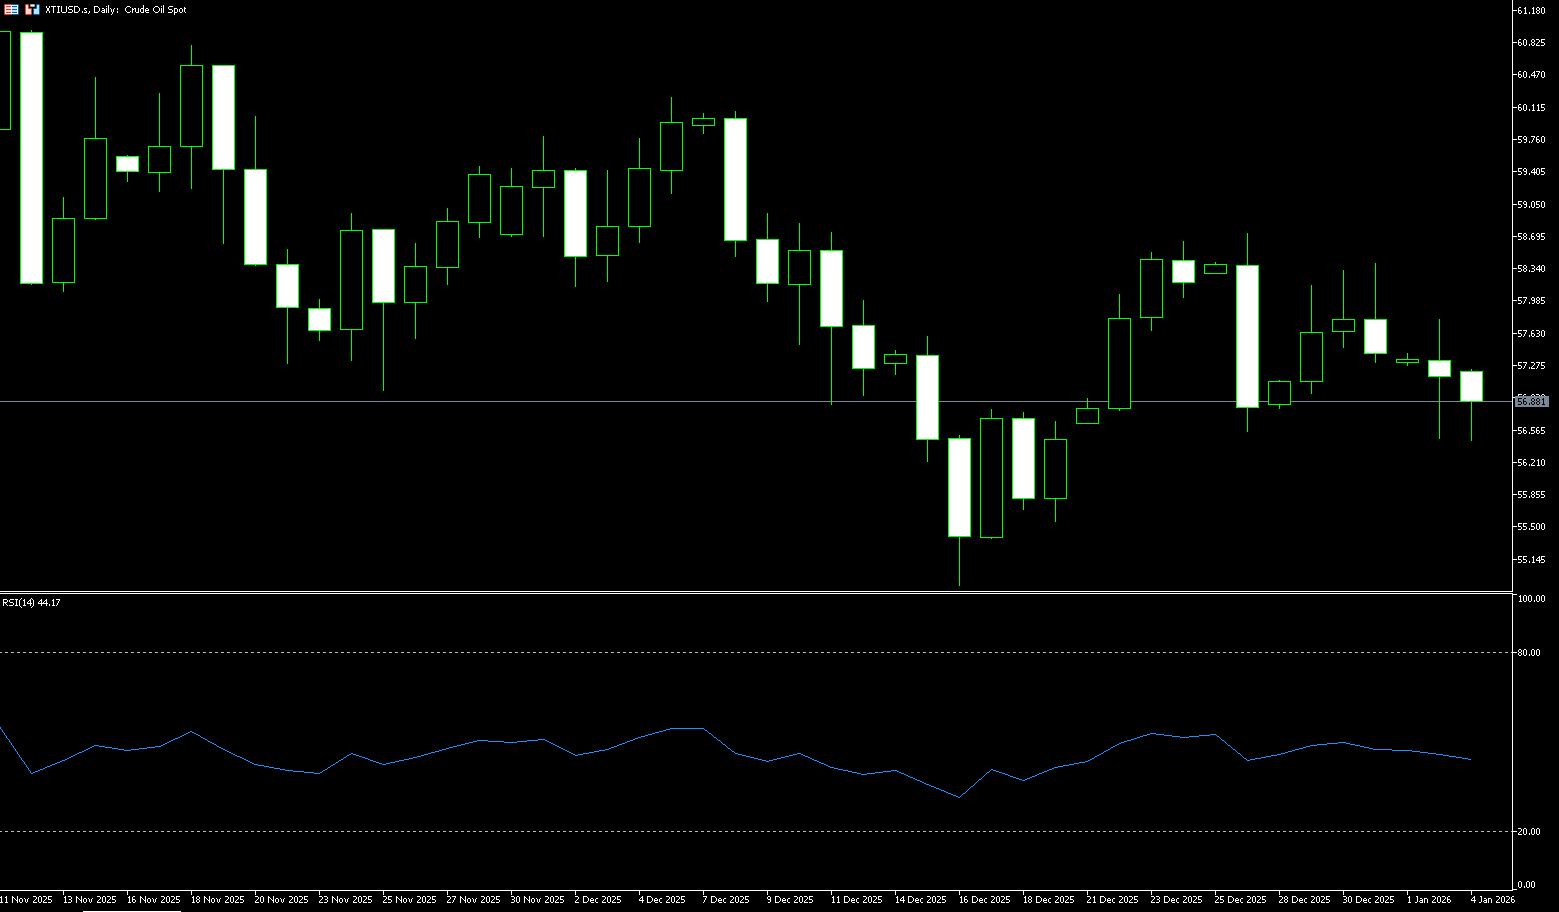
The daily chart shows that US crude oil experienced a significant technical rebound after forming a recent low around $54.88, with a short-term pattern resembling a V-shaped reversal followed by a pullback. The current price is between two key levels: $55.36 (lower Bollinger Band) and $58.75 (50-day moving average). In terms of indicators, the MACD momentum is recovering, but the medium-term trend of a bearish bias around the zero line has not yet reversed. In other words, the bulls have the will to attack, but it is not yet time to completely reverse the situation. The market is more likely to follow a pattern of "rising for a while and then pausing for a while". The RSI (14) is about 46.05, close to the midline, indicating that the market is neither extremely overbought nor extremely oversold, and the sentiment is neutral. Combined with the current K-line structure, it is closer to the characteristics of range oscillation and volatility convergence. On the upside, $58.75 (50-day moving average) is the first resistance point, while $60.00 is the "watershed" that the rebound needs to overcome. Only if the oil price effectively stands above $60.00 will it be more likely to open up the upside space to test the resistance zone near $60.50 and even the previous high of $61.50. As for the downside, if the $56.58 (December 26 low) and $55.36 (lower Bollinger Band) area are breached, the next level will be $55.14 (May 5 low) and... $54.88 (December 16 low).
Consider going long on spot crude oil around $56.95 today; Stop loss: $56.80; Target: $58.20; $58.40
Spot Gold
In 2025, the global precious metals market witnessed an epic surge. Despite a significant pullback in the final week of the year, this could not overshadow the dazzling performance for the entire year. Gold's cumulative increase for the year was approximately 64%, not only the strongest performance in recent years but also the largest annual increase since 1979. Although short-term volatility exists, gold prices are expected to continue climbing in 2026, potentially reaching $5,000/ounce. The surge in gold in 2025 was the result of multiple favorable factors. First, the Federal Reserve's interest rate cut cycle played a crucial role. This significantly reduced the opportunity cost of holding gold, a non-interest-bearing asset. Simultaneously, frequent geopolitical hotspots, including the continued escalation of the Russia-Ukraine conflict, This further strengthened gold's appeal as a safe-haven asset. Global uncertainty drove investors to seek refuge in gold. Although gold prices retreated at the end of the year, the Chicago Mercantile Exchange repeatedly raised margin requirements for precious metal futures in a short period, triggering large-scale profit-taking by traders and causing prices to fall rapidly from recent highs. Low trading liquidity during the holidays further amplified volatility. In short, while the precious metals boom of 2025 ended with a correction, it laid the foundation for broader upside potential in 2026. Gold led the way, with silver and other metals following closely behind. This supercycle is now attracting increasing attention.
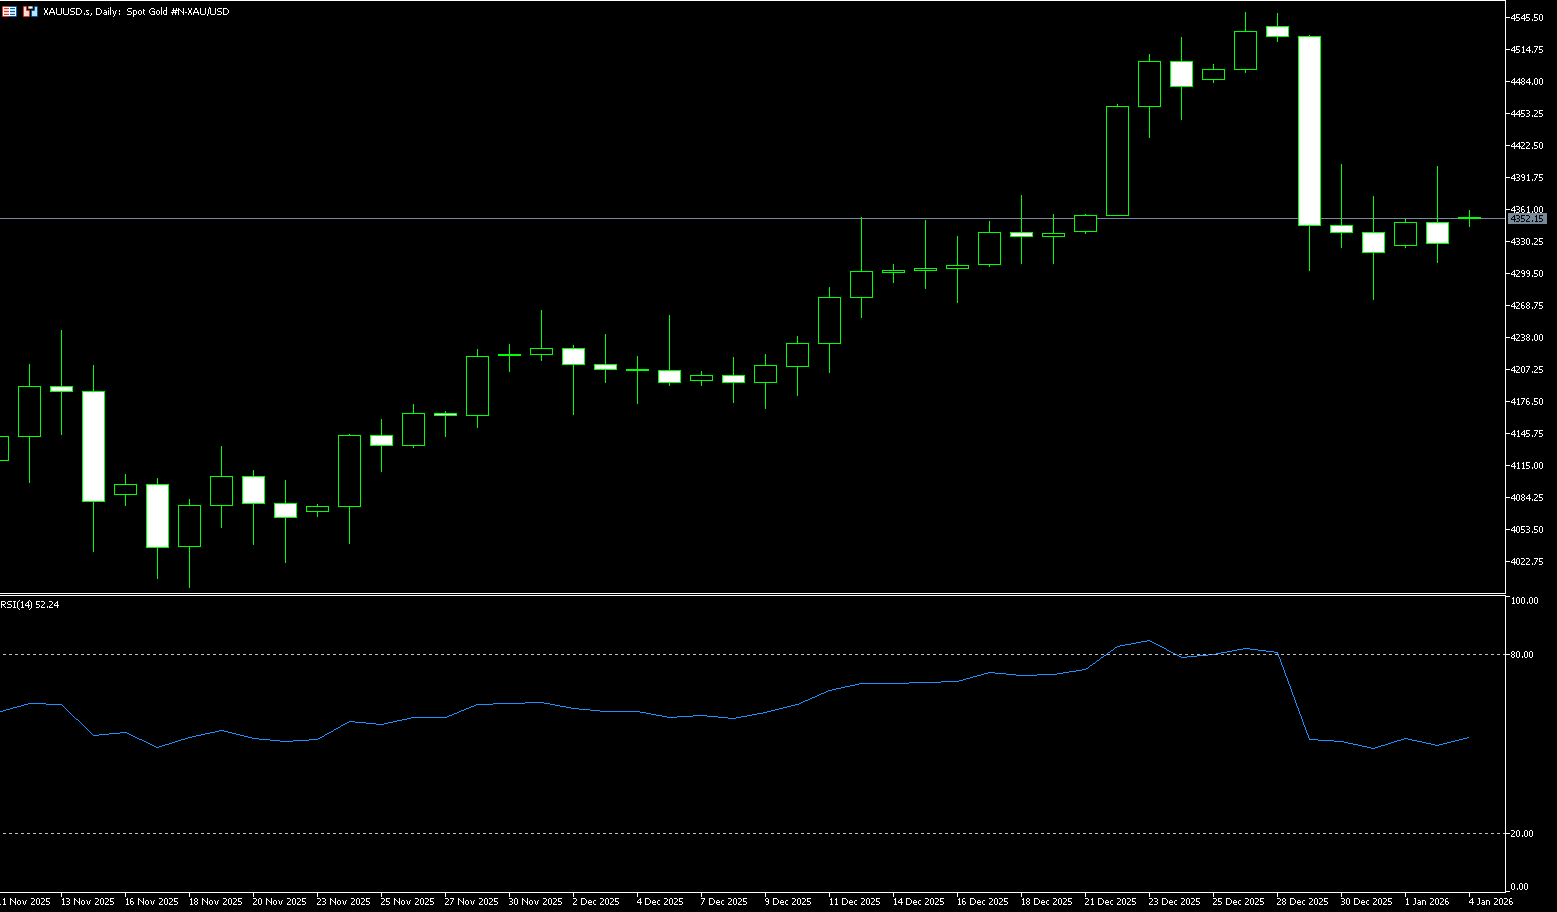
While the long-term bullish outlook remains unchanged, gold prices may experience months of consolidation before resuming their upward trend. Even so, the gold market is still projected to record a substantial annual gain. The strong upward trend throughout the year, constantly setting new highs and lows, has resulted in its best annual performance in over forty years, with an overall increase of approximately 65%. Based on the daily chart, the downside potential for gold appears limited. Therefore, the bullish outlook remains intact, with gold prices holding above the key 50-day simple moving average of $4,185. Gold is trading above the $4,147.70 area (lower Bollinger Band), with the Bollinger Bands widening and the path of least resistance pointing upwards. Momentum indicators are slightly rising above the midline, while the 14-day Relative Strength Index (RSI) is pointing upwards above the midline. This indicates recent upward momentum. The broader trend backdrop remains positive, as the 100-day and 200-day simple moving averages continue to slope upwards, and the bullish tone is expected to persist. The first upside resistance levels for gold are at the $4,400 (psychological level) and $4,404 (December 30 high) area. If gold holds steady above these levels, it could potentially move towards the $4,514.70 (upper Bollinger Band). The break above the all-time high of $4,549.80 paves the way for a challenge of the psychological level of $4,600. On the other hand, initial support for gold appears in the $4,305-$4,300 area, representing the low of December 29th and the psychological level. A stronger pullback could drag gold towards the December 16th low of $4,271.
Consider going long on spot gold today around $4,325; Stop loss: $4,320; Target: $4,360. 4,370
AUD/USD
The Australian dollar ended 2025 on a strong note, gaining nearly 8%, its strongest year since 2020. With a positive start to the new year, the Australian dollar is poised to be a hot currency pair in 2026, supported by expectations of a Reserve Bank of Australia (RBA) rate hike and China's economic adaptation to tariffs. Investors are awaiting next week's monthly inflation data, which could influence the RBA's policy stance, as the central bank has hinted at a possible rate hike this year. The RBA's December meeting minutes showed that policymakers are prepared to tighten policy if inflation does not ease as expected. Other points of focus include... The focus will be on the fourth-quarter CPI report released on January 28th. If core inflation data is higher than expected, it may prompt the Reserve Bank of Australia (RBA) to take action at its February 3rd meeting. The RBA cash rate is currently at 3.60%, and the market is pricing in a 30% probability of a rate hike in February, rising to 50% in March. Meanwhile, the Chinese economy is gradually adapting to the external pressure from US tariff policies. As a major trading partner of Australia, China's robust economic recovery will provide additional support for the Australian dollar.
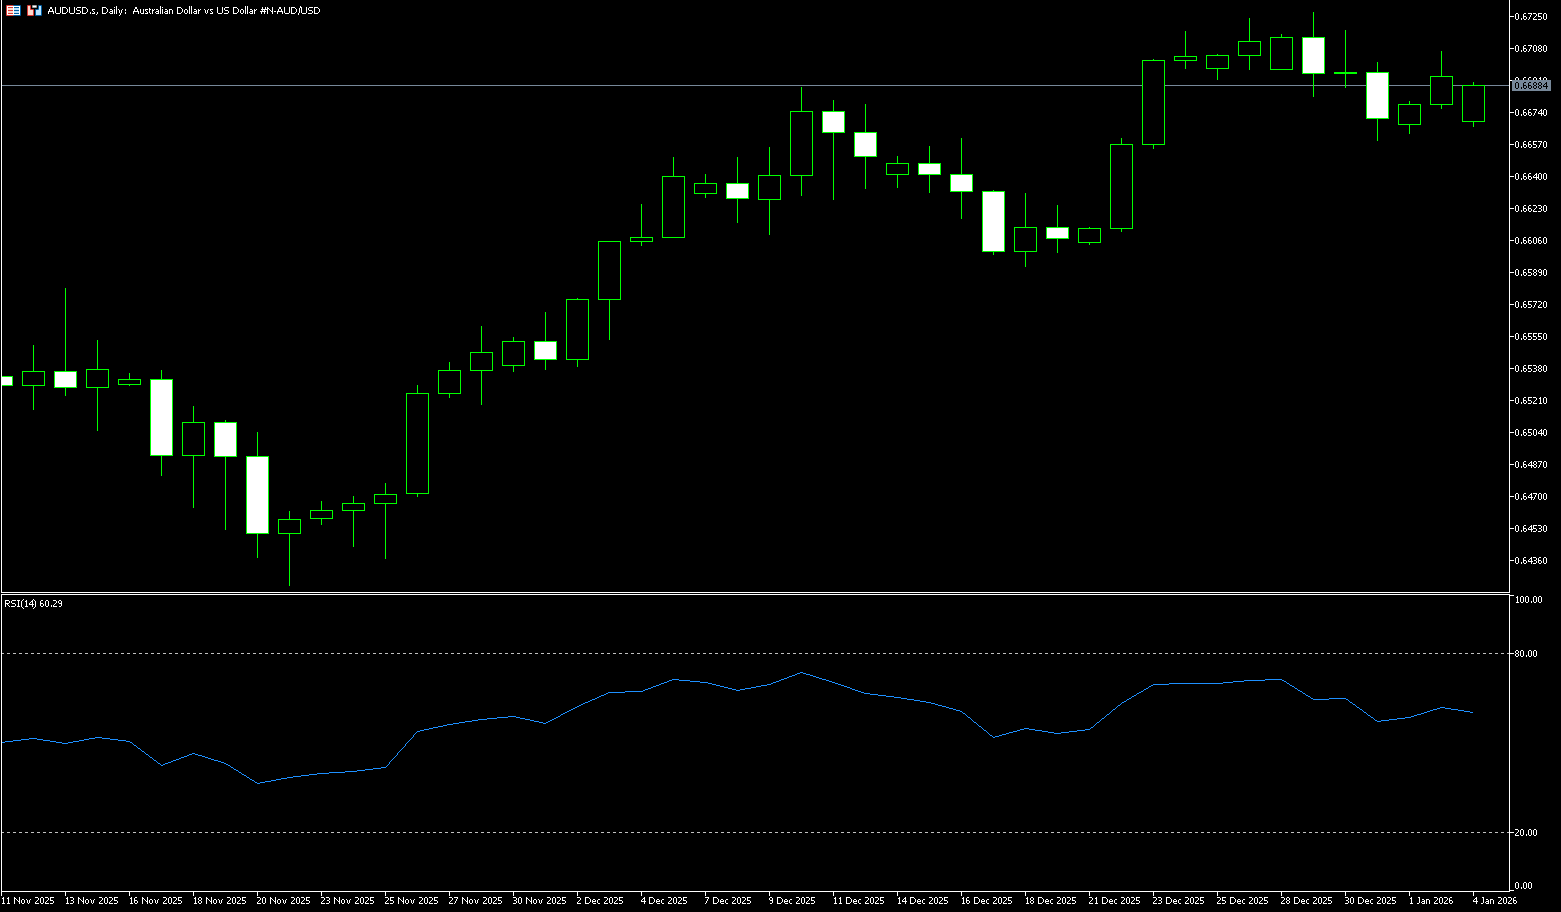
Technical analysis of the daily chart shows that the AUD/USD pair repeatedly fluctuated around the psychological level of 0.6700 last week. It is currently trading slightly below 0.6700. The currency pair is currently in an ascending channel pattern, suggesting a continued bullish bias. AUD/USD remains above the rising 20-day simple moving average at 0.6662, maintaining its short-term uptrend. This moving average has been solid in recent trading, enhancing the incentive to buy on dips. The 14-day Relative Strength Index (RSI) is near 62 and has risen slightly, but has not yet reached overbought levels. Currently, AUD/USD is testing immediate resistance at the psychological level of 0.6700, followed by 0.6727, the highest level since October 2024, reached on December 29th, and the 0.6731 area (the upper Bollinger Band). A further break above the latter would support the pair exploring the area near the upper boundary of the ascending channel, targeting 0.6770 (the high of October 8th last year), and further towards the psychological level of 0.6800. On the downside, initial support lies at the 20-day simple moving average at 0.6663, and... The 0.6659 area (last week's low) is a key level to watch. A break below this level would open up opportunities for the AUD/USD pair near the 34-day simple moving average (around 0.6607) and the psychological level of 0.6600.
Consider going long on the AUD today around 0.6683; Stop loss: 0.6670; Target: 0.6730. 0.6740
GBP/USD
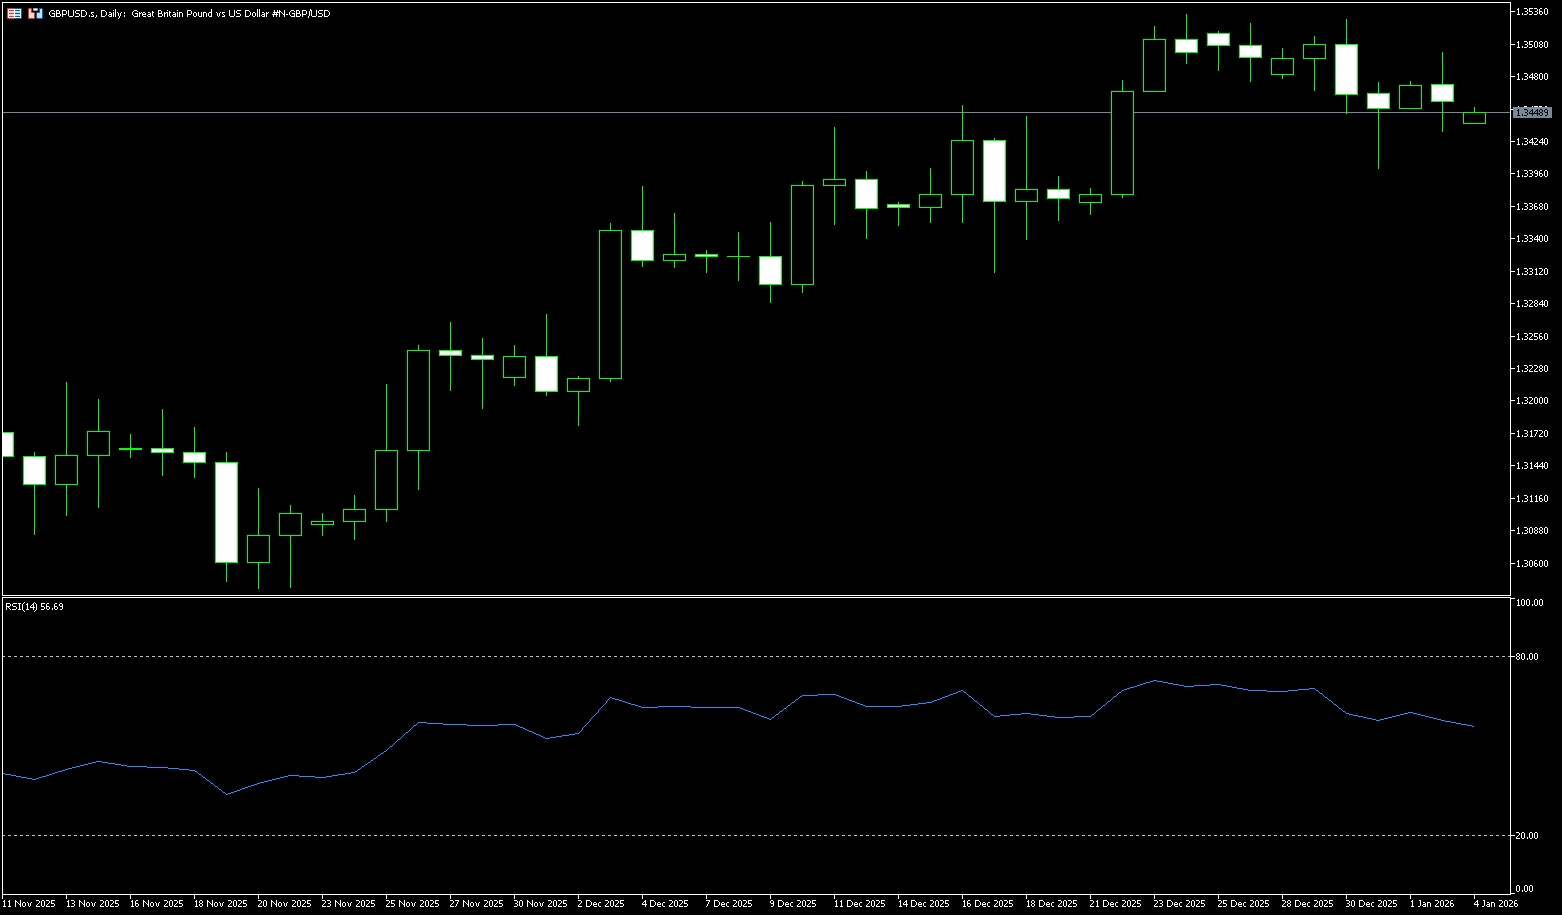
Ending 2025 on a positive note, GBP/USD experienced a turbulent year, rising approximately 7.5% from a near 15-month low to a near four-year high. The divergence in monetary policy expectations between the Federal Reserve and the Bank of England, a bleak UK economic outlook, and political instability will influence the pair's price action in 2026. The pound is expected to begin another meaningful and optimistic year with the dollar in early 2026. The GBP/USD pair is anticipated to face a gloomy UK economic outlook and geopolitical risks, while the prospect of a divergence in monetary policy between the Federal Reserve and the Bank of England could provide support. Last week, GBP/USD traded at $1.34. Above, this signifies a 7.5% appreciation against the dollar in 2025, the largest annual gain since a 9.5% appreciation in 2017. The pound benefited from the divergence in interest rate cut expectations between the Bank of England and the Federal Reserve in 2026, as well as a relatively lackluster autumn budget, which eased pressure on the pound in the latter half of the year. The Bank of England cut rates four times in 2025, despite policymakers' differing opinions and indications that the already gradually slowing pace of cuts might slow further. In the US, investors anticipate further easing in 2026 due to signs of a slowing labor market. Domestic political concerns and stagnant economic growth in the UK capped the pound's gains.
In the final quarter of the year, GBP/USD was at 1.3010 {the low on November 5th last year}. Strong support was found in the 1.3000 psychological support area as the dollar suffered another blow. Looking at the monthly timeframe, the pair has formed an ascending triangle pattern in 2025, with the resistance path in early 2026 appearing upwards. In this scenario, pound bulls must break through the horizontal trendline resistance around 1.3785 to confirm the triangle breakout. Acceptance above this barrier would push the bulls initially towards 1.3534 (the high of December 24th last year). The 14-day Relative Strength Index (RSI) is currently near 60, indicating that the market's upward momentum is neither overheated nor weak. The MACD pattern suggests that the pound/dollar pair's upward momentum remains strong, with bulls dominating. However, the psychological level of 1.3600 may pose an initial challenge for the bulls. The next key level is the trendline resistance at 1.3785. Additionally, the psychological level of 1.3400... The immediate support level is within the converging range of the -1.3368 {100-day simple moving average}, which, if challenged, could trigger a tactical pullback on any retracement. This area corresponds to the 1.3301 {lower Bollinger Band} and the 1.3300 {psychological level}.
Consider going long on GBP/USD today around 1.3445; Stop loss: 1.3433; Target: 1.3480; 1.3490
USD/JPY
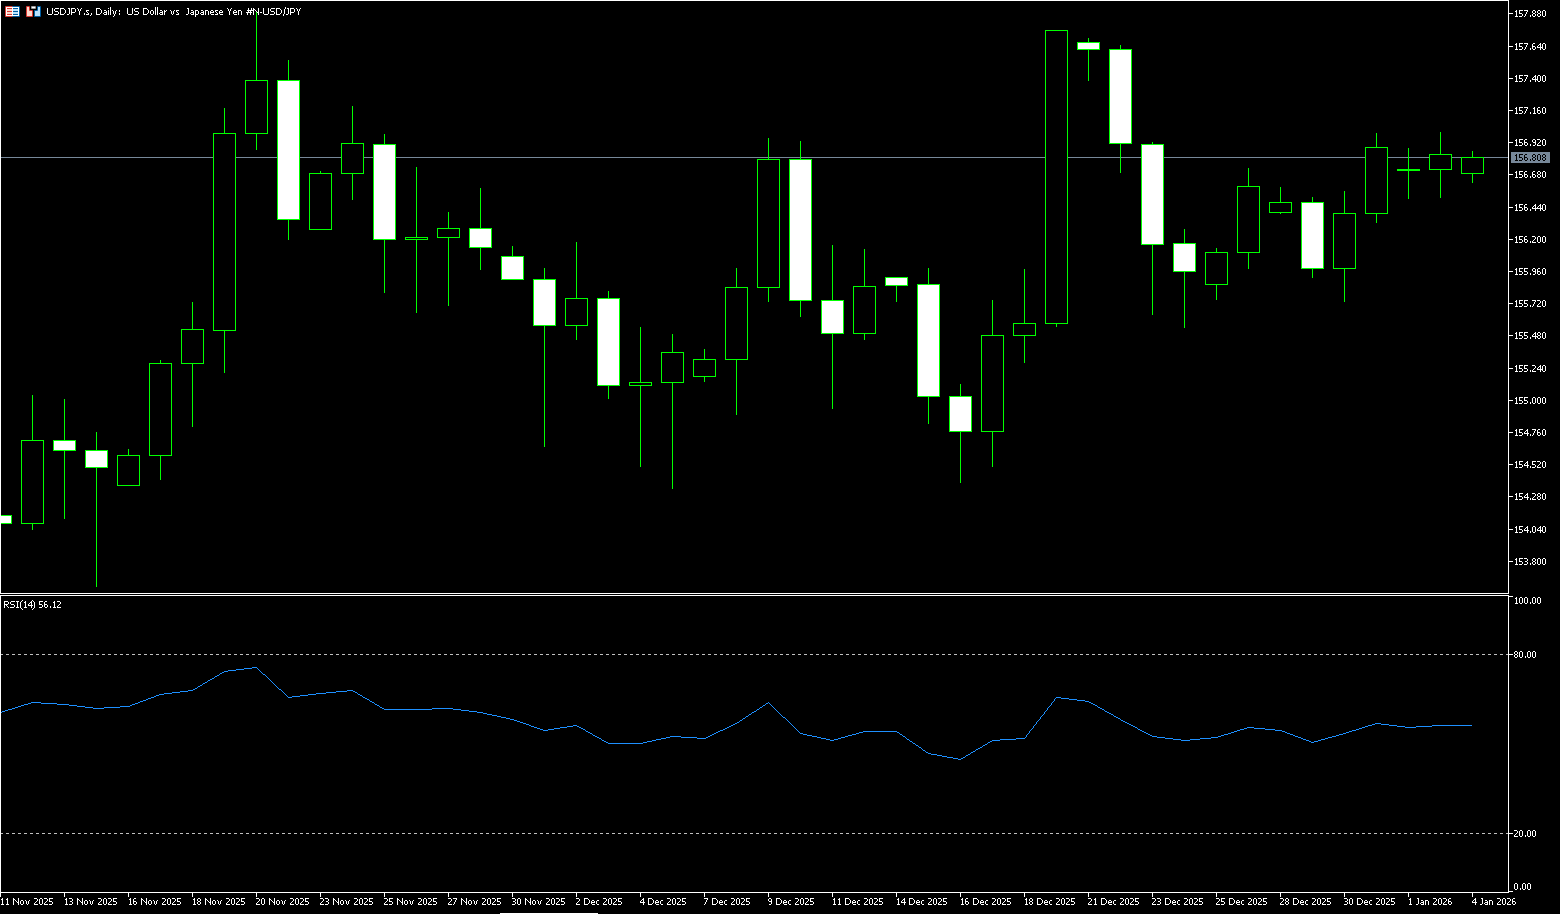
The yen stabilized slightly below 157 against the dollar last week in the final week of 2025, though it remained near a ten-month low, fueling calls for intervention. Verbal warnings from Tokyo last month briefly pulled the yen away from intervention territory, with Finance Minister Katayama emphasizing Japan's freedom to combat excessive volatility, despite lingering concerns about further depreciation. The yen ended 2025 with a modest gain of 0.3%, reversing four years of depreciation after two rate hikes this year. The start of 2026 for the yen may be overshadowed by intervention. The Japanese government is deeply dissatisfied with the continued rise of the USD/JPY exchange rate. Although the Bank of Japan raised its overnight rate to 0.75% in December 2025, a new high since 1995, it has failed to effectively suppress yen short positions, and the USD/JPY exchange rate was still fluctuating around 155.80 as of December 30. The Bank of Japan's meeting minutes show that most members support maintaining a tight monetary policy path until 2026, potentially leading to another 25 basis point interest rate hike. The Finance Minister has also signaled verbal intervention, suggesting either an accelerated monetary tightening cycle or direct intervention in the foreign exchange market, becoming the key focus for the yen's exchange rate movement.
Overall, the strength of the USD/JPY pair stems largely from the difference in the pace of monetary policy between the US and Japan. With the Bank of Japan remaining cautious and the Federal Reserve yet to clearly initiate rapid easing, the exchange rate is more likely to rise than fall. However, it's important to be wary of the Japanese government's close attention to the exchange rate, which means that if the yen depreciates too rapidly, the risk of policy intervention will increase significantly. In the short term, the USD/JPY pair may maintain a high-level, slightly bullish trend, but the risk of a pullback should not be ignored at key resistance levels. From a daily chart perspective, the USD/JPY pair maintains a clear upward trend. The exchange rate continues to trade above major moving averages, with short- and medium-term moving averages in a bullish alignment, providing support. The 14-day Relative Strength Index (RSI) is at a high of 56.67, but has not yet entered the extreme overbought zone, indicating that upward momentum remains, but short-term volatility risk has increased. Resistance is seen in the 157.51 (upper Bollinger Band) – 157.89 (November 20 high) area. A decisive break above this level could open up further upside potential to 158.00 (psychological level), while a break below that would target 158.88 (January 20th high). Support lies in the 156.15 (34-day simple moving average) – 156.00 (psychological level) area. A break below this level could trigger a technical pullback to the upper Bollinger Band at 154.87.
Today, consider shorting the US dollar near 157.05; Stop loss: 157.28; Target: 156.30; 156.10
EUR/USD
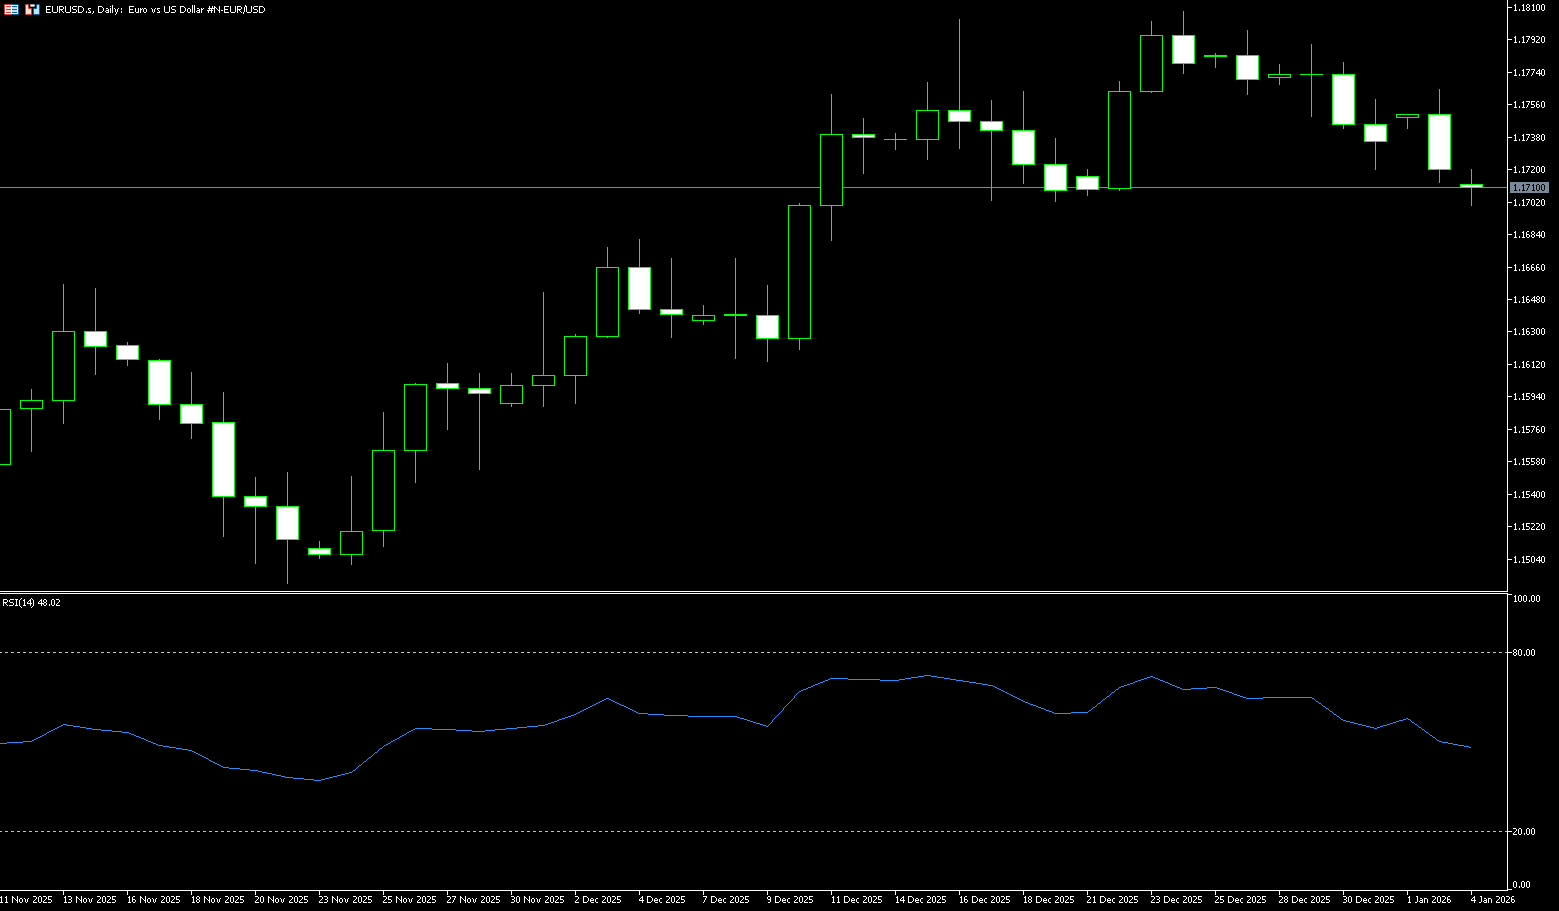
Last week, EUR/USD traded in positive territory above 1.1700. The European Central Bank kept interest rates unchanged at its December monetary policy meeting, suggesting a reduced urgency for further rate cuts, which provided some support for the euro against the dollar. Regarding the dollar, the market expects US President Trump to nominate a dovish successor to replace Federal Reserve Chairman Jerome Powell, whose term ends in May. This could drag the dollar down and create tailwinds for major currency pairs. Currently, at the beginning of 2026, the euro/dollar exchange rate has stabilized above 1.1730, rebounding sharply by more than 17% from its 2025 lows, with a full-year gain of over 13%, approaching a four-year high. This strong performance stems from the gradual resilience of the Eurozone economy and the significant divergence in global monetary policy paths. Currently, EUR/USD is consolidating below a key technical resistance level, forming a poised-for-breakout pattern. A break above this multi-year resistance could trigger a new upward wave, resuming the bullish long-term trend. The Eurozone economy is projected to grow by 1.4% in 2025, higher than previously expected; and by 1.2% in 2026. Internal divisions within the Federal Reserve are widening: in stark contrast to the ECB's prudent approach, the Fed's policy path is fraught with uncertainty. Expectations for rate cuts in 2026 are narrowing. Unless the central bank continues to lower interest rates next year, the US faces the risk of a recession.
On the daily chart, EUR/USD is trading above 1.1700. The 100-day simple moving average is sloping upwards to 1.1665, and the pair remains above it, maintaining a medium-term bullish bias. The 14-day Relative Strength Index (RSI) has risen to 51.75, confirming improved momentum and no overbought conditions. Momentum indicators remain above the midline, albeit slightly slowing, indicating steady buying interest. Holding above the 34-day simple moving average at 1.1674 will maintain the integrity of the upward path. The Bollinger Bands are narrowing, suggesting reduced volatility after the recent rebound. Meanwhile, the pair is trading above all moving averages, with the 34-day simple moving average above the 100-day and 200-day simple moving averages, all three sloping upwards, reinforcing the bullish bias. The 20-day simple moving average provides dynamic support near 1.1674. A decisive break above 1.1789 (last week's high) and the 1.1800 (psychological level) area would reactivate upward momentum towards 1.1850, the upper boundary of the ascending channel and a previous significant high. Further down the line is the 1.1918 (September 17 high) level. If the currency pair falls below the 100-day simple moving average at 1.1665, it will expose the psychological level near 1.1600. Overall, momentum and trend signals support buying on dips before volatility increases.
Consider going long on the Euro today around 1.1704; Stop loss: 1.1690; Target: 1.1750; 1.1760
Disclaimer: The information contained herein (1) is proprietary to BCR and/or its content providers; (2) may not be copied or distributed; (3) is not warranted to be accurate, complete or timely; and, (4) does not constitute advice or a recommendation by BCR or its content providers in respect of the investment in financial instruments. Neither BCR or its content providers are responsible for any damages or losses arising from any use of this information. Past performance is no guarantee of future results.
More Coverage


Risk Disclosure:Derivatives are traded over-the-counter on margin, which means they carry a high level of risk and there is a possibility you could lose all of your investment. These products are not suitable for all investors. Please ensure you fully understand the risks and carefully consider your financial situation and trading experience before trading. Seek independent financial advice if necessary before opening an account with BCR.
BCR Co Pty Ltd (Company No. 1975046) is a company incorporated under the laws of the British Virgin Islands, with its registered office at Trident Chambers, Wickham’s Cay 1, Road Town, Tortola, British Virgin Islands, and is licensed and regulated by the British Virgin Islands Financial Services Commission under License No. SIBA/L/19/1122.
Open Bridge Limited (Company No. 16701394) is a company incorporated under the Companies Act 2006 and registered in England and Wales, with its registered address at Kemp House, 160 City Road, London, City Road, London, England, EC1V 2NX. This entity acts solely as a payment processor and does not provide any trading or investment services.

 English
 简体中文
简体中文
 繁體中文
繁體中文
 Bahasa
Melayu
Bahasa
Melayu
 Tiếng
Việt
Tiếng
Việt
 ไทย
ไทย
 日本語
日本語
 한국어
한국어
 ភាសាខ្មែរ
 español