


0
Currency & Commodity Analysis:
US Dollar Index
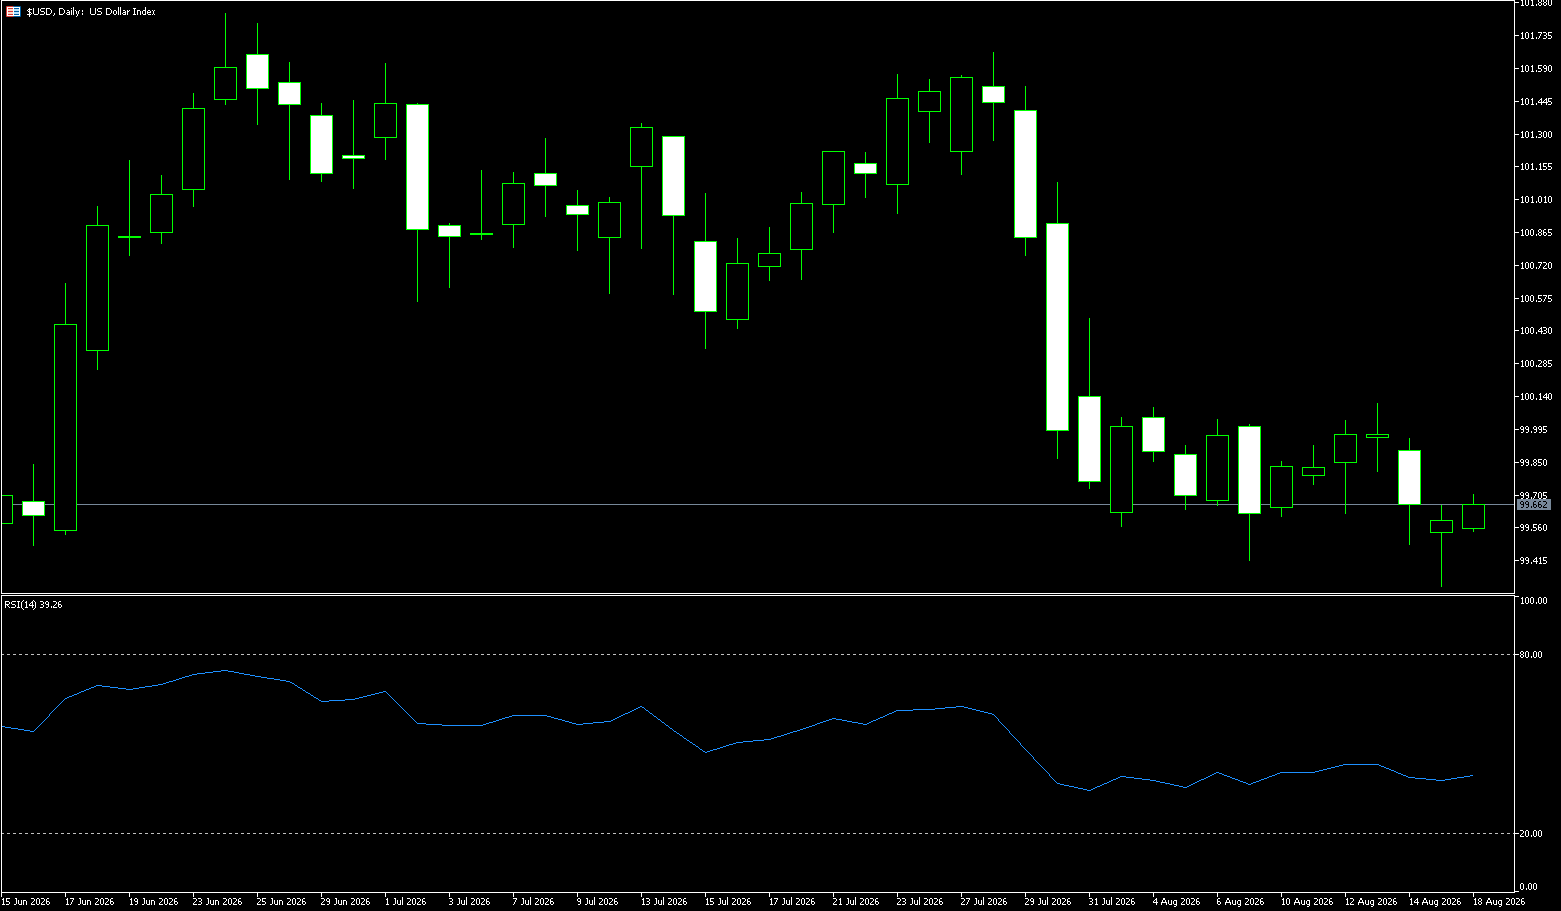
The US dollar index fell at the beginning of the week, briefly touching a two-month low of 99.30. This was influenced by weak data including the first decline in US retail sales in nine months in July, an unexpected drop in non-farm payrolls, and moderate inflation. Traders significantly lowered their expectations for a Fed rate hike (the probability of a September rate hike fell from 52.2% a week earlier to 30.6%). Market concerns about US economic growth and interest rate policy are prevalent, while net long positions in the dollar are extremely large and were squeezed in late August. Investors are preparing for next week's Jackson Hole symposium by the Federal Reserve for policy clues. The dollar weakened against the euro and the Swiss franc. The euro hit a two-month high against the dollar, rising 0.08% to close at $1.1578. The dollar fell 0.34% against the Swiss franc to 0.81085. The dollar edged up 0.11% against the yen to 159.49, erasing earlier gains, as Japan's second-quarter economic growth of 1.1% at an annualized rate was weaker than expected, and the intervention by US and Japanese authorities in the currency market in late July to curb the yen's depreciation. Morgan Stanley believes that although the market has already priced in a more aggressive rate hike by the Bank of Japan, global risk appetite and expectations for the Federal Reserve's final interest rate could still push the dollar higher against the yen.
The dollar's recent reaction to inflation data has been mixed. While slower consumer price inflation has boosted it, producer price inflation slowed from 5.5% to an annualized rate of 4.7%, weakening the dollar. Forward markets expect interest rates to remain unchanged until December, putting pressure on the dollar index. The dollar index rose slightly after three consecutive days of declines, trading around 99.60 in Asian trading on Tuesday. The US dollar index received slight support from safe-haven demand, likely due to geopolitical tensions between the US and Iran. The dollar index traded near 99.60, remaining below the 9-day (99.79) and 20-day (100.25) exponential moving averages (EMAs), indicating a continued short-term bearish bias. The structure of short- and medium-term EMAs above the spot price suggests continued downward pressure, while the 14-day Relative Strength Index (RSI) at 38.51, still below the midline, suggests ongoing downward pressure despite the absence of clear oversold readings. Support levels to watch are Monday's low of 99.30 and the 99.00 psychological level; resistance levels to watch are 99.80 (the 14-day exponential moving average) and 100.00 (a psychological level).
Today, consider shorting the US Dollar Index at 99.75, with a stop-loss at 99.85 and targets at 99.30 and 99.40.
WTI Crude Oil
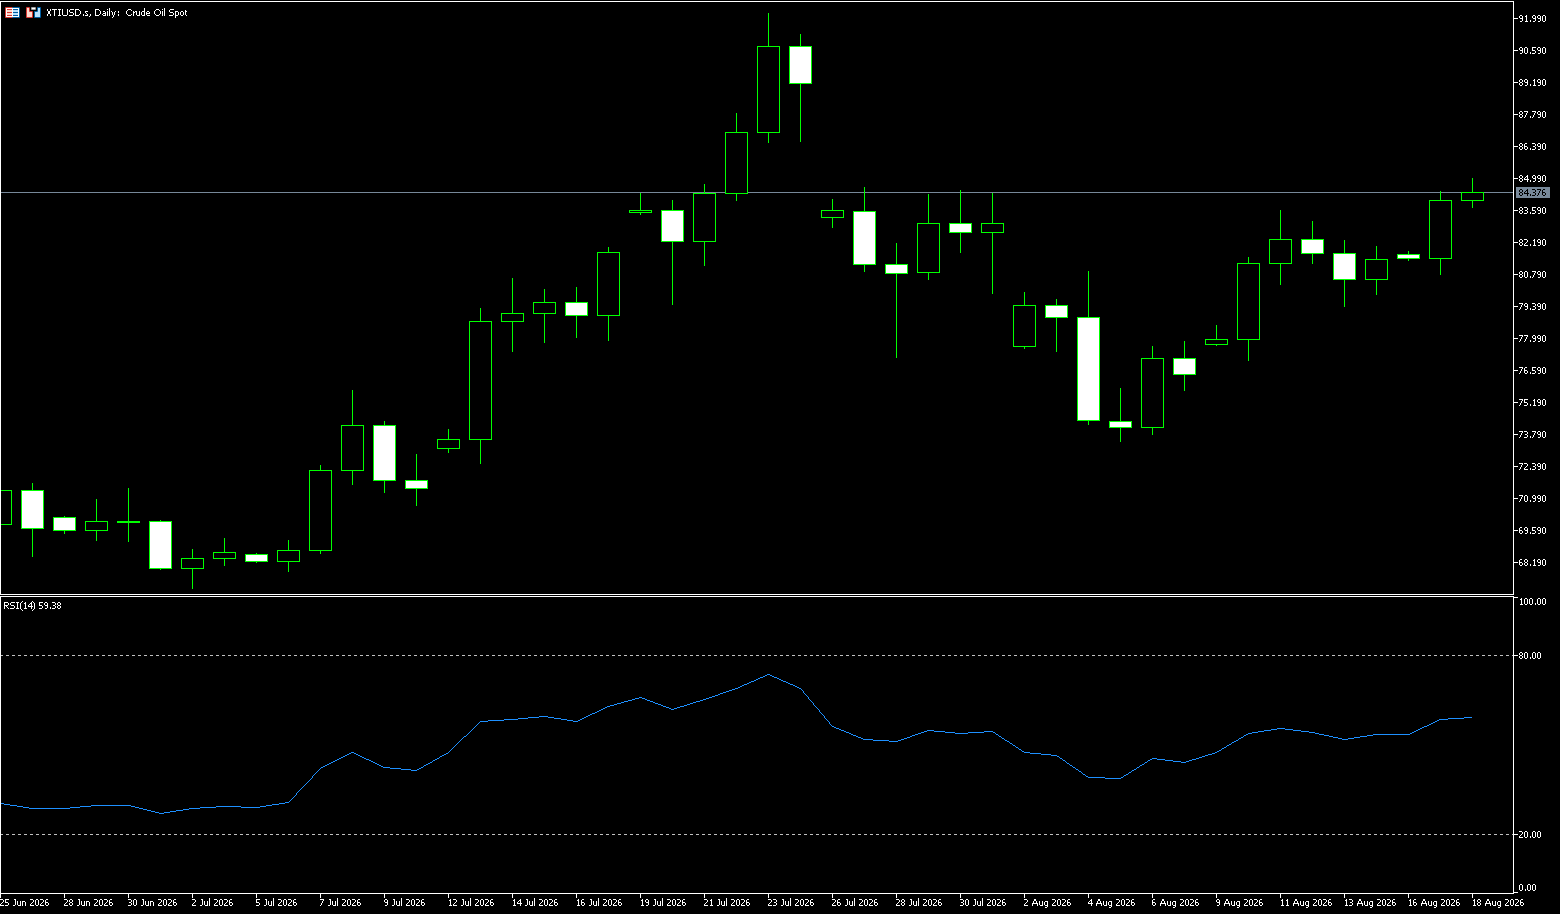
On Tuesday morning in Asian trading, WTI crude oil traded near $84.00 per barrel. WTI crude oil rose over 3% on Monday, briefly touching the near three-week high of $84.40 per barrel. The situation between the US and Iran continues to deteriorate, with Trump calling on Iran to "raise the white flag and surrender" and threatening bombing if Oman intervenes in the Strait of Hormuz. Iran has decided to shift its policy "from defensive to all-out offensive." Monday marked the original deadline for the final US-Iran agreement (the interim peace memorandum signed on June 17th became a key turning point in the conflict, stipulating a broader agreement on Iran's nuclear program and US sanctions within 60 days, and promising an "immediate and permanent cessation of military operations on all fronts"). However, the US explicitly ruled out the possibility of extending the interim ceasefire agreement. In the short term, oil prices remain driven by geopolitical news. If the extension agreement is finalized and no new military actions are taken, oil prices may continue to retrace some of their geopolitical premium; however, the Hormuz transit has been weak, supply concerns remain, and the downside is limited.
From a daily chart perspective, WTI is currently in a phase of both rebound and medium-term resistance. Oil prices have regained above the Bollinger Band midline of $81.69, indicating a recovery in short-term buying, but the overall trend is still suppressed by the 100-day simple moving average at $86.21, a crucial technical level for determining whether this rebound can develop into a trend reversal. The 14-day Relative Strength Index (RSI) is around 56, having regained the 50 midline, indicating a moderate strengthening of market momentum, but not yet reaching a significantly overbought level. Therefore, if new supply risks emerge from the fundamentals, there is still room for further upward movement. The first resistance level to watch is the $85 psychological level, followed by the approximately 100-day simple moving average at $86.21. If WTI can effectively break through and hold above $86.21, the market may further test the upper Bollinger Band near $90, at which point the medium-term bearish structure will face a significant challenge. Conversely, if the price encounters resistance again near the 100-day simple moving average, it indicates that there is still significant overhead resistance and technical selling pressure, and oil prices may return to the $83.27 area (75-day simple moving average) to find support. If this level is breached, the next important support area will shift down to the psychological level of $80.00, at which point the market structure will revert to a bearish bias.
Consider going long on crude oil today at $84.15, with a stop loss at $83.98 and targets of $87.00 and $86.00.
Spot Gold
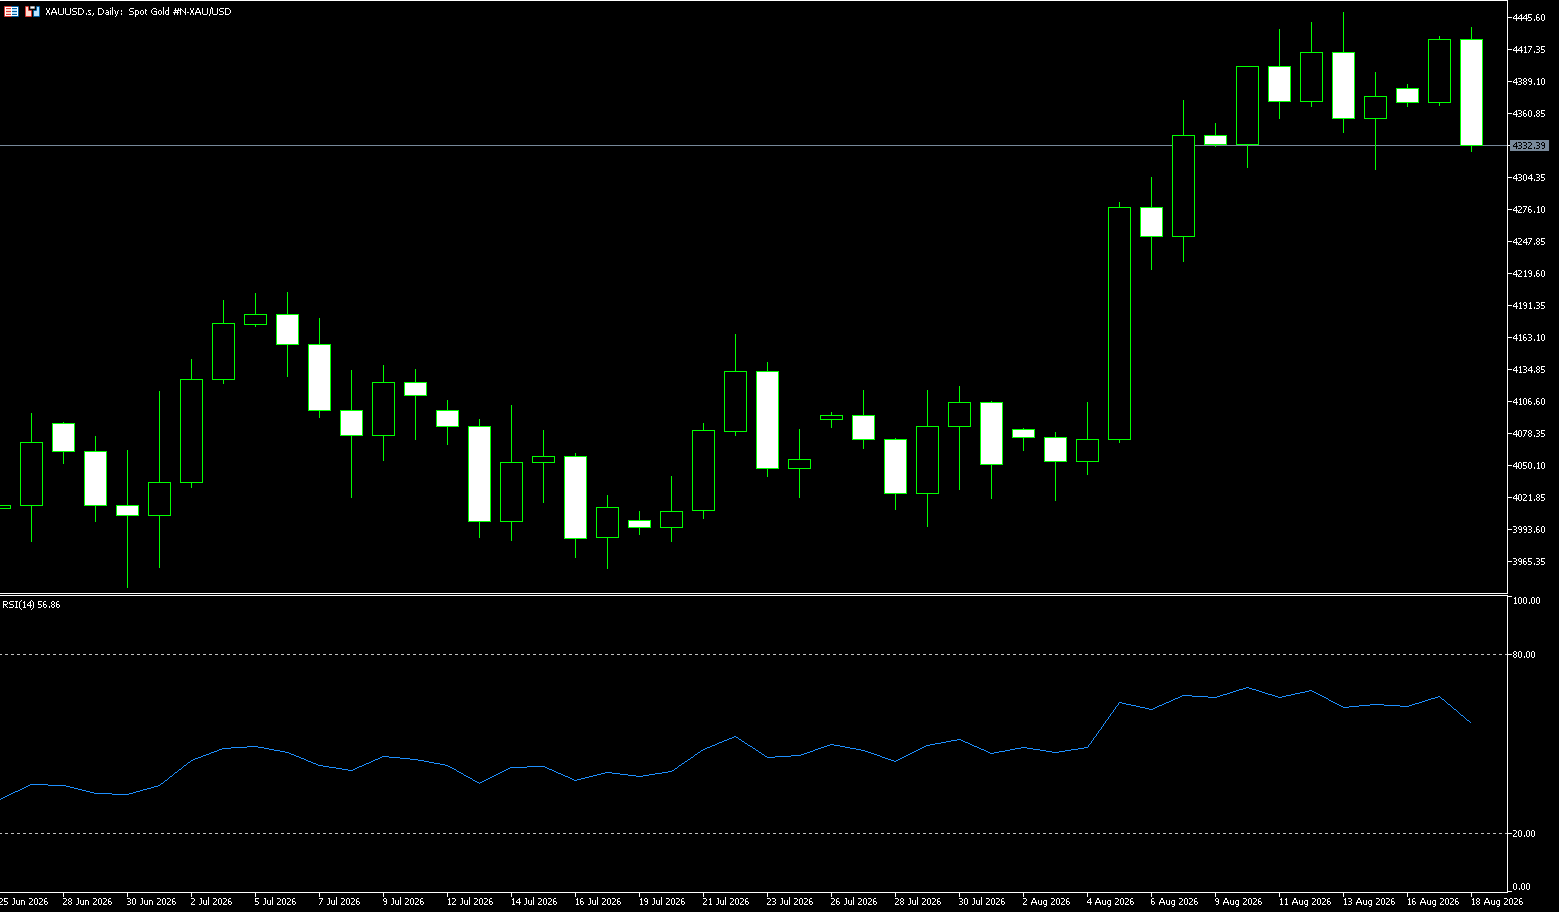
On Tuesday, gold prices fell below $4,350 per ounce, reversing earlier gains, as global bond yields surged to multi-year highs, exacerbating concerns about massive government spending and persistent inflationary pressures, leading to a broad pullback in the metals market. Metal prices were also pressured by rising oil prices, bringing inflation risks and interest rate concerns into focus. This comes as prospects for a new agreement between the US and Iran dimmed, with President Trump indicating he had no intention of extending the interim peace agreement. Meanwhile, gold continued to be supported by diminished expectations of a Federal Reserve rate hike, following a series of weak US economic data releases. The market now expects the Fed to keep policy unchanged in September and no longer fully anticipates a rate hike before the end of the year, a stark contrast to expectations just a week ago. Gold is also supported by strong investment demand and continued central bank purchases, particularly from China.
From a daily chart perspective, spot gold currently maintains a relatively clear short-term bullish structure, with prices trading above the 100-day simple moving average at 4,385 and the Bollinger Band middle line at 4,211, indicating that the medium-term trend remains positive. The current price is around $4,400, with the 100-day moving average forming the first important support level. If gold prices can continue to hold above this level, the bullish structure will not be significantly damaged in the short term. Meanwhile, the Relative Strength Index (RSI) for the 14-day period is approximately 63.37, approaching overbought territory, indicating strong upward momentum. However, this also means that as prices rise further, the probability of increased short-term profit-taking is rising. The first resistance level to watch is around $4,450 (last Friday's high), which is currently the most immediate technical resistance. If gold prices can effectively break through $4,488 (the Bollinger Band), the market may extend towards the higher $4,500 (psychological level). Conversely, if gold encounters resistance around $4,488-$4,500 and experiences a significant pullback, the psychological level around $4,300 will become the first line of defense for the bulls. Once $4,300 is breached, gold prices may further test the $4,250 level.
Today, consider going long on gold at $4,322, with a stop loss at $4,316 and targets of $4,350 and $4,360.
AUD/USD
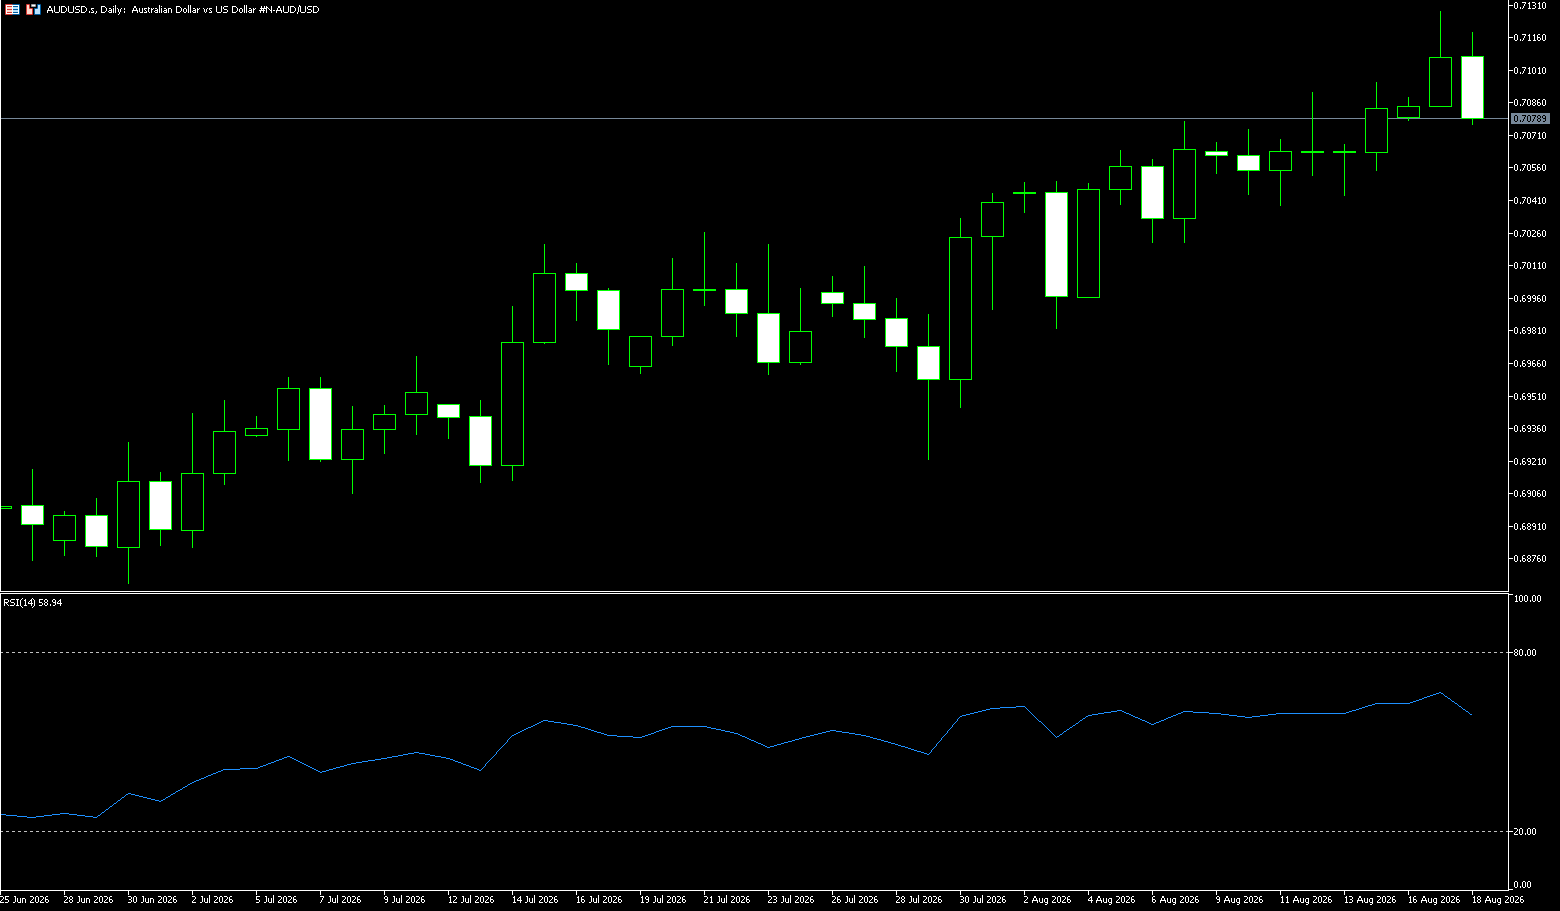
On Tuesday during the Asian session, the AUD/USD pair extended its gains for the third consecutive trading day, trading around 0.7100. The pair continued to rise as market expectations for further Fed rate hikes weakened, putting continued pressure on the US dollar. Geopolitical tensions between the US and Iran, following statements from both sides on Monday, also influenced market dynamics. US President Trump stated that he had no intention of renewing the expiring agreement with Iran, citing the continued naval blockade of Iranian ports as evidence of Washington's leverage, and reiterated his idea of declaring this key waterway as US territory under complete US control. Meanwhile, Australia's economic focus shifted to upcoming data releases that could impact the market outlook. Overall, the Australian dollar is benefiting in the short term from the cooling expectations of a Fed rate hike due to weak US economic data, with a weaker US dollar being the main driver. The RBA's hawkish policy stance and potentially stronger-than-expected Chinese economic data could provide additional support for the Australian dollar.
On the daily chart, the AUD/USD pair is trading at 0.7090, maintaining a constructive bullish bias as the current price is clearly holding above the 55-day, 100-day, and 200-day simple moving averages, which are clustered between 0.6940 and 0.7061. Immediate price action is supported by the nearby 0.7079 level, while the Relative Strength Index (RSI) is at 64.05, leaning towards overbought territory, suggesting strong upward momentum but potentially slightly overextended; meanwhile, the Average Directional Index (ADX) is low at around 11.9, indicating that despite recent gains, the overall trend remains relatively weak. On the downside, initial support is seen at 0.7079, followed by the 100-day simple moving average at 0.7062 and the 20-day simple moving average near 0.7032. On the upside, the high of 0.7149 (June 4th) presents a minor target for bulls, followed by the next significant medium-term target of 0.7200 (the psychological level).
Consider going long on the Australian dollar at 0.7078 today, with a stop loss at 0.7070 and targets at 0.7120 and 0.7130.
GBP/USD
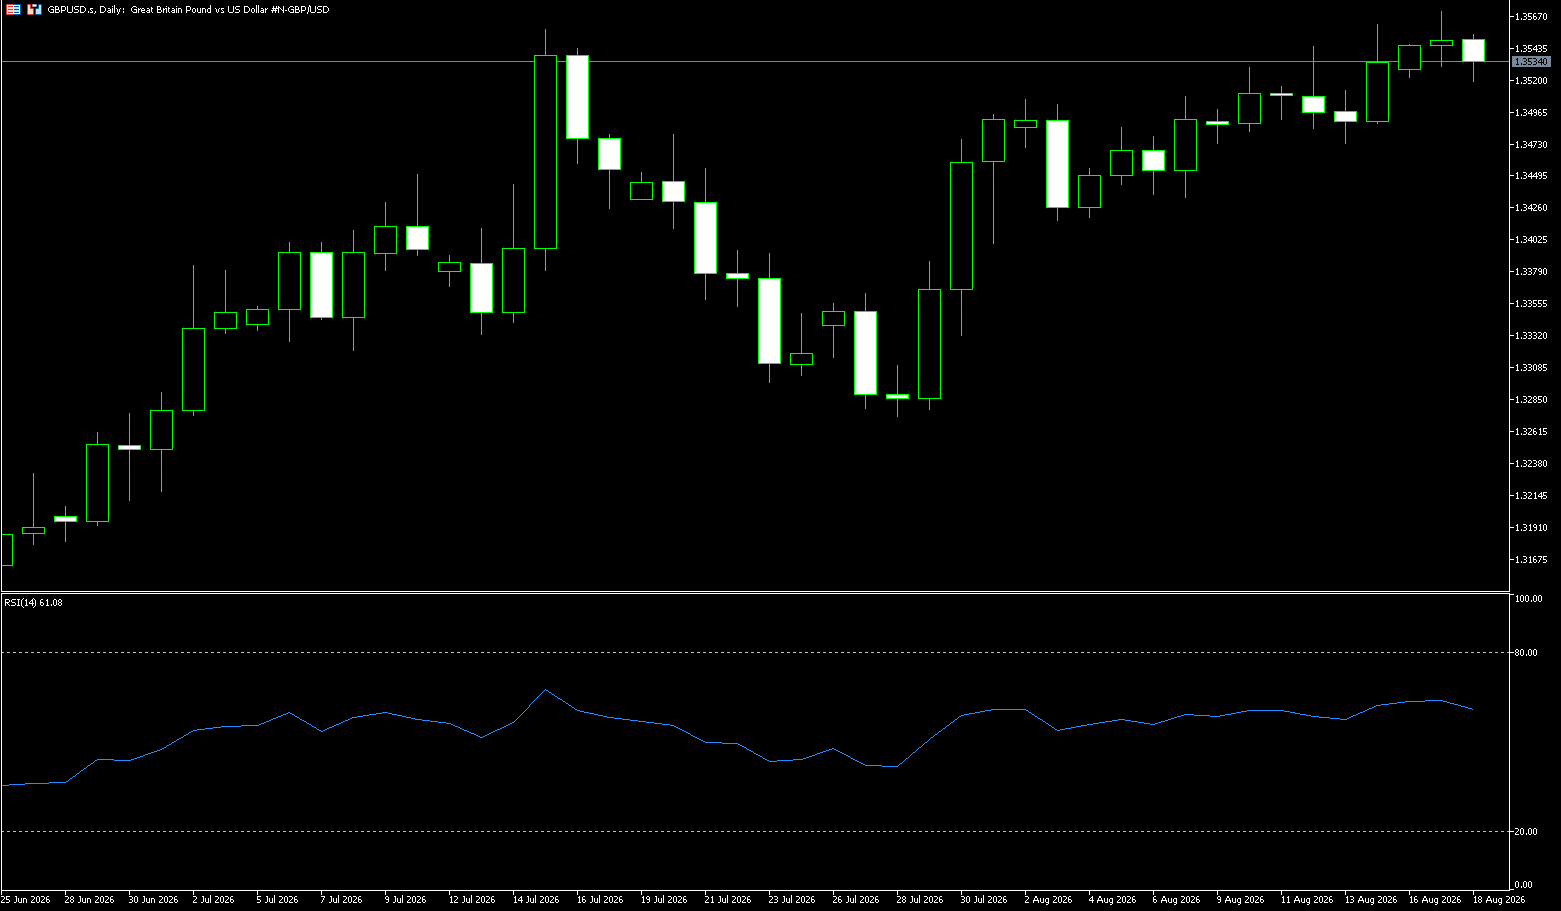
On Tuesday (August 18th) in early Asian trading, the pound rose slightly against the dollar, currently trading around 1.3540. The pound touched 1.3571 on Monday, a three-month high, but quickly gave back all gains, with a net increase of less than 10 points for the day. This surge was not due to the pound's own strength, but rather a result of a broad-based weakening of the dollar – the dollar index fell below its 200-day exponential moving average to its lowest level since June, with the euro, gold, and other assets rising in tandem, confirming that this was a dollar sell-off rather than a pound buy. This week, the UK will see a flurry of data releases, with inflation, employment, and retail sales figures putting the pound's strength to the test. The Federal Reserve will release the minutes of its July 29th FOMC meeting at 02:00 Beijing time on Thursday, the only event this week that could potentially rebuild the interest rate premium lost by the dollar over the past two weeks. The market's focus is on how closely the remaining committee members align with the three dissenters who support a 25 basis point rate hike.
From a daily chart perspective, the GBP/USD pair maintains a clear upward trend, with the exchange rate regaining its position above 1.3520 and continuing to trade above the recent upward channel. Having previously reached a more than three-month high, the recent pullback has seen renewed buying interest, indicating that bulls remain in control. As long as the exchange rate can hold above 1.3500, the daily uptrend structure will not be significantly disrupted in the short term. The first resistance level to watch is 1.3600, a key psychological resistance that bulls need to overcome for further gains. A successful break above and sustained hold above this level on the daily chart could see GBP/USD further test the previous high of 1.3658 (May 1st), opening up new upside potential. However, if significant profit-taking occurs near 1.3600, the pair may enter a period of high-level consolidation in the short term. The first support level to watch is around 1.3500, a key psychological level that also forms a significant dividing line between bulls and bears in the near term. A break below this level would target the 1.3450-1.3400 area, a crucial support zone for determining whether the current uptrend has entered a deeper correction phase.
Consider going long on GBP/USD at 1.3520 today, with a stop-loss at 1.3510 and targets at 1.3570 and 1.3580.
USD/JPY
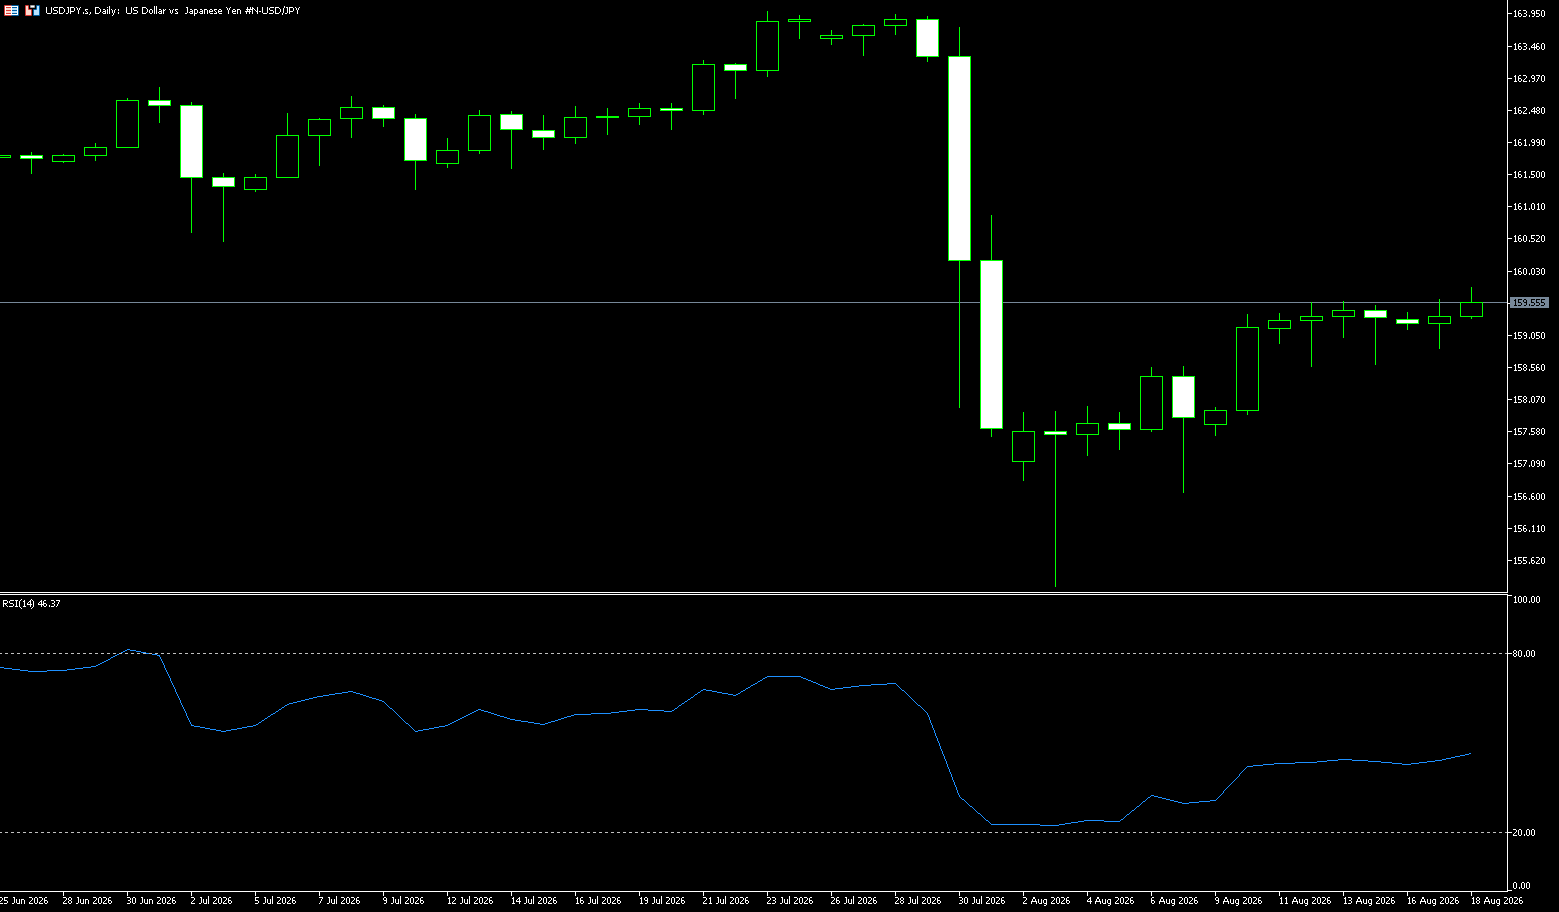
The yen fell to around 159.70 per dollar on Tuesday, erasing gains from the previous session, due to heightened fiscal concerns and persistent inflationary pressures. The Sanae Takaichi government's plan to cut the food consumption tax to 1% for two years sparked market concerns, as the government has yet to identify alternative revenue sources, and the measure is seen as an ineffective response to inflation, potentially failing to achieve lasting price stability. Markets are also worried about high energy costs, which are putting pressure on Japan's oil-dependent economy and currency. Furthermore, the yen continues to face pressure from widening interest rate differentials, as a surge in Japanese government bond yields is offset by a similar rise in US Treasury yields. Meanwhile, traders increasingly speculate that the Bank of Japan will raise interest rates in September to support the yen and curb inflation.
The USD/JPY rebound from the low of 155.23 encountered resistance near 160. This level is a psychological threshold and also coincides with the 100-day simple moving average, where the two converge. With the 14-day Relative Strength Index (RSI) below 50, there is still room for further downside. A decisive break below 158.50 (38.2% Fibonacci retracement) is needed for the bears to target the 200-day simple moving average around 158.22. If this level is breached, the next target is 157.25, the 23.6% Fibonacci retracement. A break below 157.25 could unleash further selling pressure, targeting the previous low of 155.23. On the bullish side, a break above the psychological level of 160 is needed, as this level coincides with the 100-day simple moving average, forming strong resistance. If the exchange rate holds above 160, the technical outlook will turn bullish, with an upside target of 160.88 (July 31 high) and a further challenge of the psychological level of 162.
Today, consider shorting the US dollar at 159.75, with a stop loss at 159.90 and targets at 159.00 and 159.10.
EUR/USD
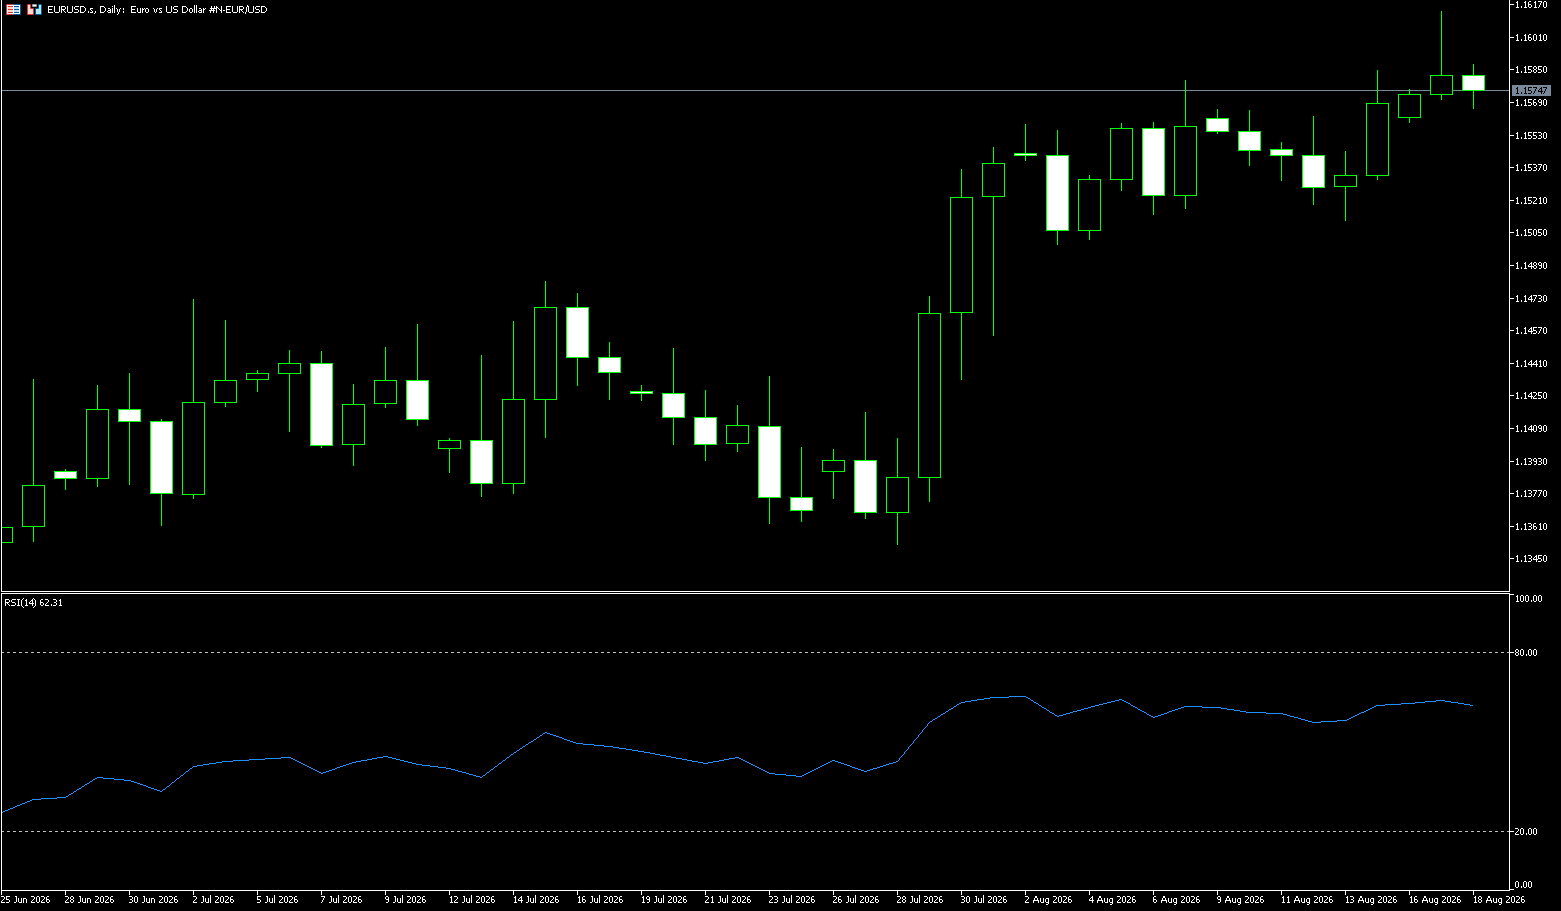
During Tuesday's Asian session, the EUR/USD pair held steady around the 1.1575-1.1580 area, seemingly pausing the slight pullback from the previous day's two-month high. However, the slight rise in the US dollar suggests caution is still needed before positioning for a resumption of the recent rally from the 1.1350 area, the monthly low in July. Last week's weak US inflation and consumer spending data dampened market expectations for an imminent Federal Reserve interest rate hike. As a result, the dollar index fell to its lowest level since June 16th on Monday. However, rising oil prices keep inflation concerns alive, potentially forcing the US central bank to adopt a more hawkish stance. Coupled with ongoing geopolitical uncertainty, renewed demand for the safe-haven dollar could weigh on the euro/dollar pair. Meanwhile, the market is increasingly accepting the view that the European Central Bank will raise rates by 25 basis points at its final meeting in September, which could continue to support the euro and limit the downside for the pair.
From a technical perspective, the euro has begun to show some positive momentum. It is currently challenging the 1.16 level—a large psychological psychological level that has repeatedly deterred bulls over a considerable period. A successful break above this level would open the way to 1.17 and indicate that the recent rally is gaining stronger market acceptance. On the pullback side, the 1.15 (psychological level) and 1.1498 (20-day moving average) areas have become the focus again, attracting many technical traders. If it falls further, the longer-term range structure remains important – the price may simply have found technical support around the 1.1400 level. The 1.1600 level and the 1.1629 (200-day moving average) are crucial: a decisive break above these levels could lead to the 1.1700 level. Ultimately, this remains a range-bound market. While the technicals have improved somewhat, it is still attempting to accumulate momentum within a wider range rather than clearly breaking free from its constraints.
Today, consider going long on the Euro at 1.1562, with a stop-loss at 1.1550 and targets at 1.1600 and 1.1610.
Stock Analysis:
Australian ASX 200 Stock Index
Basic Market Overview:
The Australian ASX 200 closed almost flat on Tuesday at 9070 points, ending a four-day losing streak after hitting a two-week low. Buyers entered the market, and sentiment stabilized as consumer confidence improved in August and mortgage holders' concerns about further interest rate hikes eased. Meanwhile, US stock index futures weakened due to stalled US-Iran peace talks. In China, July data showed weak consumption and rising unemployment in Australia's major trading partner, slowing economic momentum. Growth in healthcare, manufacturing, and durable goods was offset by weakness in technology, non-durable goods, and business services.
BHP rose 3% after exceeding earnings expectations and announcing its highest dividend in four years. CSL surged nearly 18% on strong growth guidance for 2027, its best performance since 2001. Energy stocks Woodside (1.1%) and St. Toth (1.2%) rose amid firm oil prices. In contrast, mortgage applications from the four major banks declined by 0.3% to 1.3% after a sharp drop following reports of tax changes in May.
Sector Performance:
Leading Sectors:
Healthcare +7.81%: Driven by earnings reports, CSL surged 17.25%, Pro Medicus jumped 11.88%, and Cochlear rose 6.66%, becoming the biggest pillar of the index.
Energy +0.99%: Stronger oil prices led Woodside to +1.1% and Santos to +1.2%.
Utilities +0.89%: Defensive funds flowed in.
Leading Sectors:
Financials -1.10%: Weakness from the four major banks and declining mortgage applications (CBA -1.44% and WBC -1.17%) weighed on the overall market performance.
Consumer Staples -1.16%, Telecommunications -1.27%, Technology -1.02%: Generally under pressure.
Technical Analysis:
The Australian Securities Exchange (ASX) 200 index closed at 9070 on Tuesday, down 0.04%, ending a four-day losing streak. The index experienced significant intraday volatility, dipping to a two-week low of 9054 before rising to 9107 before retreating towards the close, forming a near-doji candlestick. While the index closed almost flat, sector performance was highly divergent. Without the support of the healthcare sector and BHP Billiton, the market would have been weaker. During earnings season, individual stock performance was far more significant than index-driven. External factors included weak US stock futures, weak Chinese economic data for July, and the Australian dollar fluctuating around 0.71 against the US dollar. Wednesday's Technical Forecast: Daily Chart: The market entered a correction phase from the historical high of 9297. Tuesday's doji candlestick suggests a potential bottoming signal after the decline, but a reversal has not yet been confirmed. The RSI has fallen from overbought levels and is currently in neutral territory, indicating intense competition between bulls and bears. Short-Term: The market is expected to fluctuate within a large range of 9000-9140. Only a firm hold above 9140 offers a chance to challenge the previous high again; a decisive break below 9000 would likely lead to a further pullback towards 8900. Market logic: During earnings season, the index is being driven by a few heavyweight stocks, resulting in internal structural divergence, reducing the reliability of index signals, and leading to greater volatility in individual stocks.
Trading Strategy:
Short-term Trading Strategy (Wednesday Intraday - Short-term)
1. Bullish Strategy
• If the price retraces to the 9050-9060 support zone and stabilizes, a small long position can be initiated; the stop-loss should be placed below 8980.
• The initial upside target is 9130-9140; a break above 9140 could lead to 9180.
• Avoid chasing highs: If the price surges directly above 9130 without significant volume, do not chase the price higher.
2. Short-selling Strategy
• If the price rebounds to 9130-9140 and encounters resistance, a small short position can be initiated; stop loss above 9190.
• The first downside target is 9060; if 9000 is broken with significant volume, the next target is 8900.
Key Risk Warnings:
Earnings Season Risk: Many heavyweight companies release their earnings reports; a sharp drop in a single heavyweight stock can directly cause significant index fluctuations. Be wary of earnings disappointments impacting the financial and resource sectors.
External Market Linkage: Overnight volatility in US stocks and geopolitical tensions in the Middle East disrupt oil prices; changes in Chinese economic data directly affect the performance of heavyweight Australian resource stocks such as BHP.
Interest Rate Risk: Recurring inflation in Australia and a revaluation of interest rate hike expectations in the market will put pressure on the banking, real estate, and consumer sectors.
False Breakouts at Key Levels: False breakouts are likely at the key levels of 9000 and 9140. Wait for confirmation from the closing price of the candlestick chart; do not trade based on intraday spikes.
China's Shanghai Composite Index
Basic Market Overview:
The Shanghai Composite Index rose 0.19% on Tuesday to close at 3990.3 points, a more than one-month high, while the Shenzhen Component Index fell 0.56% to 14622.5 points. Market volatility intensified despite renewed expectations of stimulus measures. In his speech, Premier Li Qiang called for stronger measures to achieve this year's economic and social development goals, while pledging to accelerate the shift towards new growth drivers, including the "six networks" (referring to the internet, telecommunications, and data centers). Li's speech came after a batch of July data showed a loss of overall momentum, with industrial output, retail sales, and fixed asset investment all weaker than expected.
Stocks related to artificial intelligence, such as Hygon Information Technology (-3.02%), Accelink Technologies (-3.10%), GigaDevice (-1.64%), SMIC (-1.30%), and InnoLight Technology (-1.30%), all reported losses. Meanwhile, investors are focused on the National People's Congress Standing Committee meeting to be held in Beijing from August 25th to 28th.
Sector Performance:
Leading Sectors
Leading sectors: Agriculture, Forestry, Animal Husbandry and Fishery (seed industry, aquaculture saw a surge in limit-up stocks), Agrochemicals, Petrochemicals, Humanoid Robots, and some defensive consumer sectors; funds are shifting towards defensive directions.
Lagging sectors: AI computing power, gaming and media, medical services, securities firms, and energy metals; profit-taking pressure is high for previously popular themes.
Technical Analysis:
The Shanghai Composite Index (Tuesday) closed at 3,990.30 points, up 0.19%. Shanghai's single-day turnover was 1,135.188 billion yuan, and the total market turnover was 2.42 trillion yuan, a slight increase compared to Monday. Market Overview: Tuesday morning saw a lower opening, followed by a rise and then a fall, with the intraday low reaching 3955.60 points. The afternoon saw a recovery, with the Shanghai Composite Index closing with a small positive candle with a long lower shadow, showing strength in Shanghai and weakness in Shenzhen. The Shenzhen Component Index and the ChiNext Index closed lower, with over 3200 stocks declining and over 2100 rising, indicating significant divergence. Technical Status: After Monday's surge with high volume, Tuesday saw high-level consolidation to digest profit-taking. The index approached the strong resistance gap area of 3,995-4,010 but failed to break through. It retraced during the session to test support, holding above the 5-day moving average. The lack of sustained large-scale inflows of northbound capital casts doubt on the sustainability of the rebound.
Wednesday Technical Forecast – Daily Chart: The Shanghai Composite Index is in a high-level consolidation range after the rebound. The 3,995-4,012 range represents strong resistance. If trading volume cannot maintain above 2.3 trillion, a direct breakout with high volume will be difficult, and consolidation is more likely. A surge without volume could easily lead to a pullback. The 5-day moving average at 3954 and the 10-day moving average at 3940 are the lifelines for this rebound. A decisive break below 3940 would signal a second pullback and adjustment in this rebound.
Trading Strategy:
Operational Strategy (Short-term perspective, suitable for 3-5 day timeframes)
1. Position Management: Avoid chasing highs; total position size should be controlled at 50-70%; do not open new heavy positions in resistance zones; consider adding positions only after a pullback to support and stabilization.
2. Long Position Conditions: If the index pulls back to the 3950-3954 range and stabilizes, with total trading volume in both Shanghai and Shenzhen markets remaining above 2.2 trillion, moderate buying on dips is possible; only if the index breaks through and stabilizes above 4012 with increased volume is it suitable to further increase positions.
3. Position Reduction/Defensive Conditions:
◦ If the price rises to 4005-4012 without volume, reduce positions and perform a reverse T+0 trade;
◦ If the price effectively breaks below 3940 (closing price below + increased volume), reduce positions to avoid the risk of a second pullback.
Key Risk Warnings:
The current market is in a rebound phase, not a one-sided bull market. There is significant selling pressure from trapped investors above. If trading volume shrinks rapidly, the risk of a pullback after a surge increases significantly.
The Shanghai Composite Index continues its pattern of strength compared to Shenzhen Component Index, with the index rising but most individual stocks not, presenting a structural risk of profiting from the index but not from individual stocks.
External market fluctuations, policy news, and significant outflows of northbound capital could all trigger rapid market volatility.
Disclaimer: The information contained herein (1) is proprietary to BCR and/or its content providers; (2) may not be copied or distributed; (3) is not warranted to be accurate, complete or timely; and, (4) does not constitute advice or a recommendation by BCR or its content providers in respect of the investment in financial instruments. Neither BCR or its content providers are responsible for any damages or losses arising from any use of this information. Past performance is no guarantee of future results.
More Coverage






2026 © - All Rights Reserved by BCR Co Pty Ltd
Risk Disclosure:Derivatives are traded over-the-counter on margin, which means they carry a high level of risk and there is a possibility you could lose all of your investment. These products are not suitable for all investors. Please ensure you fully understand the risks and carefully consider your financial situation and trading experience before trading. Seek independent financial advice if necessary before opening an account with BCR.
BCR Co Pty Ltd (Company No. 1975046) is a company incorporated under the laws of the British Virgin Islands, with its registered office at Trident Chambers, Wickham’s Cay 1, Road Town, Tortola, British Virgin Islands, and is licensed and regulated by the British Virgin Islands Financial Services Commission under License No. SIBA/L/19/1122.
Open Bridge Limited (Company No. 16701394) is a company incorporated under the Companies Act 2006 and registered in England and Wales, with its registered address at Kemp House, 160 City Road, London, England, EC1V 2NX. Open Bridge Limited acts solely as a payment processor for BCR Co Pty Ltd and does not provide any financial, trading, or investment services on its behalf. Open Bridge Limited's role is limited to payment processing.


 English
 简体中文
简体中文
 繁體中文
繁體中文
 Bahasa
Melayu
Bahasa
Melayu
 Tiếng
Việt
Tiếng
Việt
 ไทย
ไทย
 日本語
日本語
 한국어
한국어
 ភាសាខ្មែរ
 español