


0
Currency & Commodity Analysis:
US Dollar Index
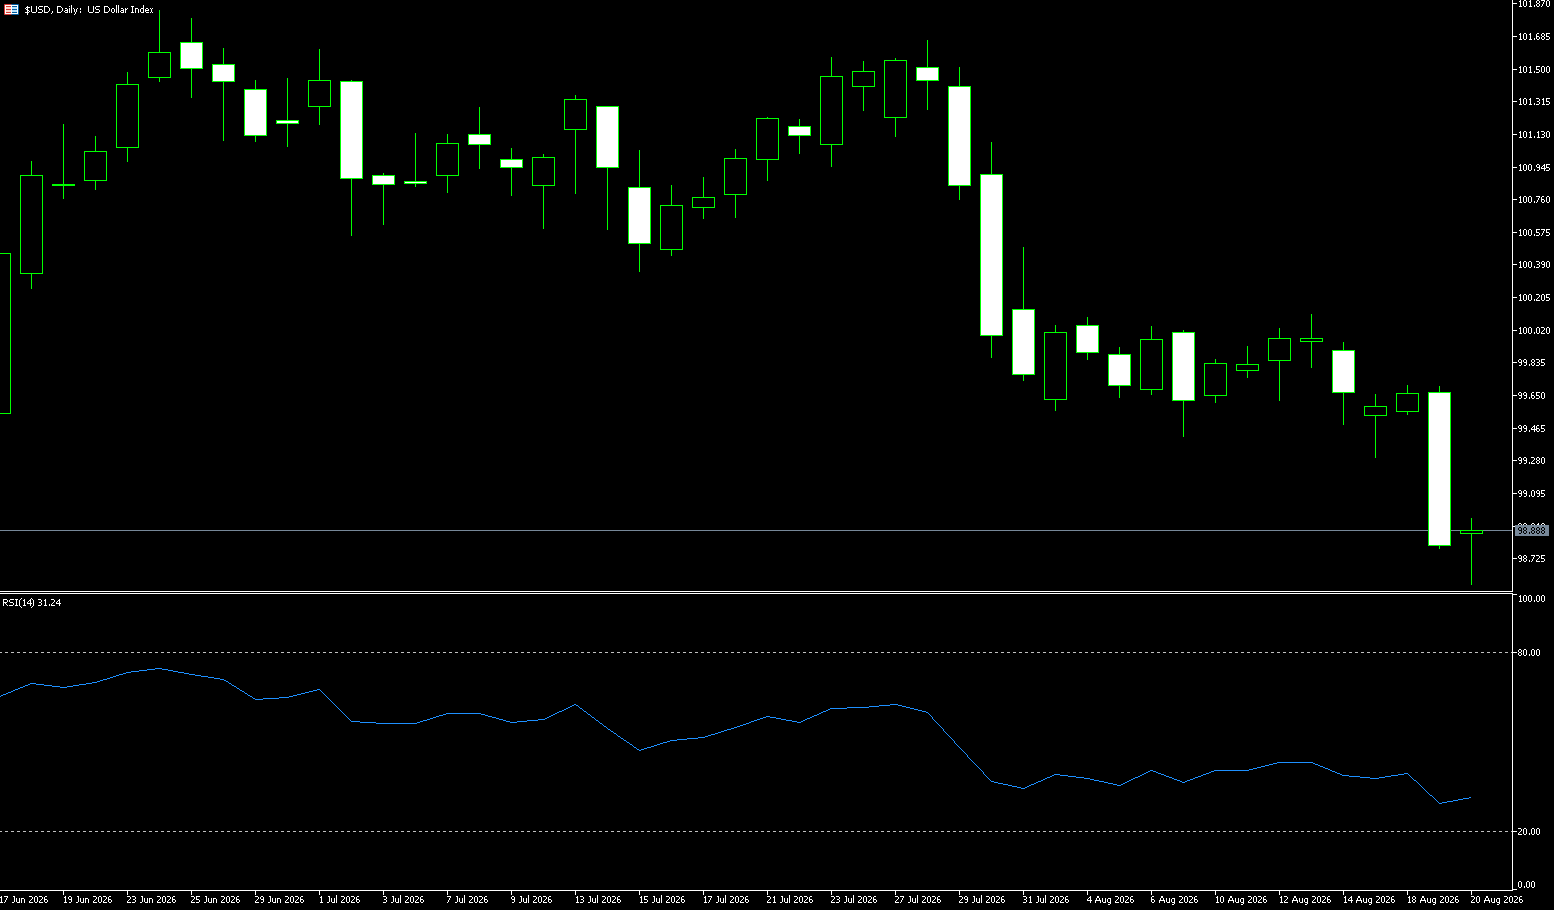
The US dollar index fell nearly 1% mid-week, closing at 98.77, a near three-month low. The US Treasury unexpectedly announced a doubling of the size of its long-term Treasury repurchase operations to stimulate market liquidity, causing the 30-year US Treasury yield to fall sharply from its near 19-year high. The day before the U.S. Treasury unexpectedly announced an expansion of its long-term Treasury bond repurchase program, one or more investors made a large purchase of an ETF highly sensitive to fluctuations in U.S. long-term Treasury yields. The $1.5 billion PIMCO 25+ Year Zero-Coupon U.S. Treasury Index ETF attracted a record $123 million in inflow on Tuesday, with trading volume jumping to 5.2 million shares, nearly double the previous peak in 2024. Recent interventions in the foreign exchange market by Japan and the U.S. led to a sharp decline in the dollar index, prompting Treasury Secretary Bessenter to call for raising the limits on foreign exchange transactions at the Federal Reserve's FIMA facility so that foreign countries could access dollar liquidity without actively intervening in the foreign exchange market.
The U.S. Treasury's latest large-scale bond market intervention became a key driver of the dollar's decline, directly exacerbating downward pressure on the dollar index. From the policy's initial intention, the Treasury's large-scale repurchase of long-term bonds aimed to absorb excess Treasury bond supply, restore market liquidity, and suppress soaring long-term yields. However, the market's interpretation focused entirely on the implicit risks behind the policy, triggering a chain reaction of dollar depreciation. This intervention confirms the severe imbalance between supply and demand in the US long-term bond market and the urgent need for intervention due to debt risks, further shaking global investors' long-term confidence in dollar assets. Therefore, downside targets to watch are 98.52 (lower Bollinger Band) and 98.00 (psychological level); upside targets are 99.00 and 99.30 (5-day moving average).
Today, consider shorting the US Dollar Index at 98.92, with a stop-loss at 99.00 and targets at 98.30 and 98.40.
WTI Crude Oil
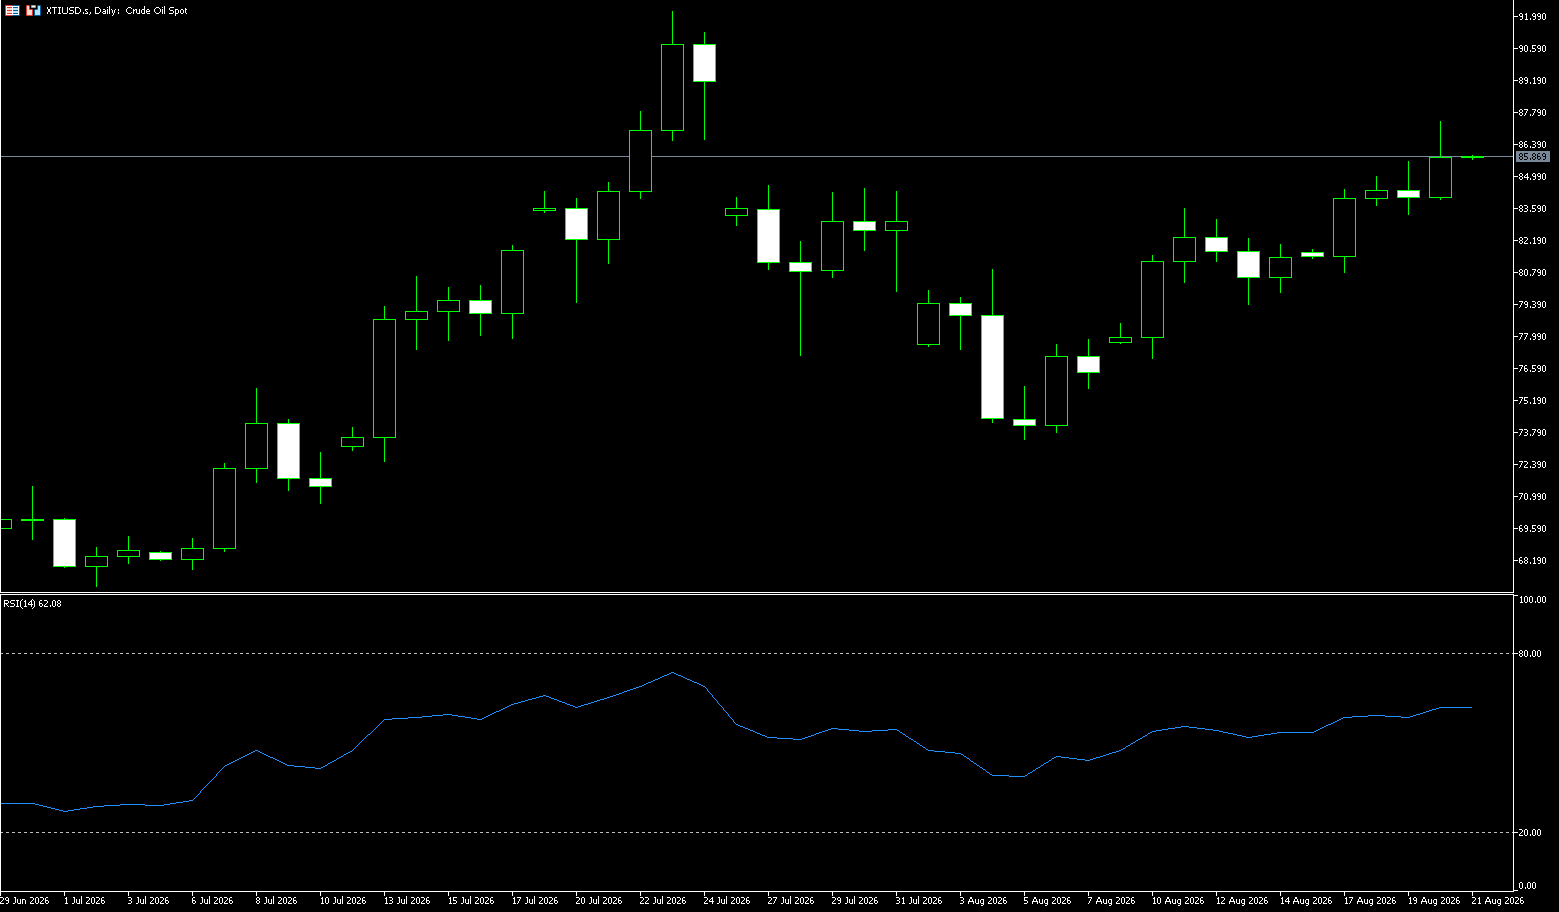
On Thursday, WTI crude oil traded above $85.50 per barrel. The Middle East situation continued to support oil prices, with Trump announcing the "toughest" economic sanctions against Iran and warning other countries against providing any support. In the short term, the Hormuz transit data and US-Iran statements remain the dominant variables for oil prices. If transit volume remains low, crude oil volatility will be high. Gold is caught between safe-haven demand and US Treasury yields, and may fluctuate before the FOMC minutes. The US dollar is driven by both safe-haven demand and interest rate expectations. In the medium term, the speed of progress on alternative export pathways will determine whether the supply gap can be filled. If substantial diplomatic progress is made, the oil price risk premium may decline; if the stalemate continues, concerns about the supply gap will intensify. The biggest tail risk is an unexpected escalation of the conflict, including the destruction of European targets or power cables. It's necessary to track traffic data and insurance costs, rather than just focusing on prices.
From a global market perspective, the continued rise in crude oil prices will increase cost pressures on energy-importing economies and may re-influence global inflation expectations. If the oil price increase persists for a long time, the transmission of energy prices to transportation, manufacturing, and consumption may make major central banks more cautious in adjusting monetary policy. The 4-hour chart shows that WTI maintains a relatively clear short-term upward structure, with prices gradually rising along short-term moving averages and relatively limited pullbacks, indicating that the bulls still hold the short-term initiative. The area above $84 has become a crucial dividing line between bulls and bears. If prices can consolidate above $84 and effectively break through $86, the upward trend is expected to continue to $88.00. Conversely, if WTI encounters continuous resistance in the $85-$86 area and falls below $82, a short-term high-level consolidation or even a technical pullback may form, with the next support level pointing to the $80-$81 area. Therefore, in the next few trading days, it is crucial to observe whether the price can transform the area around $84 from resistance into effective support.
Today, consider going long on crude oil at 85.80, with a stop loss at 85.60 and targets at 87.00 and 88.00.
Spot Gold
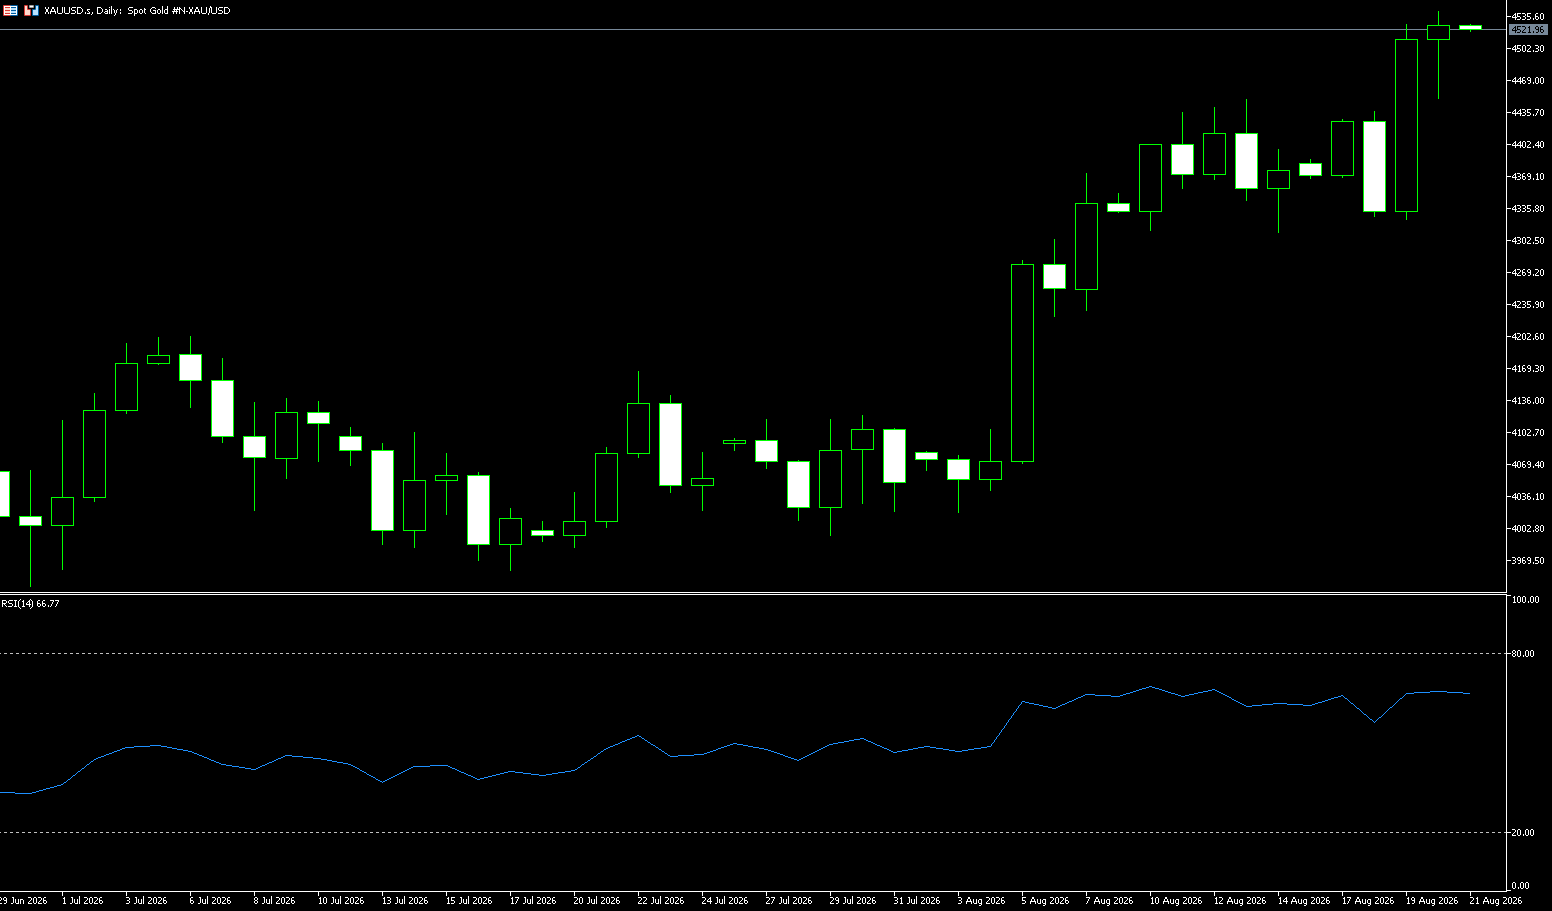
On Thursday (August 20th, Beijing time) in early Asian trading, spot gold was trading around $4,519 per ounce. Gold prices surged over 4% on Wednesday, hitting a more than two-month high of $4,527.50 per ounce. Technically, gold prices have broken through the 100-day moving average near $4,382.60. Although the minutes of the Fed's July meeting showed policymakers' growing concerns about inflation and several officials preparing to raise interest rates, recent weak economic data has led the market to expect a 65% probability of keeping interest rates unchanged in September, further weakening support for the dollar and yields. Observing the term premium structure of US Treasury bonds reveals that due to the decline in US labor and inflation data, short-term interest rates such as the 2-year rate have not risen significantly. The main interest rate pressure lies in the long term. This structure has limited downward pressure on gold prices, and gold prices may rebound rapidly after a correction in long-term interest rates, potentially resulting in a bullish steepening pattern, which is beneficial for a gold rebound (i.e., the fading expectation of interest rate cuts is beneficial for gold prices, while rising long-term inflation concerns are not entirely negative for gold prices).
Previously, gold prices traded in a narrow range around $4,300 for a considerable period, followed by consecutive candlesticks with significantly expanded bodies, and the 100-day moving average at $4,382.6 rapidly widened. Intraday, the price even traded significantly outside the $4,409 (9-day moving average). This situation typically indicates that short-term actual volatility has exceeded the previously statistical range, rather than simply representing the strength of the trend. The MACD also shows a rapid expansion of short-term momentum, with a significant widening of the distance between the DIFF and DEA lines and a rapid rise in the histogram values. Currently, gold, long-term Treasury bonds, and the US dollar are all being repriced in tandem following the Treasury's announcement, indicating that this round of volatility is primarily driven by macroeconomic interest rate factors, rather than independent factors within the gold market. Going forward, watch for resistance at $4,584.50 (the upper Bollinger Band) and $4,600 (a psychological level); on the downside, consider $4,450 (the high of August 13th) and the 100-day moving average at $4,382.6.
Today, consider going long on gold at $4,514, with a stop-loss at $4,510 and targets of $4,550 and $4,560.
AUD/USD
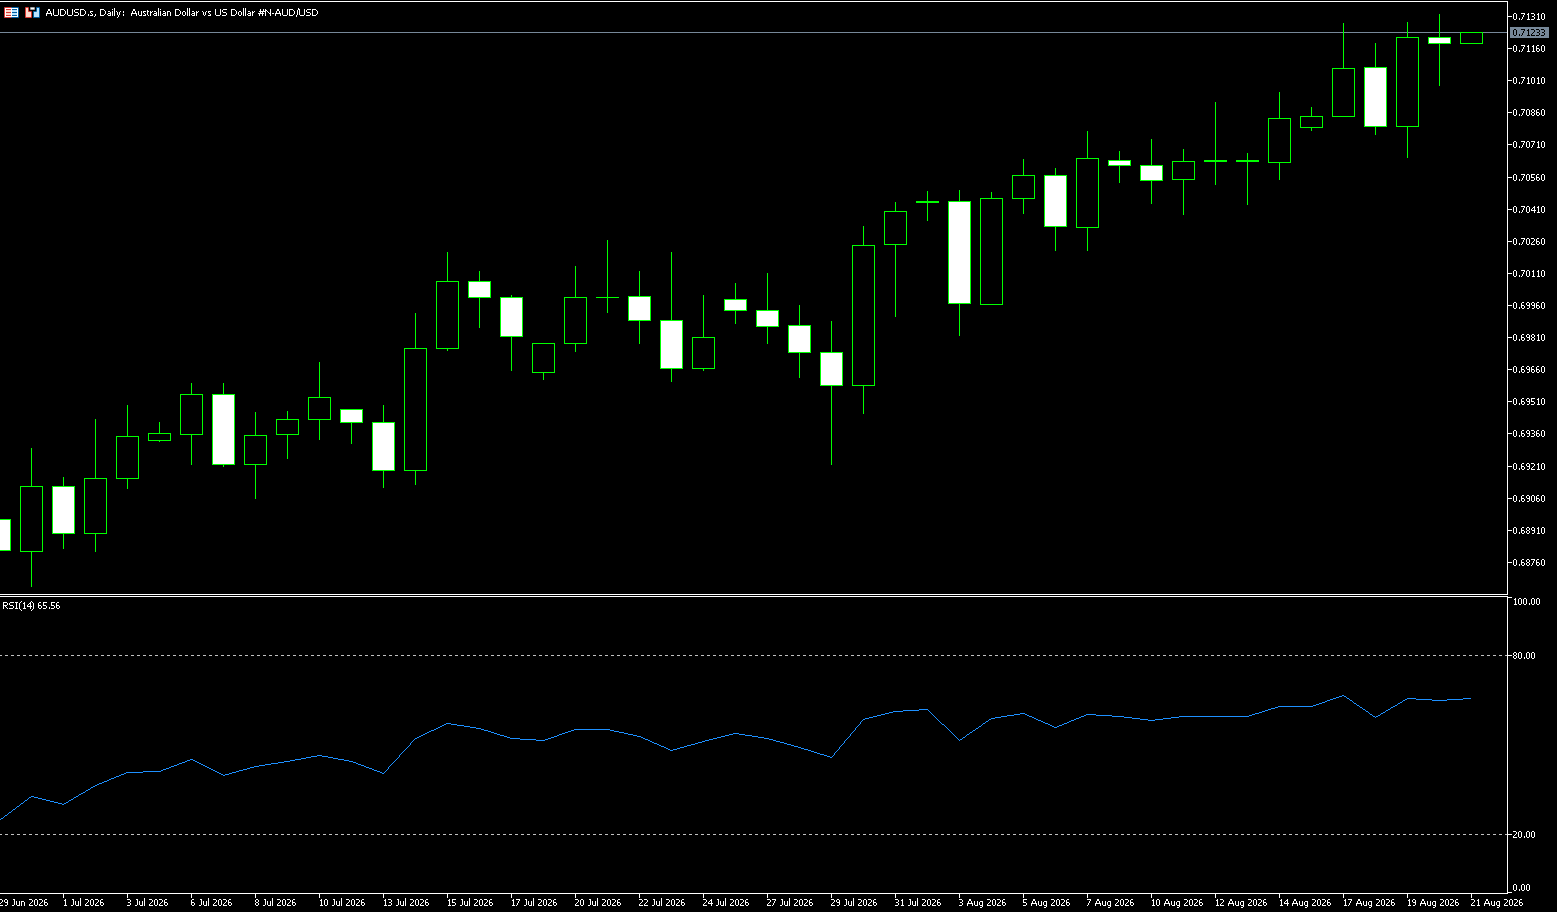
The AUD/USD is currently consolidating near its highest level since June 3rd, as bulls choose to wait for the People's Bank of China's interest rate decision and Australian employment data before establishing new bets. Meanwhile, falling US Treasury yields are keeping the dollar weak near three-month lows, providing support for the pair. However, the hawkish tone of the Fed meeting minutes and geopolitical risks helped limit the dollar's decline, keeping spot prices below the mid-range of 0.7100 during Thursday's Asian session. The Australian Bureau of Statistics reports full-time and part-time jobs separately in its monthly employment change data. Generally, full-time work means working 38 hours or more per week, usually including additional benefits, and typically provides a stable income. Weak expected data could have a short-term negative impact on the Australian dollar, although market focus remains elsewhere: the Middle East.
Amid a generally weaker US dollar, the AUD/USD pair is trading near the 0.7100 level, not far from the August high of 0.7129. Technically, the pair is biased to the bulls, with the daily chart showing buying concentrated near the 100-day simple moving average, around 0.7066. Meanwhile, the 20-day simple moving average at 0.7045 is rising below longer-term moving averages, indicating increasing buying interest. Finally, technical indicators on the same chart remain in positive territory, although lacking clear directional strength. As long as the pair holds above the aforementioned 20-100 simple moving average area, the bullish stance will remain intact, unaffected by intraday fluctuations. However, a break below this level could extend the pullback to the 20-day simple moving average at 0.7045 and the 0.7000 (psychological support) area before signs of buying interest emerge. Immediate resistance lies at 0.7129 (August high), while further gains could push AUD/USD to the May 29 high of 0.7200.
Consider going long AUD/USD today at 0.7108, with a stop-loss at 0.7100 and targets at 0.7150 and 0.7160.
GBP/USD
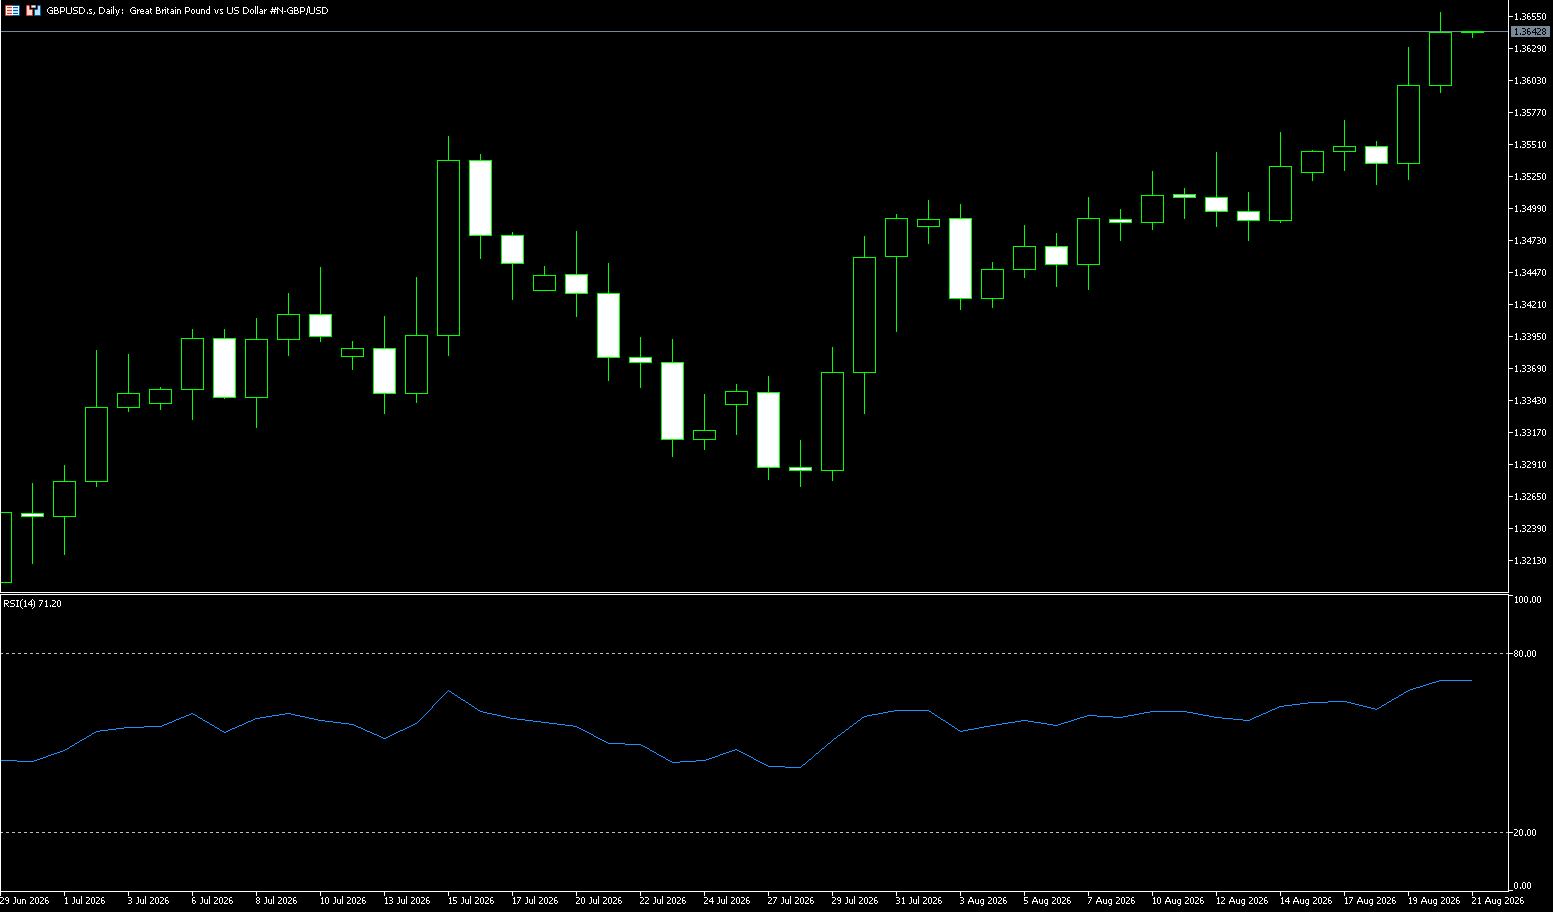
The GBP/USD pair edged lower in Asian trading on Thursday, retreating further from its highest level since May 11 reached the previous day. The fundamental backdrop appears bullish, supporting a buy-on-dips strategy. The dollar stabilized after falling to a three-month low the previous day, dragged down by U.S. bond yields, becoming a key factor weighing on the pound/dollar pair. The yield decline was attributed to the U.S. Treasury's intervention to provide relief to the bond market and its announcement that it would at least double its purchases of longer-term government debt starting in September. However, hawkish FOMC minutes, showing broader support for rate hikes, helped limit further dollar declines amid ongoing geopolitical uncertainty stemming from the U.S.-Iran standoff over the Strait of Hormuz. In the latest developments surrounding the Middle East crisis, U.S. President Trump stated on Wednesday that Washington would impose stricter economic restrictions on Iran. On the other hand, the pound received some support from strong UK consumer inflation data on Wednesday, which reaffirmed bets on at least a 25 basis point rate hike by the Bank of England before the end of the year. This, in turn, validated the positive outlook for the pound/dollar pair and should prevent bearish traders from establishing positions for any corrective pullback.
From a daily chart perspective, the pound/dollar pair currently maintains a relatively clear short-term bullish pattern, with the price trading above a dense area of major daily moving averages, indicating that the previous uptrend has not been broken. The 14-day RSI is around 68, in a slightly bullish but not yet severely overbought zone, indicating that bulls still hold the upper hand. In the short term, the first resistance level to watch is 1.3653 (the high of May 11th). A decisive break and hold above this level would target the psychological high near 1.3700. A break above this level could open up further upside potential for the pound. On the downside, initial support is provided by 1.3524 (Wednesday's low) and 1.3508 (the 14-day simple moving average), followed by the 20-day simple moving average at 1.3467. Deeper support lies near the psychological level of 1.3400.
Today, consider going long on GBP at 1.3625, with a stop-loss at 1.3610 and targets at 1.3670 and 1.3680.
USD/JPY
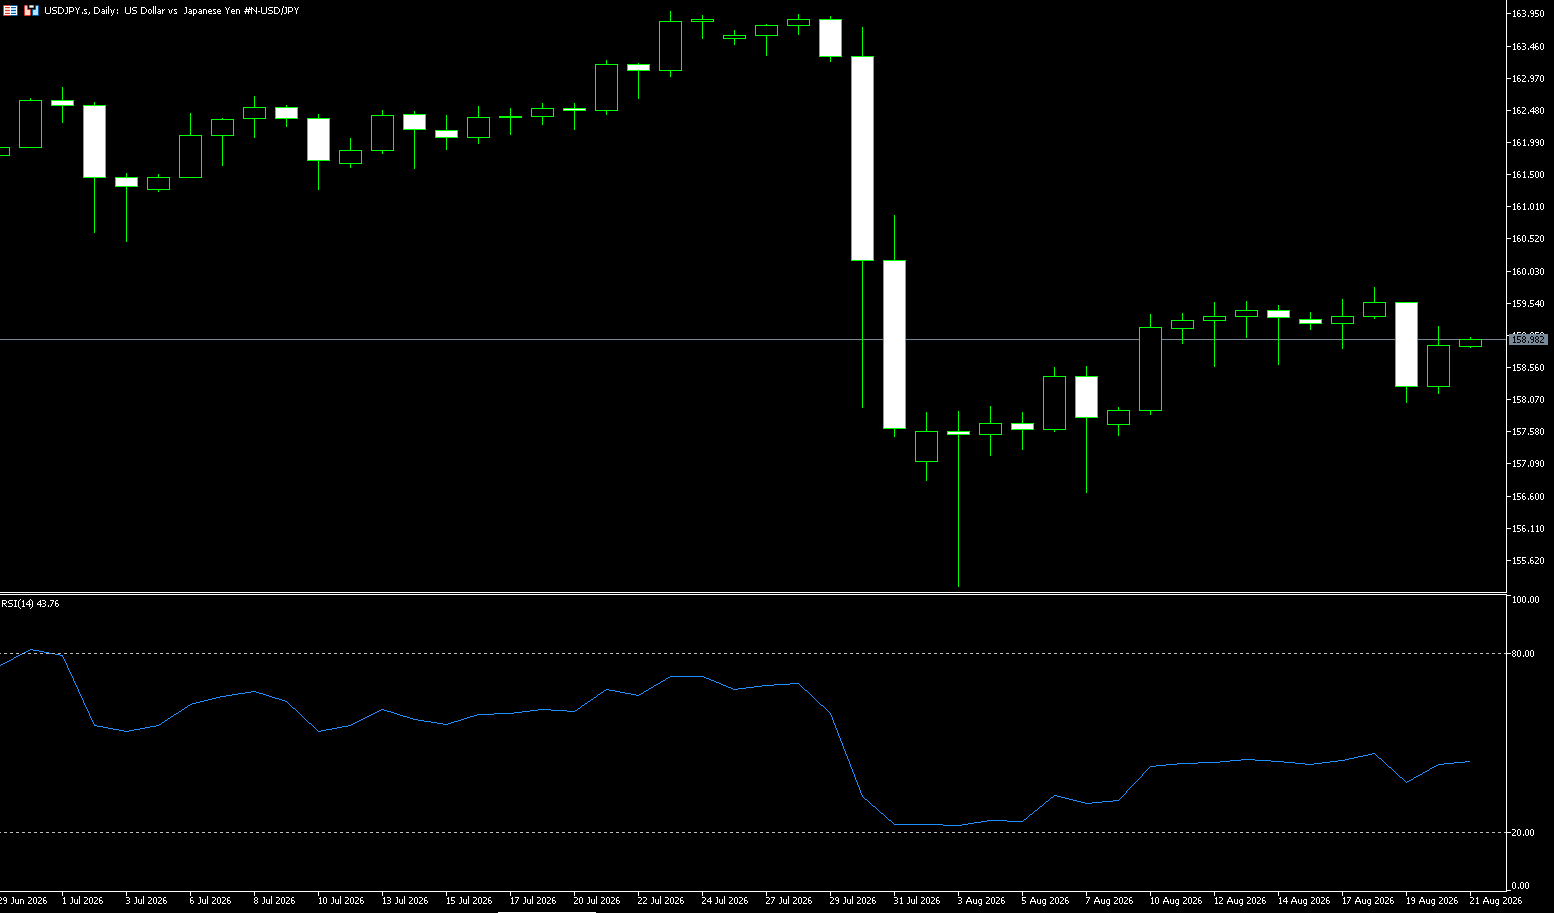
The USD/JPY pair edged higher in Asian trading on Thursday, recovering some of the previous day's sharp losses to reach 158.90, a more than one-week low, as weak Japanese trade data weighed on the pair. Concerns about Japan's deteriorating fiscal situation and a widening US-Japan interest rate differential also weakened the yen. Meanwhile, the dollar stabilized after falling to a three-month low in the previous session, dragged down by US Treasury yields, further supporting the pair. The yen's sustained weakness over the years has been primarily driven by Japan's prolonged near-zero interest rates, making it the world's lowest-cost funding currency. In late July, the US and Japan implemented historic intervention measures to boost the yen, but it subsequently depreciated again. The yen's fundamentals have far-reaching impact beyond Japan. Markets heavily utilize low-cost yen financing across various global assets; Japanese investors are also among the largest holders of US Treasury bonds. Therefore, even if a portfolio completely excludes yen assets, the yen's movements will still affect bond yields and borrowing costs, leading to portfolio volatility.
For the Japanese yen, its outlook depends more on the Federal Reserve than on currency intervention or the Bank of Japan itself. In the short term, the market is bearish below the psychological resistance level of 160, targeting 157.50, followed by the 156.50 area. This assessment is invalidated if the daily close reclaims 160.00. Resistance levels: 159.00 (the psychological level) is the first resistance, followed by the high near 159.78, while the declining 30-day exponential moving average (EMA) below 160.64 limits any rebound. Support levels: The 158.00 level is where this round of movement stopped, followed by the 157.84 (220 exponential moving average) and the 157.18 (August 4th low) area, while the intervention low slightly above 155.00 forms a structural bottom.
Today, consider shorting the US dollar at 159.25, with a stop loss at 159.40 and targets at 158.40 and 158.20.
EUR/USD
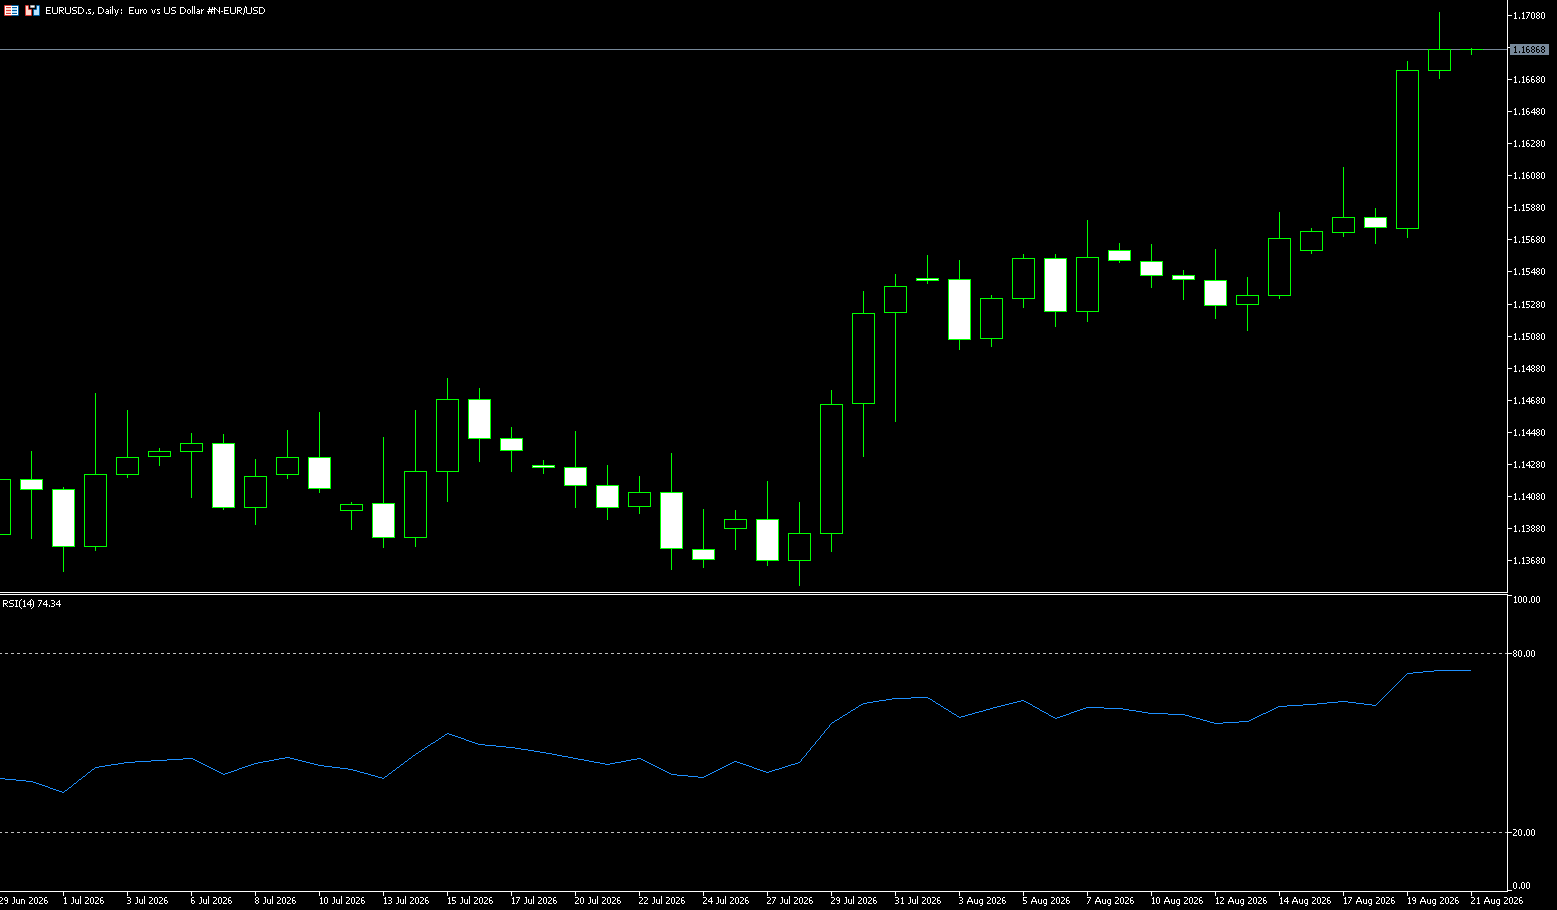
In early Asian trading on Thursday, the EUR/USD pair recorded a slight decline around 1.1675. The euro weakened slightly against the dollar after a sharp rise in the previous session. However, the downside for EUR/USD may be limited as the latest Fed meeting minutes and weak US economic data continue to weigh on the dollar. According to the minutes released Wednesday night, Fed officials stated at their last meeting that they need to raise interest rates sooner rather than later unless more progress is made in reducing inflation. Signs of cooling US inflation have weakened market expectations for a Fed rate hike, which could drag the dollar lower and provide support for this major currency pair. The market is currently pricing in a 32.7% probability of a Fed rate hike at its upcoming policy meeting, down from 47% a month ago. On the other hand, financial markets are currently pricing in the European Central Bank continuing its rate hike cycle.
On the daily chart, EUR/USD remains bullish in the short term, as the spot price holds above the 100-day simple moving average at 1.1571 and the psychological level of 1.1600. The price is currently approaching the Bollinger Band at 1.1687, while the 14-day Relative Strength Index (RSI) is deep in overbought territory above 70, indicating that upward momentum remains strong but is increasingly stretched. On the upside, immediate resistance lies at the 1.1700 level, coinciding with the Bollinger Band at 1.1687. A clear daily close above this level would open the way for further gains to 1.1741 (the May 13 high). On the downside, initial support lies in the 100-day simple moving average area of 1.1571 and the psychological level of 1.1600. A deeper pullback would provide further structural support at the 20-day simple moving average at 1.1527.
Today, consider going long on the Euro at 1.1670, with a stop-loss at 1.1660 and targets at 1.1730 and 1.1740.
Stock Analysis:
Australian ASX 200 Stock Index
Basic Market Overview:
The Australian ASX 200 index rose 30 points, or 0.3%, to close at 9,084 on Thursday, ending a six-day losing streak. Gains in consumer durables, non-energy minerals, and healthcare boosted market sentiment, supported by a slight rise in US futures after the Treasury indicated it would double its purchases of long-term debt to ease yields. Local markets rebounded from two-week lows as major trading partner China kept lending rates at record lows for the 15th consecutive month to support economic growth. However, domestic headwinds limited momentum: an unexpected drop in employment in July pushed the unemployment rate to a three-month high, while August inflation expectations rose from a six-month low in July, highlighting persistent price pressures. The trimmed average CPI rose 3.6% year-on-year in June, the fastest pace since September 2024.
Mining companies rose, with BHP up 2.5%, Rio Tinto up 1.6%, and Northern Star Resources surging 5.9% on a 24% profit jump. In contrast, the four major banks fell 1.5% to 2.5%. Traders are now awaiting Friday's fast-track PMI data for August.
Sector Performance:
Leading Sectors: Materials (Mining): +3.52%, led by gold mining companies; strong precious metal prices were the core driver. Technology & Healthcare: Some earnings stocks rebounded; retail consumption strengthened due to positive earnings reports. Energy: Slightly higher, supported by higher oil prices.
Worsting Sectors:
Financials (Banking): -1.93%, continued concerns about real estate risks led to widespread weakness in the four major banks, becoming the main drag on the sector.
Technical Analysis:
The ASX 200 index closed at 9083.80 on Thursday, +30 points, +0.33%, ending a six-day losing streak. Intraday range: High 9111.2, Low 9062. After an initial surge in the morning, the index fluctuated downwards, stabilizing at lower levels in the afternoon before closing slightly higher. The rebound was weak, with most of the gains being given back. Macroeconomic drivers: Australian July employment data fell short of expectations, with the unemployment rate rising to 4.5%, slightly increasing market expectations for interest rate cuts; the US Treasury buyback program suppressed US Treasury yields, driving up gold prices and benefiting Australian mining stocks; however, the banking sector was pressured by concerns about the real estate market, limiting the overall market's upside potential.
Friday's technical analysis: The index ended its six-day losing streak, but this was only a weak corrective rebound. Trading volume did not increase significantly, limiting the credibility of the rebound; seven sectors closed lower, indicating severe market divergence, with resource stocks performing strongly while financial stocks weakened, showing a fragmented sector rotation. Short-term moving averages are turning downwards, the RSI is in the neutral-to-low range, and the MACD bearish trend has not yet fully subsided. Multiple resistance levels are above, indicating a post-decline consolidation and correction, and the bullish trend has not yet reversed. Friday's Market Scenario Prediction: Holding above 9120: The rebound will continue, targeting the 9160-9180 resistance level; Holding above 9050-9060: Range-bound trading will continue; A decisive break below 9020: Another downward move will test the psychological level of 9000.
Trading Strategy:
Trading Strategy (Short-Term Perspective)
Bullish Strategy: Avoid chasing highs. Consider a small long position if the price retraces to the 9050-9060 support zone and stabilizes; place a stop-loss below 9015; first take-profit target is 9110, second take-profit target is the 9160-9180 resistance zone.
Short-selling strategy: A rebound to the 9110-9120 range is expected to encounter resistance and pull back. Consider a small short position; stop-loss above 9145; first target 9060, with a break below targeting 9020-9000.
Wait-and-see strategy: Given the fragmented sector performance and insufficient rebound momentum, conservative traders should remain on the sidelines and wait for a clearer direction before entering the market.
Key risk warnings:
Sectoral structural risks: Continued pressure on financial and banking stocks, coupled with resource stocks' high correlation to international gold and commodity prices, means that a decline in international commodity prices will quickly drag down the ASX200 index.
External risks: Overnight performance of US stocks, fluctuations in US Treasury yields, and dollar volatility will directly impact the opening of the Australian stock market; commodity price fluctuations have a significant impact on heavyweight mining stocks.
Domestic risks in Australia: Employment and inflation data may disrupt the Reserve Bank of Australia's interest rate expectations; the earnings season may see a large number of companies reporting disappointing earnings, leading to significant stock price volatility.
New Zealand Stock Market (NZX 50)
Basic Market Overview:
New Zealand stocks fell 10 points, or 0.1%, to close at 13,920 on Thursday, reversing gains from earlier trading and ending a two-day rally, dragged down mainly by energy, consumer goods, and industrials. Traders took profits after the broader index hit its highest level since August 5 the previous day, reaching a record high. However, gains in communications services, financials, and healthcare limited the decline. Rising U.S. stock index futures also limited the fall amid a sharp drop in government bond yields.
The biggest laggards included ANZ Group (-3.3%), A2 Milk (-2.1%), Briscoe Group (-1.8%), Auckland International Airport (-1.5%), which saw a decline in after-tax profit (including revaluation), Chorus (-1.5%), and EBOS Group (-1.3%). In contrast, Spark, New Zealand's largest telecommunications company, rose 6.4% after reporting a 91.9% surge in net profit for the second half of 2026. Skellerup Holdings rose 1.4% after reporting a 24.2% increase in net profit.
Sector Performance:
Leading Sectors
Leading sectors: Banking, Oil & Petrochemicals, Gas & Utilities, High-Dividend Defensive Sectors; Hong Kong & China Gas +7.37%, Xiaomi-W +4.81%, with strong performance from mainland banks supporting the market.
Leading Sectors
Leading sectors: Semiconductors, Hardware Equipment, Optical Communication & AI Hardware Chain; Baidu-SW plunged over 11% after its earnings report, Hua Hong Power plunged nearly 12%, impacted by the pullback in US chip stocks.
Technical Analysis:
The New Zealand stock market (NZX 50) closed at 13919.82 points on Thursday, down 0.07%. It reached a high of 13987 points in the morning session, but profit-taking at the close ended a two-day winning streak, resulting in a small bearish doji candlestick after high-level consolidation. Market Logic: Earnings season is a mixed bag, with some stocks surging on positive earnings reports, but the index is near its historical high (14012), leading to profit-taking by bulls. Falling US Treasury yields and supportive overseas sentiment limit the extent of any pullback. The overall medium-term uptrend remains intact, but short-term consolidation at higher levels is expected, with a pullback to confirm support possible. A strong upward move to new highs would require significant volume.
Friday's daily technical indicators are expected to show a high-level doji candlestick, indicating intensified competition between bulls and bears, with the price close to historical resistance levels. The RSI has fallen to around 56, moving away from overbought territory, indicating a neutral-to-bullish bias. The MACD histogram is slightly narrowing, suggesting weakening bullish momentum, but a death cross has not yet formed. The 4-hour chart shows range-bound trading between 13840 and 13980; without a breakout with significant volume, this range-bound pattern is expected to continue. Friday's predicted scenario—a slightly bullish scenario: A firm hold above 13940, followed by a surge in volume towards 13980, potentially testing the historical high. Neutral Scenario: The price will likely oscillate between 13840 and 13960, digesting profit-taking (probability higher). Weak Scenario: A break below 13840 would likely lead to a further test of the strong support level at 13760.
Trading Strategy:
Operation Strategy (Short-Term Perspective)
Buy on Dips (Main Strategy, Medium-Term Upward Trend)
• Buy on Dips: Consider buying if the price retraces to the 13840-13860 range and stabilizes with a positive close; place a stop-loss below 13790.
• Target: First target 13960; a break above 13980 targets 14010-14020.
Defensive Strategy
• If the price surges directly to the 13980-14015 resistance zone, stagnates, and forms a long upper shadow, do not chase the price higher; existing long positions can be closed in stages for profit-taking.
• If the price breaks below 13760, the short-term consolidation pattern will be disrupted. Stop going long and wait for new stabilization signals.
Key Risk Warnings:
Earnings Report Risk: A number of companies are still releasing their earnings reports. Lower-than-expected results could pressure heavyweight stocks and lead to a market pullback.
External Linkage Risk: The NZX50 is highly susceptible to overnight US stock market movements, US Treasury yields, and the New Zealand dollar exchange rate. US stock market fluctuations will directly affect the opening gap the following day.
Position Risk: The index is near its historical high, with substantial profit-taking at higher levels, making a rapid pullback likely. Avoid heavy buying at higher prices.
Macroeconomic Risk: Fluctuating New Zealand domestic inflation data could alter market expectations for local interest rates, suppressing defensive heavyweight sectors.
Disclaimer: The information contained herein (1) is proprietary to BCR and/or its content providers; (2) may not be copied or distributed; (3) is not warranted to be accurate, complete or timely; and, (4) does not constitute advice or a recommendation by BCR or its content providers in respect of the investment in financial instruments. Neither BCR or its content providers are responsible for any damages or losses arising from any use of this information. Past performance is no guarantee of future results.
More Coverage






2026 © - All Rights Reserved by BCR Co Pty Ltd
Risk Disclosure:Derivatives are traded over-the-counter on margin, which means they carry a high level of risk and there is a possibility you could lose all of your investment. These products are not suitable for all investors. Please ensure you fully understand the risks and carefully consider your financial situation and trading experience before trading. Seek independent financial advice if necessary before opening an account with BCR.
BCR Co Pty Ltd (Company No. 1975046) is a company incorporated under the laws of the British Virgin Islands, with its registered office at Trident Chambers, Wickham’s Cay 1, Road Town, Tortola, British Virgin Islands, and is licensed and regulated by the British Virgin Islands Financial Services Commission under License No. SIBA/L/19/1122.
Open Bridge Limited (Company No. 16701394) is a company incorporated under the Companies Act 2006 and registered in England and Wales, with its registered address at Kemp House, 160 City Road, London, England, EC1V 2NX. Open Bridge Limited acts solely as a payment processor for BCR Co Pty Ltd and does not provide any financial, trading, or investment services on its behalf. Open Bridge Limited's role is limited to payment processing.


 English
 简体中文
简体中文
 繁體中文
繁體中文
 Bahasa
Melayu
Bahasa
Melayu
 Tiếng
Việt
Tiếng
Việt
 ไทย
ไทย
 日本語
日本語
 한국어
한국어
 ភាសាខ្មែរ
 español