


0
Currency & Commodity Analysis:
US Dollar Index
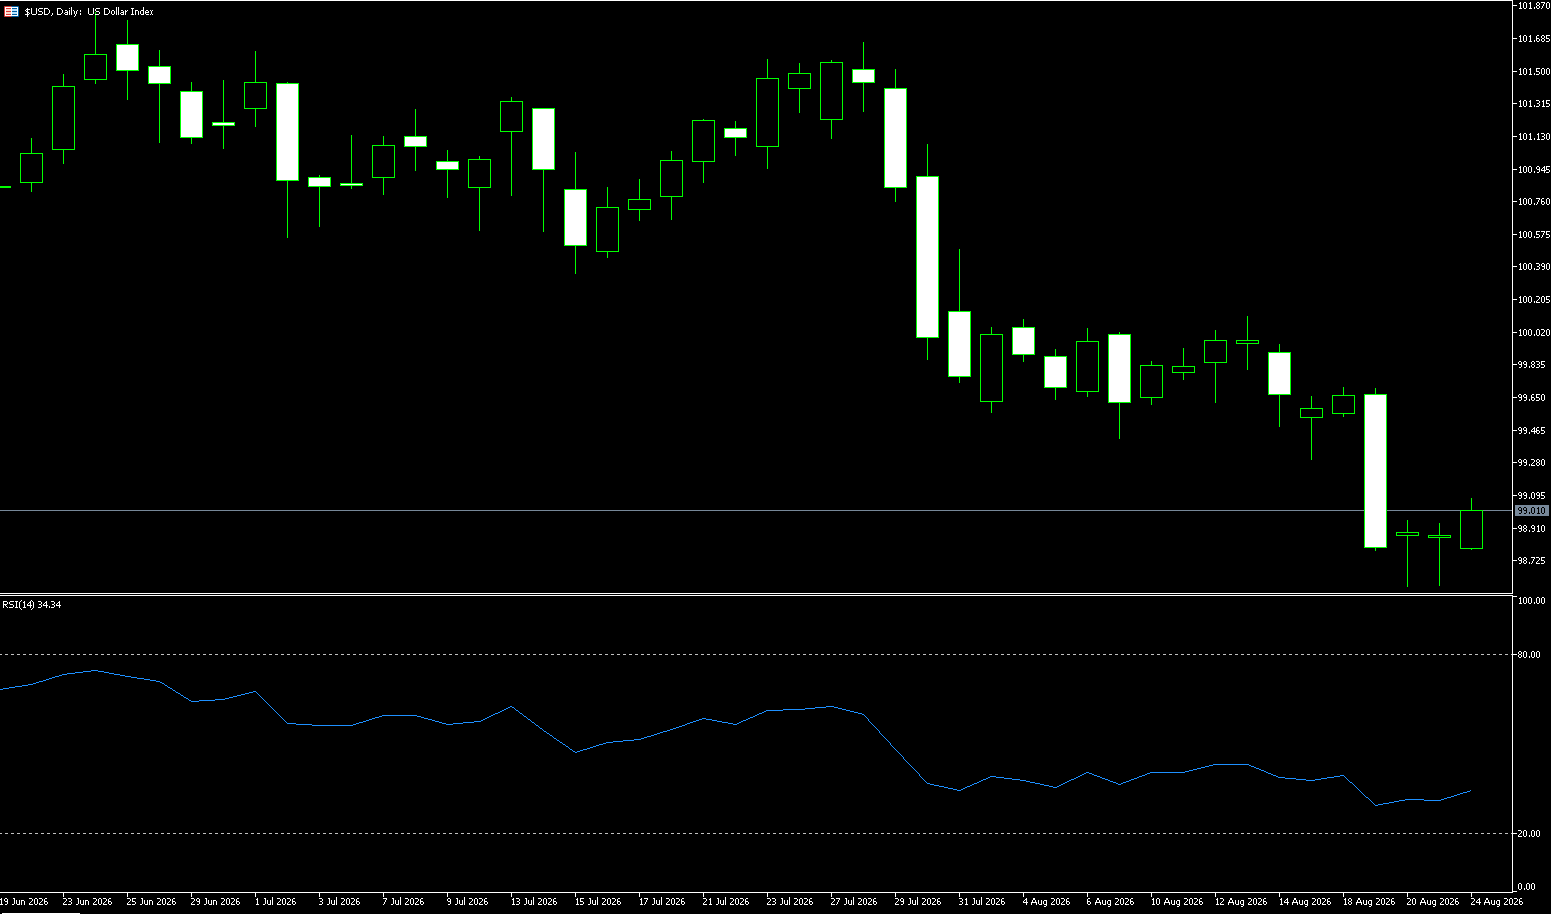
The US dollar index, after a slight gain at the end of last week, is currently maintaining its downward trend, trading around 98.90 in early European trading on Friday. The dollar weakened as the market reacted to Washington's efforts to curb high yields through a long-term bond buyback program, with the 10-year US Treasury yield remaining stable at 4.7%. The dollar index was essentially flat this week, hovering around 98.80. Similar to the latter part of last week, the dollar index fell to the 98.56 area during the session before recovering towards the close. The dollar index is trading near its lowest level since May. The dollar's weakness is less driven by data and more by liquidity factors: the US Treasury's move to at least double the size of its long-term debt buyback program has lowered yields and reduced the dollar's attractiveness, despite Friday's preliminary Purchasing Managers' Index (PMI) survey showing that US economic activity is still accelerating.
Observing the current daily chart structure of the US dollar index, the index is clearly trading below the Bollinger Band middle line at 99.741 and continues to approach the lower Bollinger Band area at 98.51, with the middle band itself starting to slope downwards. After a rapid decline from above 101, the index did not immediately recover to the original oscillation center but instead consolidated in a lower area, indicating a downward shift in the short-term price center. Regarding the MACD indicator, both the DIFF and DEA are currently below the zero line, with the DIFF still lower than the DEA, and the histogram remaining below the zero line. Simultaneously, the price is approaching the lower Bollinger Band, also indicating that short-term fluctuations have clearly deviated from the center. Therefore, the support level to watch is last week's low of 98.56. If the daily chart breaks below 98.56, it will further challenge the key support at 98.00. Only a daily close above 99.00 will reverse the short-term bearish structure and allow for a retest of the 100 level.
Today, consider shorting the US Dollar Index at 99.10, with a stop-loss at 99.20 and targets at 98.60 and 98.65.
WTI Crude Oil
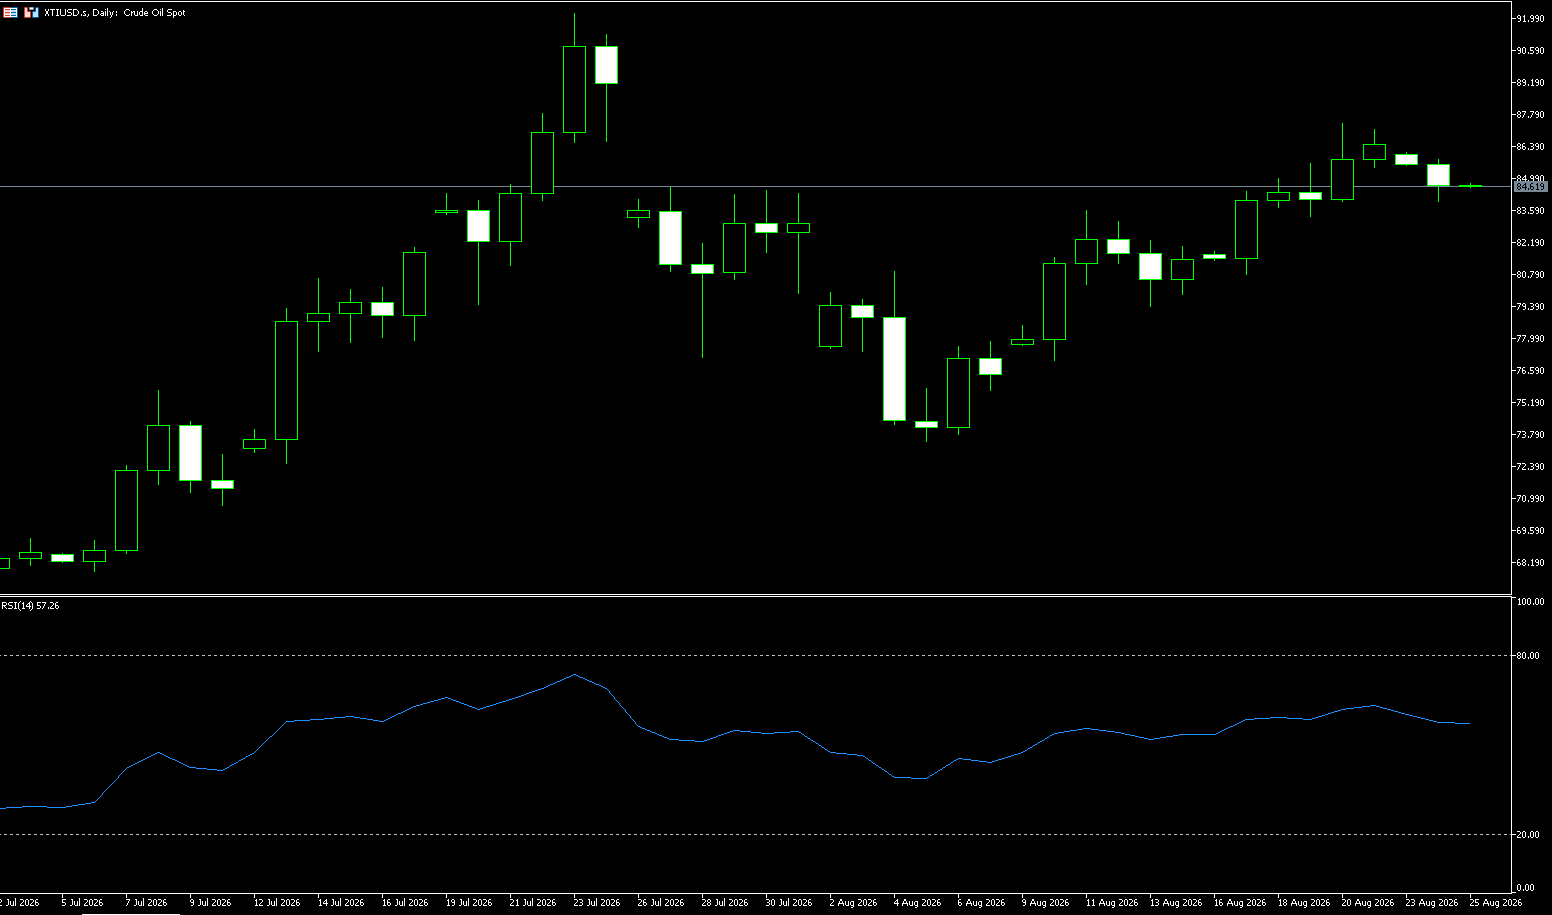
The market awaits specific measures from the US regarding economic sanctions against Iran this week. Iran, on the 23rd, revealed its "oil export retaliatory card," stating that if the US wages an economic war, there will be no more oil exports from the Strait of Hormuz or even the Persian Gulf region. US crude oil is currently trading near $86.00 per barrel. Last week, the crude oil market tugged between supply fragility and flow recovery. US military escorts led to a rebound in flow at the Strait of Hormuz, but insufficient alternative pipeline capacity means supply fragility remains. WTI crude oil's five-day winning streak is approaching resistance levels, with the market playing a game of trade around tariff rhetoric, air traffic control, and alternative supplies. In the short term, attention should be paid to the technical performance of WTI crude oil around $87, the sustainability of air traffic control at the Strait of Hormuz, and changes in supply policies of major oil-producing countries. This week, the crude oil market is tugged between supply fragility and flow recovery. US military escort operations have boosted traffic at the Strait of Hormuz, but insufficient alternative pipeline capacity means supply vulnerability remains.
This week, the crude oil market oscillated between supply vulnerability and traffic recovery. US military escort operations have boosted traffic at the Strait of Hormuz, but insufficient alternative pipeline capacity means supply vulnerability remains. Crude oil has seen five consecutive days of gains, approaching resistance levels. The market is engaged in a game of strategy surrounding tariff rhetoric, air traffic, and alternative supplies. In the short term, attention should be paid to the sustainability of air traffic at the Strait of Hormuz and changes in supply policies of major oil-producing countries. The crude oil market maintained an overall upward trend this week. WTI crude oil closed above $86 last week, rising approximately 5.9% cumulatively. The daily chart shows five consecutive positive days, clearly indicating a rebound trend since the July lows, currently approaching the resistance level near $87.38 (last week's high). Although there were pullbacks during the week, the overall center of gravity continued to rise, with the next target being $90.00 (a psychological level). The MACD technical indicator maintains a bullish structure. WTI crude oil performed even stronger, rising approximately 6.0% for the week. The first support level on the daily chart is at $84.00 (a psychological level); a break above this level would target $82.83 (the 75-day moving average), forming the second resistance zone.
Today, consider going long on crude oil at $84.35, with a stop-loss at $84.20 and targets at $86.00 and $87.00.
Spot Gold
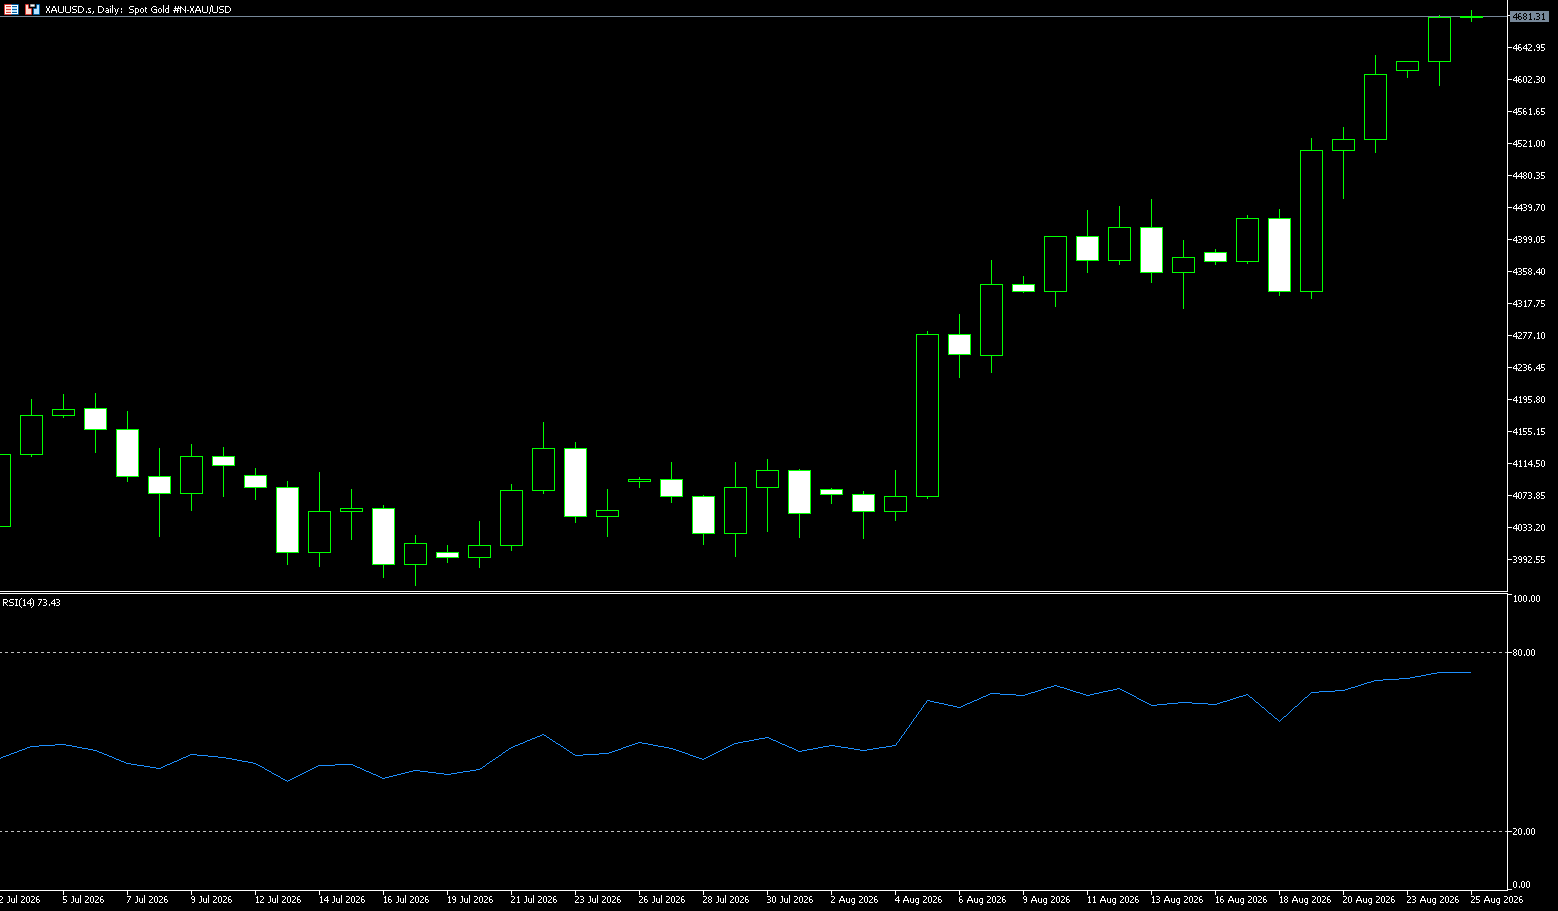
On Monday, spot gold traded around $4,650 per ounce. Last week, gold prices hit a three-month high after the US Treasury announced a possible further expansion of its Treasury bond buyback program, raising concerns that this could weaken the dollar. This rally was supported by gold breaking through the closely watched 200-day moving average (approximately $4,513 per ounce), a key technical level considered bullish by technical analysts. The weakening dollar also provided support, as market concerns arose that the US Treasury's plan to expand its Treasury bond buyback program might weaken the dollar. If the momentum continues, the next target will be $4,700/oz, while a Goldman Sachs report states that renewed global macroeconomic policy hedging demand has boosted demand for gold call options, creating a mechanical price amplification effect. Gold prices rose more than 5% on the week, hitting a three-month high. The market is focused on a weaker dollar and a technical breakout, with a rare shift in the bullish/bearish structure between institutional and retail investors, deeply intertwined with fiscal buybacks, dollar credit, and the upcoming Jackson Hole meeting.
Spot Gold Technical Outlook: Uptrend Continues, Bulls Target $4,700; After recovering the 200-day simple moving average at $4,516.80, the trend has turned upward, pushing gold prices above the $4,600 psychological level. The 14-point Relative Strength Index (RSI) indicates that the current upward momentum remains bullish, suggesting that gold prices are likely to continue rising in the short term. The first resistance level for spot gold is the high of $4,680, with the upside target at $4,700. If gold breaks through these two key levels, the next target is the May 8 high of $4,749, followed by $4,800. If the price falls below $4,600, the first support level is the 150-day moving average at $4,567.30, followed by $4,500; further support is the 9-day moving average at $4,460, followed by the psychological level of $4,400.
Today, consider going long on gold at $4,655, with a stop-loss at $4,650 and targets of $4,690 and $4,700.
AUD/USD
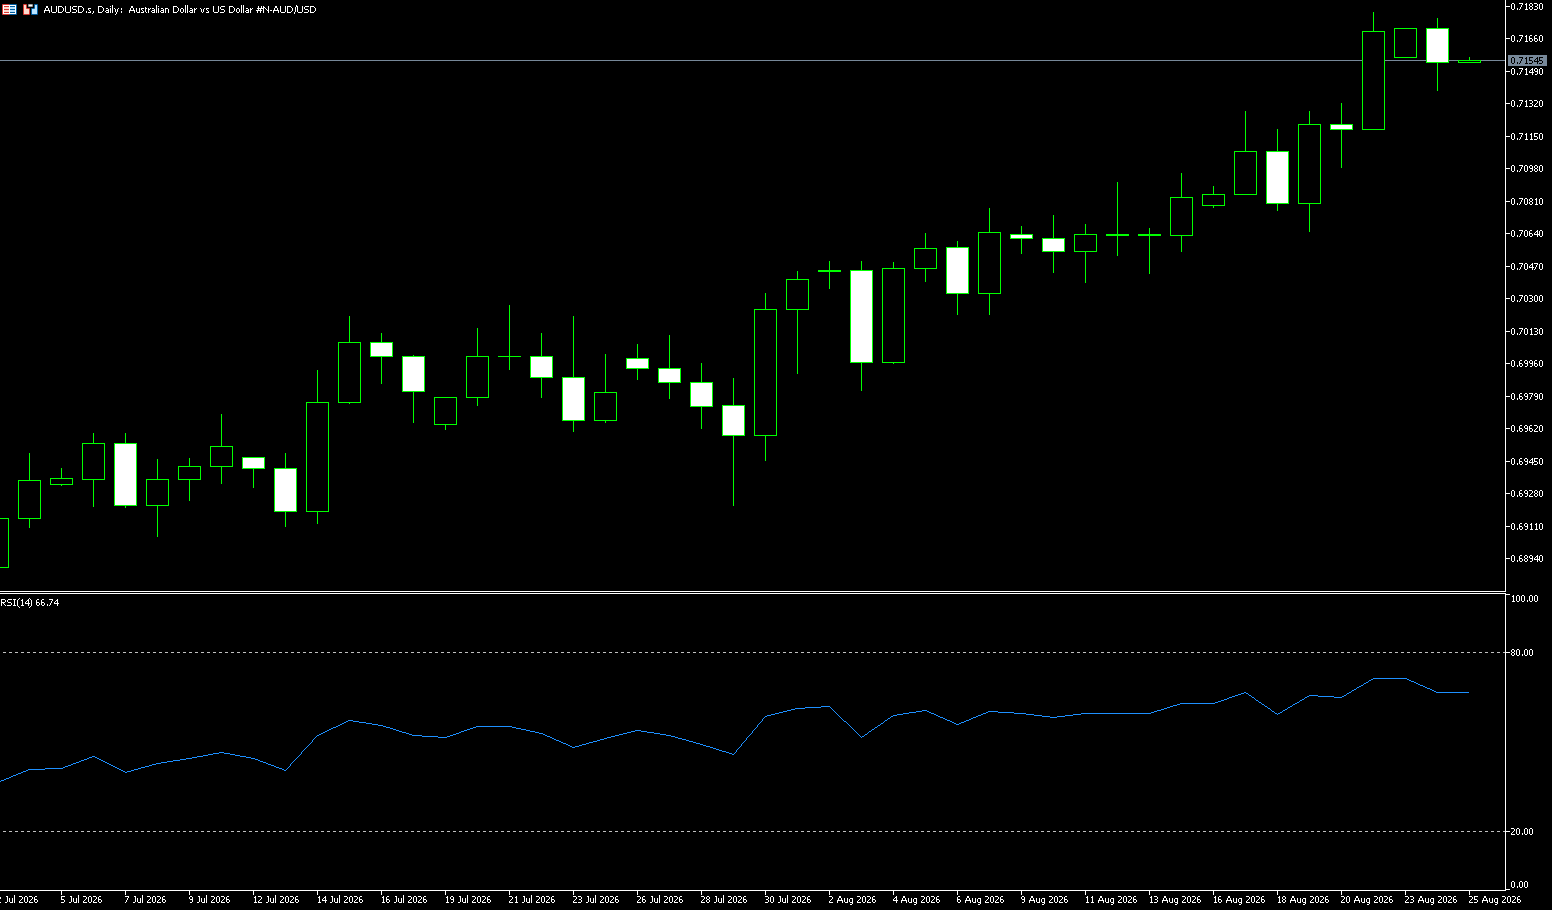
The AUD/USD pair regained upward momentum after a slight decline the previous day due to weak Australian employment data, climbing to a new high since early June in the first half of the European session. The spot price is currently trading slightly above the mid-range of 0.7100 and is still on track for its seventh consecutive week of gains given the favorable fundamental environment. In early Asian trading on Monday, AUD/USD rose slightly around 0.7165. The USD/AUD weakened slightly due to market concerns about the US Treasury expanding its longer-term government bond buyback program. The Reserve Bank of Australia's meeting minutes will be released later on Tuesday. US Treasury Secretary Scott Bessant said on Thursday that the Treasury might increase the bond buyback program to over $4 billion, partly to indicate that current yields do not reflect underlying economic fundamentals. Previously, the department unexpectedly pledged to at least double the size of its longer-term debt buyback program in an effort to curb bond yields. However, escalating tensions in the Middle East could boost safe-haven inflows, helping to limit the dollar's decline.
From a technical perspective, the latest rally confirms a new breakout above the 61.8% Fibonacci retracement level of the May-June decline. Furthermore, the 14-day Relative Strength Index (RSI) is near 69, indicating that momentum, while slightly bullish, remains constructive, and the slightly positive MACD reading above the zero line also provides support. Conversely, this pattern further validates the short-term bullish outlook for AUD/USD. Meanwhile, the 78.6% Fibonacci retracement level at 0.7188 and the psychological level of 0.7200 may temporarily limit gains. A sustained break above these resistance levels is needed to open up space towards the higher upside target of 0.7273 (the May 13 high). On the downside, initial support lies at the 61.8% Fibonacci retracement level of 0.7119, with a stronger structural bottom formed by the 50.0% Fibonacci retracement level at 0.7070 and the nearby 100-day simple moving average at 0.7072. A break below this range, coupled with accelerating selling pressure, could trigger a deeper pullback.
Consider going long on the Australian dollar today at 0.7140, with a stop-loss at 0.7130 and targets at 0.7185 and 0.7200.
GBP/USD
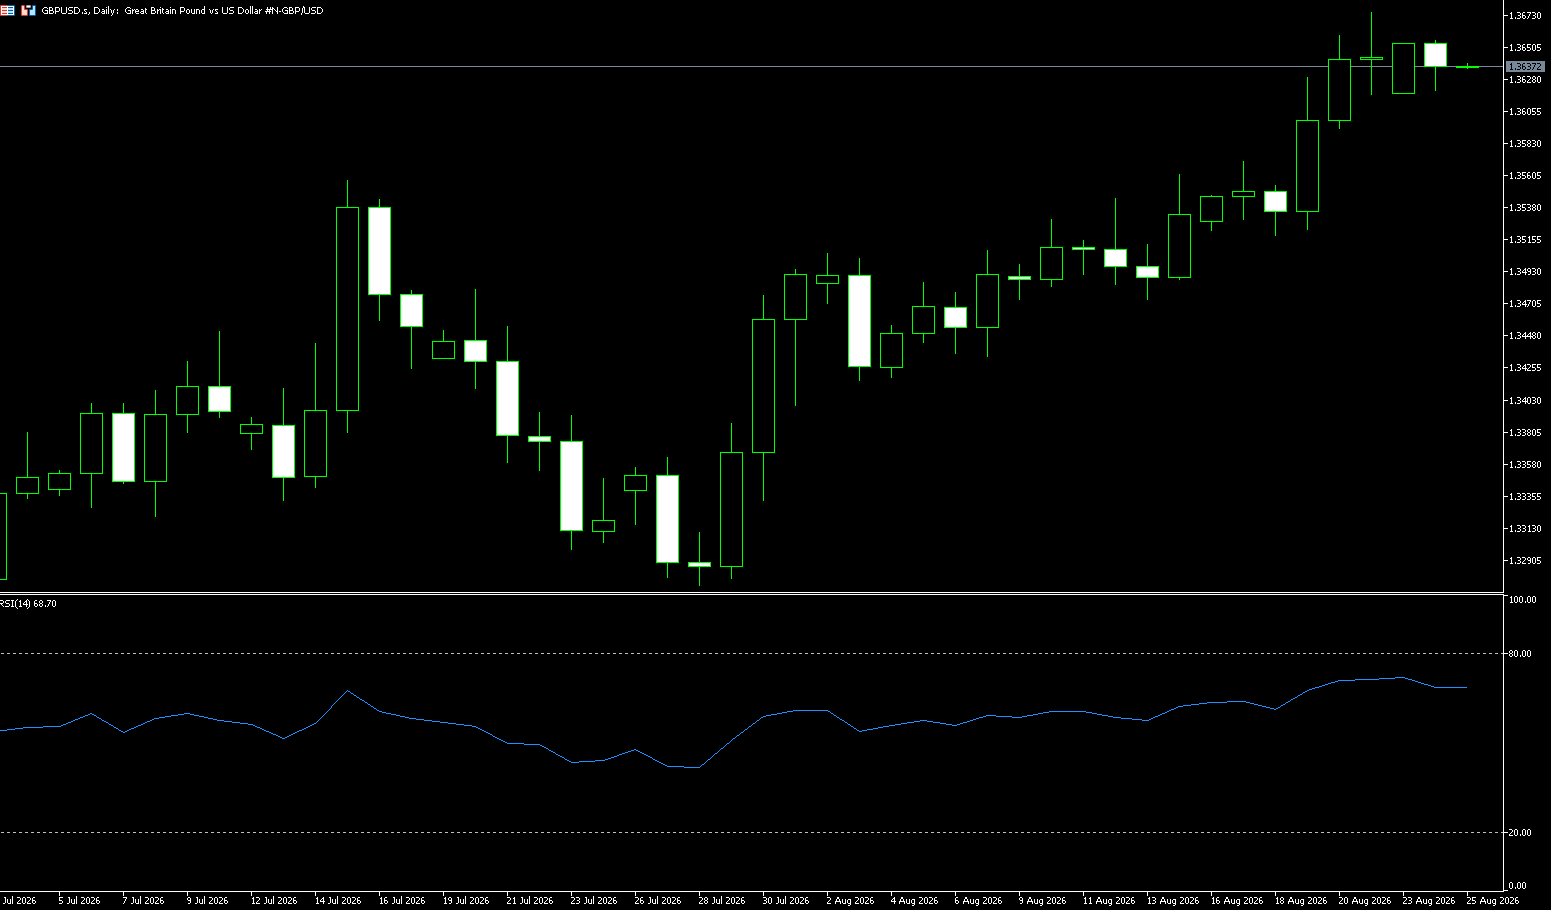
The pound/dollar pair started the new week with a positive bias near the 1.3600 mid-range and remains well within striking distance of the highest level since February 11 reached last Friday. Furthermore, the fundamental backdrop favors bullish traders and supports the view that this nearly one-month uptrend will continue. The dollar continues to struggle to achieve any meaningful rally and hovers near its lowest level in over three months, which in turn is seen as a key factor supporting the GBP/USD pair. Traders have been reducing their bets on an immediate Federal Reserve rate hike as signs of easing price pressures emerge. Furthermore, the U.S. Treasury's announcement last Wednesday that it would at least double its long-term government debt repurchase operations starting in September triggered a decline in U.S. Treasury yields. This put dollar bulls on the defensive and validated the pair's positive short-term outlook. However, further escalation of tensions between the U.S. and Iran could help limit the decline in the safe-haven dollar. Additionally, inflationary risks stemming from oil price volatility support the prospect of at least one Fed rate hike before the end of the year. This could prevent traders from building new bearish bets on the dollar and limit the upside potential for the GBP/USD pair.
On the daily chart, GBP/USD maintains a short-term bullish bias as the spot price holds above the 100-day simple moving average at 1.3435 and the Bollinger Band middle line at 1.3502. The exchange rate is approaching the Bollinger Band upper band at 1.3675, highlighting a strong upward extension. The Relative Strength Index (RSI) (14) is around 71, entering overbought territory, indicating strong upward momentum but also increasing the likelihood of a corrective pause. On the upside, near-term resistance lies at the Bollinger Band upper band at 1.3675. A sustained break above this level would open up further upside potential to 1.3700 (a psychological level) and 1.3750. On the downside, initial support is seen at 1.3600-1.3594 (a psychological level; last Wednesday's low), followed by the psychological level of 1.3500. A pullback to this layered support zone could be seen as a buying opportunity.
Consider going long on GBP/JPY at 1.3620 today, with a stop-loss at 1.3610 and targets at 1.3670 and 1.3680.
USD/JPY
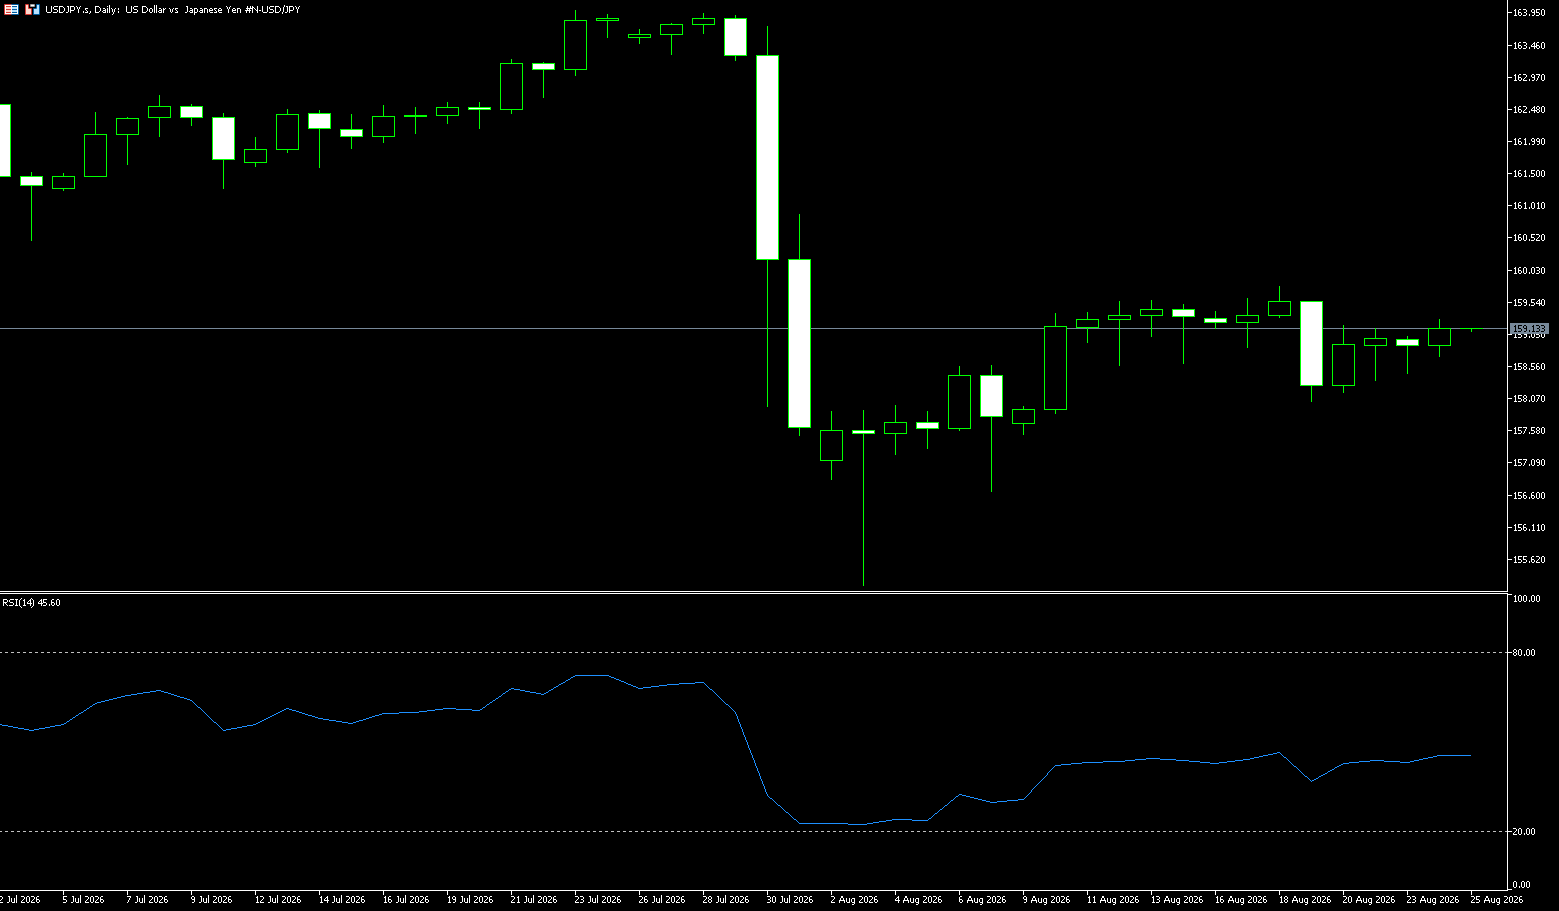
The USD/JPY pair started the week with a relatively weak tone, but downside was supported by mixed fundamental signals. The dollar hovered near a three-month low as market bets on a Fed rate hike cooled; meanwhile, expectations of faster policy tightening by the Bank of Japan provided support for the yen, putting pressure on the pair. However, the persistently wide USD/JPY interest rate differential, coupled with concerns about deteriorating Japanese fiscal conditions, limited the yen's upside. Furthermore, escalating tensions between the US and Iran provided a tailwind for the safe-haven dollar and the pair; the resilience of the US economy may limit downside pressure on the dollar by reducing the need for monetary easing. Therefore, the outlook for USD/JPY remains constrained by two expectations: on the one hand, the expectation of a more tightening Bank of Japan, which supports the yen; on the other hand, robust US economic activity, which may maintain a scenario of "higher and longer" US interest rates.
On the daily chart, USD/JPY is trading around 159.00, maintaining a short-term bearish bias as the spot price remains below the 20-day exponential moving average (EMA) at 159.20. The pair is trading below this short-term trendline, indicating that upward attempts are likely to be limited given weak momentum. The 14-day Relative Strength Index (RSI) is hovering around 39, suggesting weak demand but not yet oversold. On the upside, near-term resistance lies at the 20-day EMA at 159.20, which is the first hurdle for any rebound attempt, and holding below this level further strengthens the bearish tone. With no clear support levels in the immediate data, the market focus remains on whether sellers can maintain pressure below 159.80 (last week's high) and 160.00 (a psychological level). A decisive break and hold above the EMA is needed to alleviate the current downward bias. Support levels to consider are 158.05 (last week's low) and 158.00 (a psychological level). Strong support lies at 157.43 (234-day moving average).
Consider shorting the US dollar at 159.20 today, with a stop-loss at 159.40 and targets at 158.50 and 158.60.
EUR/USD
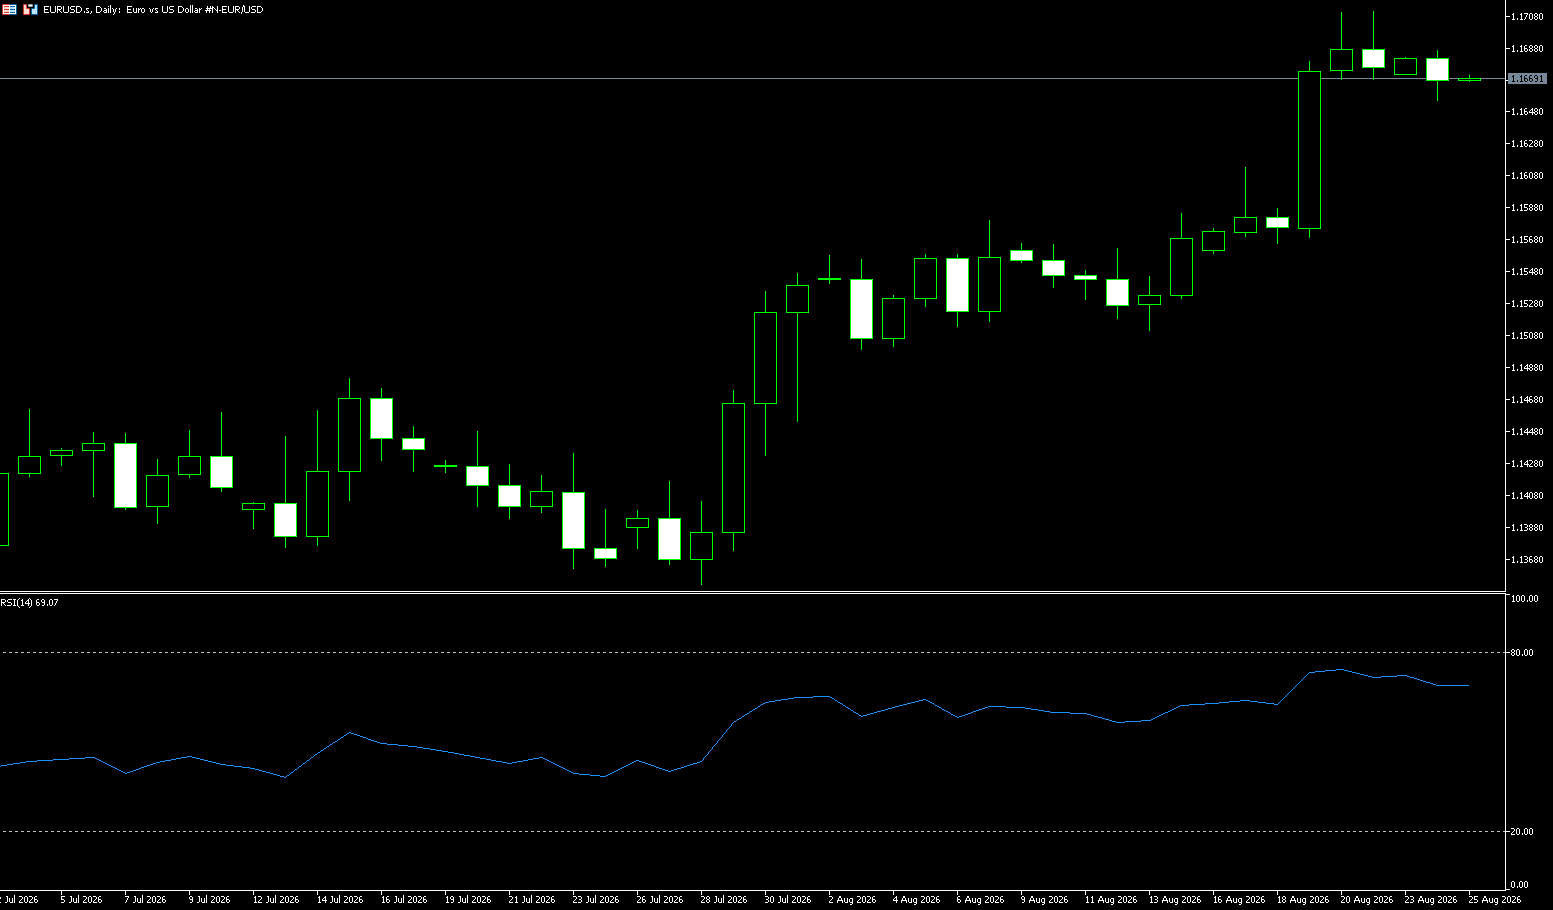
The euro/dollar pair strengthened for the fourth consecutive trading day during Monday's Asian session, hovering around 1.1670. The pair remained firm as newly announced US fiscal measures pressured the dollar. The U.S. Treasury unexpectedly pledged to at least double its buyback program for long-term government debt in an attempt to curb rising bond yields. Treasury Secretary Scott Bessant indicated the buyback program could expand to over $4 billion, a strategic move designed to demonstrate that high yields are not truly aligned with underlying economic fundamentals. Despite pressure on the dollar, further upside for the euro/dollar pair may remain limited due to safe-haven demand supported by escalating geopolitical tensions in the Middle East. In Europe, the euro is finding fundamental support from stubborn inflation data and continued expectations of a sustained European Central Bank monetary policy.
The euro/dollar pair maintains a short-term bullish bias above the 200-day simple moving average at 1.1631 and the 61.8% Fibonacci retracement level of the April-June decline at 1.1644. This suggests that a pullback may attract buying, and the broader rally from the 1.1323 cycle low remains intact. The 14-day Relative Strength Index (RSI) continues to rise to 73, entering overbought territory and indicating a short-term pullback risk. The MACD remains positive, further supporting the bullish outlook. A test of the 78.6% Fibonacci retracement level at 1.1731 is possible, followed by the April swing high near 1.1843. On the downside, initial support is seen at the 61.8% Fibonacci retracement level at 1.1644 and the 200-day simple moving average at 1.1631, followed by a deeper test of the 1.1600 psychological level, and Fibonacci levels at 1.1583 and 1.1521.
Today, consider going long on the Euro at 1.1655, with a stop-loss at 1.1645 and targets at 1.1700 and 1.1710.
Stock Analysis:
Australian ASX 200 Stock Index
Basic Market Overview:
The Australian Securities Exchange (ASX) 200 index rose 44 points, or 0.5%, to close at 9,103 on Monday, reversing earlier losses. Non-energy mining, manufacturing, consumer services, and logistics led the gains. Traders ignored weakness in US stock index futures, focusing instead on Federal Reserve Chairman Warsh's upcoming Jackson Hole speech for interest rate signals, despite high oil prices and multi-decade high global bond yields. Local markets are focused on Australian July inflation data to be released on Wednesday, after the June reading fell to 3.8% from 4%. Fuel retailer Ampol rose 4.3%, hitting a two-year high, as refining margins linked to Middle East supply disruptions nearly quintupled.
Mining stocks also rose, with BHP Billiton up 3.0% and Rio Tinto up 1.2%, driven by strong copper prices. Gold prices rose, with Northern Star Resources up 1.7% and Evolution Mining up 2.5%. In contrast, energy stocks performed weakly, with Santos down 1.8% and Woodside down 0.9%. The four major banks fell between 0.3% and 0.7%, while Endeavour Group plunged 4.7% due to a sharp decline in profits.
Sector Performance:
Leading Sectors: Raw materials (mining, gold mining) led the gains, driven by stronger copper and gold prices; consumer services and logistics sectors also strengthened.
Leading Sectors: Major bank stocks weakened slightly; some energy stocks retreated; individual consumer stocks fell sharply due to poor earnings.
Heavyweight Stocks: BHP +3.0%, Rio Tinto +1.2%; Gold mining company Evolution Mining +2.5%; Santos -1.8%, Woodside -0.9%.
Technical Analysis:
The ASX200 stock index dipped slightly to around 9070 in the morning session on Monday, finding support with buying. It then rallied to a high of 9125 in the afternoon before fluctuating downwards. Buying returned towards the close, resulting in a low of 9103, forming a small bullish candlestick with a relatively long lower shadow, indicating a bottoming-out and rebound pattern. The index closed above the 9100 level. Moving Averages and Structure: The index is currently in a high-level consolidation range, with strong support forming in the 9000-9060 range. However, it is still some distance from the year's high of 9296.7, and any short-term rebound faces resistance. While bullish momentum recovered somewhat during the day, the afternoon pullback suggests that selling pressure has not completely dissipated, indicating a consolidation rather than a strong upward trend. The index is currently in a range-bound pattern, with the ADX indicator showing weakness and no clear directional trend, suggesting continued range-bound fluctuations are likely. If the price holds above 9130, the bulls may further test the 9180-9200 range; if it falls below 9070, the index will retest the 9030-9050 support level; a close below 9000 would confirm short-term weakness and open up further downside potential.
Trading Strategy:
Short-term Trading Strategy (Intraday - Short-term Perspective)
1. Bullish Strategy: Consider going long if a pullback to the 9070-9080 support zone shows a reversal candlestick pattern; place a stop-loss below 9025; first target 9125, second target 9180-9200, take profit in batches upon reaching the targets.
2. Short-selling strategy: If the price rebounds to the 9125-9130 resistance zone and shows signs of pulling back after a surge, a small short position can be initiated; the stop-loss should be set above 9160; the first target is 9070, and the second target is 9030-9050.
3. Observation strategy: With the index fluctuating narrowly between 9080 and 9125 without a clear breakout signal, it is advisable to observe first, avoid chasing highs and lows, and wait for a valid breakout/breakdown of the range before entering a position.
Key risk warnings:
1. Australia's July inflation data will be released on Wednesday. Higher-than-expected data will increase expectations of a Reserve Bank of Australia rate hike, suppressing the stock market and causing significant index volatility.
2. Globally, speeches by officials at the Jackson Hole symposium and significant fluctuations in US Treasury yields will have a ripple effect on Australian stocks. The resource sector is heavily influenced by overseas commodity prices.
3. 9000 is a key psychological and technical level. A break below this level with significant volume would trigger algorithmic selling, accelerating the correction.
4. The ASX200 is highly influenced by expectations of Chinese commodity demand. Domestic macroeconomic news directly impacts mining stocks, leading to market volatility.
Japan Stock Market Index (JP225)
Basic Market Overview:
The Nikkei 225 fell 0.7% on Monday to close at 65,528, continuing its decline from the previous trading day, as technology stocks were pressured ahead of Nvidia's earnings report later this week. High global bond yields also dampened investor sentiment, and last week's unexpected bond buyback program announced by the US Treasury failed to alleviate concerns about inflation and rising government debt. Inflation concerns persist due to ongoing tensions in the Middle East, and the US is expected to announce new sanctions against Iran later that day.
Among Japanese chip and AI-related stocks, the biggest decliners included Kioxia Holdings (-6.2%), Advantest (-3.9%), Taiyo Yuden (-1.6%), Fujikura (-5%), SoftBank Group (-5.3%), Murata Manufacturing (-0.3%), Laser Technology (-0.9%), and Furukawa Electric (-5.1%). Financial and consumer stocks also closed higher, with Mitsubishi UFJ down 0.8%, Toyota Motor down 0.2%, and Fast Retailing down 0.9%.
Sector Performance:
Leading Declining Sectors: Information and Communication, Semiconductor Equipment, Insurance; SoftBank Group, Advantest Testing, and Kioxia Holdings saw the largest declines.
Leading Gaining Sectors: Services, Construction, Other Products; Defensive and cyclical sectors at lower levels showed relative resilience.
Technical Analysis:
The Nikkei 225 closed at 65528.09 points on Monday, down 488.27 points, or -0.74%. The intraday range was 65470.95-66257.73 points, briefly turning positive before declining due to increased selling pressure in the afternoon. Market characteristics: Pressured by rising US and Japanese long-term bond yields, AI and semiconductor heavyweights saw profit-taking. There was some bargain hunting, but the buying power was insufficient. Funds rotated from overvalued technology sectors to previously lagging sectors. The TOPIX index closed slightly higher, showing significant divergence among indices. Rising US Treasury yields, Middle East tensions pushing up oil prices, market concerns about the Bank of Japan tightening monetary policy earlier than expected, and a collective pullback in Asia-Pacific technology stocks dragged down the Nikkei heavyweights. The daily RSI-14 is approximately 48.4, in the neutral range and not yet oversold; the MACD shows a bearish signal, and the stochastic oscillator is nearing oversold territory, indicating a short-term consolidation pattern with balanced bullish and bearish forces. Moving Averages: The 5/10-day moving averages are suppressing the price downwards. The 20-day moving average, around 65528, coincides with the current price, becoming a short-term dividing line between bullish and bearish sentiment. The 50-day moving average is trending downwards, interrupting the medium-term upward momentum and entering a consolidation phase.
Tuesday's Scenario Forecast—Slightly Strong Scenario: A firm hold above 65530 would lead to a rebound to test 66260, with a potential breakout to 67020. Slightly Weak Scenario: A break below 65040 support would lead to further declines to the 64150 area, deepening the short-term pullback.
Trading Strategy:
Operational Strategy (Short-Term Trading Perspective)
1. Bullish Strategy: If the price retraces and stabilizes near the 65040-65100 range, consider a small long position; place a stop-loss below 64900; the first target is 66260, with a breakout targeting 67020. If the price opens higher, do not chase the price; wait for a pullback to support before considering a long position.
2. Short Selling Strategy: If the price rebounds to 66200-66260 and encounters resistance, a small short position can be initiated; stop loss above 66400; target 65040, with a further target of 64150 if it breaks below.
Key Risk Warnings:
1. Significant Fluctuations in the Japanese Yen Exchange Rate: A rapid strengthening or weakening of the USD/JPY exchange rate will directly impact export-heavy stocks, causing significant volatility in the Nikkei 225.
2. US Treasury Yields and Overnight US Stock Market Performance: Fluctuations in US tech stocks will directly impact the Nikkei semiconductor and AI sectors; overnight overseas market risks cannot be ignored.
3. Geopolitical Risks: The situation in the Middle East is disrupting oil prices. Japan is highly dependent on energy imports; rising oil prices increase corporate costs and suppress risk appetite in the stock market.
4. Changes in Bank of Japan Policy Expectations: Changes in inflation data will cause the market to reprice the pace of interest rate hikes, impacting Japanese stock valuations.
Disclaimer: The information contained herein (1) is proprietary to BCR and/or its content providers; (2) may not be copied or distributed; (3) is not warranted to be accurate, complete or timely; and, (4) does not constitute advice or a recommendation by BCR or its content providers in respect of the investment in financial instruments. Neither BCR or its content providers are responsible for any damages or losses arising from any use of this information. Past performance is no guarantee of future results.
More Coverage






2026 © - All Rights Reserved by BCR Co Pty Ltd
Risk Disclosure:Derivatives are traded over-the-counter on margin, which means they carry a high level of risk and there is a possibility you could lose all of your investment. These products are not suitable for all investors. Please ensure you fully understand the risks and carefully consider your financial situation and trading experience before trading. Seek independent financial advice if necessary before opening an account with BCR.
BCR Co Pty Ltd (Company No. 1975046) is a company incorporated under the laws of the British Virgin Islands, with its registered office at Trident Chambers, Wickham’s Cay 1, Road Town, Tortola, British Virgin Islands, and is licensed and regulated by the British Virgin Islands Financial Services Commission under License No. SIBA/L/19/1122.
Open Bridge Limited (Company No. 16701394) is a company incorporated under the Companies Act 2006 and registered in England and Wales, with its registered address at Kemp House, 160 City Road, London, England, EC1V 2NX. Open Bridge Limited acts solely as a payment processor for BCR Co Pty Ltd and does not provide any financial, trading, or investment services on its behalf. Open Bridge Limited's role is limited to payment processing.


 English
 简体中文
简体中文
 繁體中文
繁體中文
 Bahasa
Melayu
Bahasa
Melayu
 Tiếng
Việt
Tiếng
Việt
 ไทย
ไทย
 日本語
日本語
 한국어
한국어
 ភាសាខ្មែរ
 español