


0
US Dollar Index
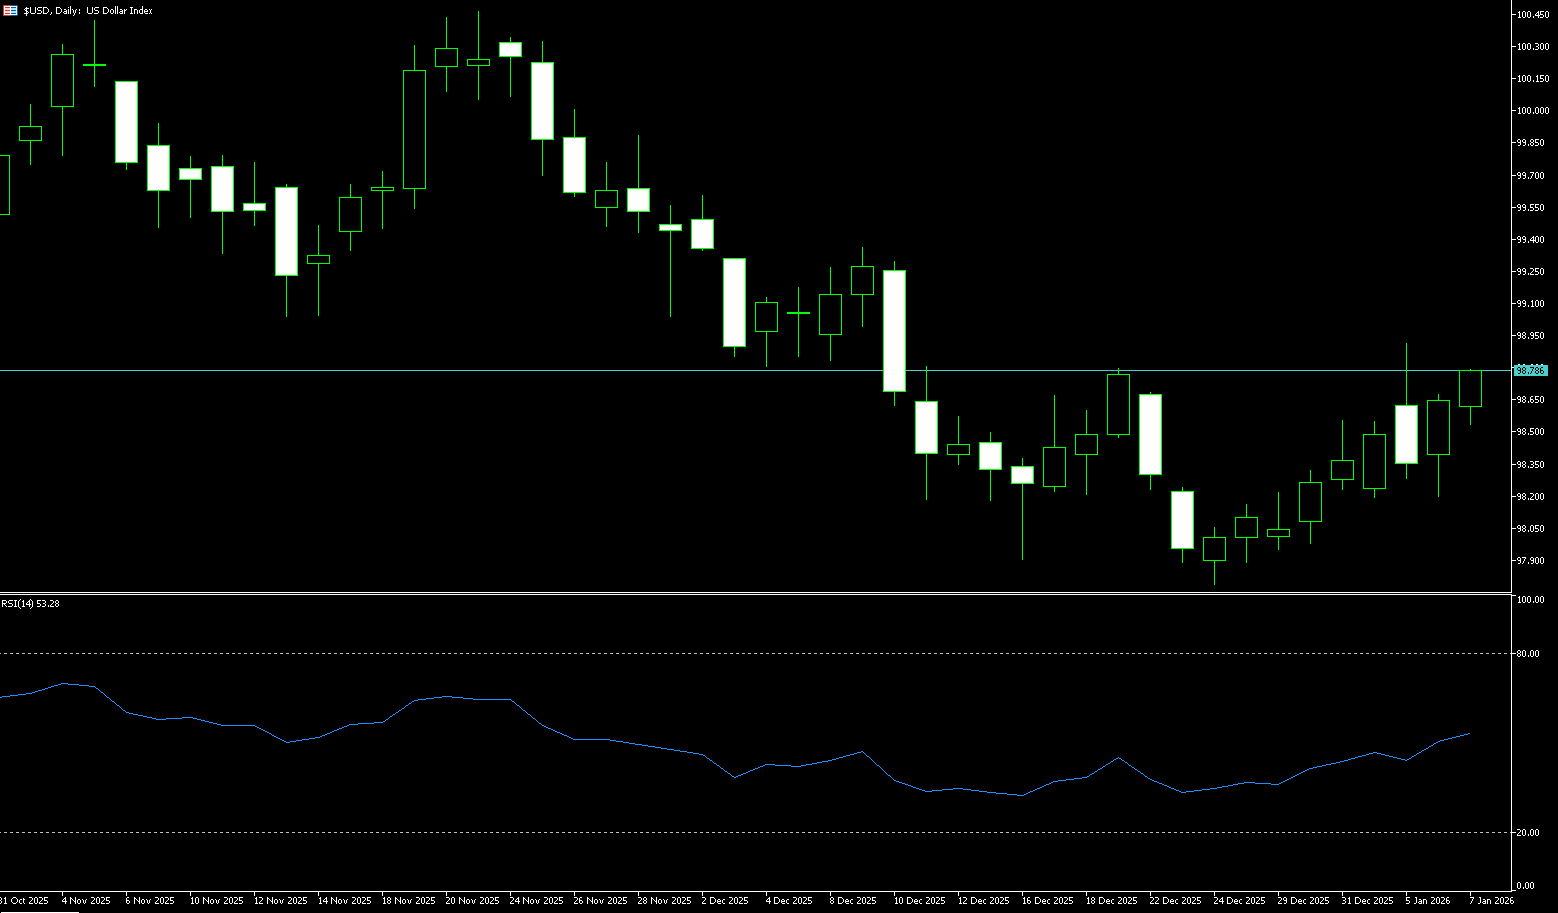
The US dollar index rose to 98.67 on Wednesday, a four-week high, as investors weighed mixed economic signals and the Federal Reserve's interest rate path amid ongoing geopolitical tensions. Markets continue to anticipate at least two rate cuts this year. On the employment front, December's ADP private sector employment rose by 41,000, below the median forecast of 50,000, while November's Jolts job openings also fell short of expectations, indicating weak labor demand. However, the December ISM services index unexpectedly rose, with its employment component expanding for the first time since May, suggesting resilience in the services sector. Traders are now awaiting Friday's broader Labor Department jobs report for clearer guidance on the labor market and Fed policy. Geopolitical concerns, including US actions in Venezuela, tensions in Greenland, and escalating friction between China and Japan, also supported demand for safe-haven assets, helping to boost the dollar.
The 4-hour chart shows that the price is oscillating around the Bollinger Band's central axis. Resistance levels to watch are the upper Bollinger Band at 98.77 and the psychological level of 99.00. Support levels to watch are the lower Bollinger Band at 98.10 and the psychological level of 98.00. In the MACD indicator, the DIFF and DEA lines are converging above the zero line, but the DIFF (0.0458) is slightly lower than the DEA (0.0696), indicating weakening upward momentum in the short term and a risk of consolidation or pullback. In the next 2-3 days, the 98.77-99.00 area will be a key resistance zone. Failure to break through this level could lead to a pullback to the 98.10-98.00 area to find support. A sustained break below this level could open the way to 97.75 (the low of December 24th), potentially turning the short-term direction bearish.
Today, consider shorting the US Dollar Index around 98.80; Stop loss: 98.90; Target: 98.40; 98.30
WTI Crude Oil
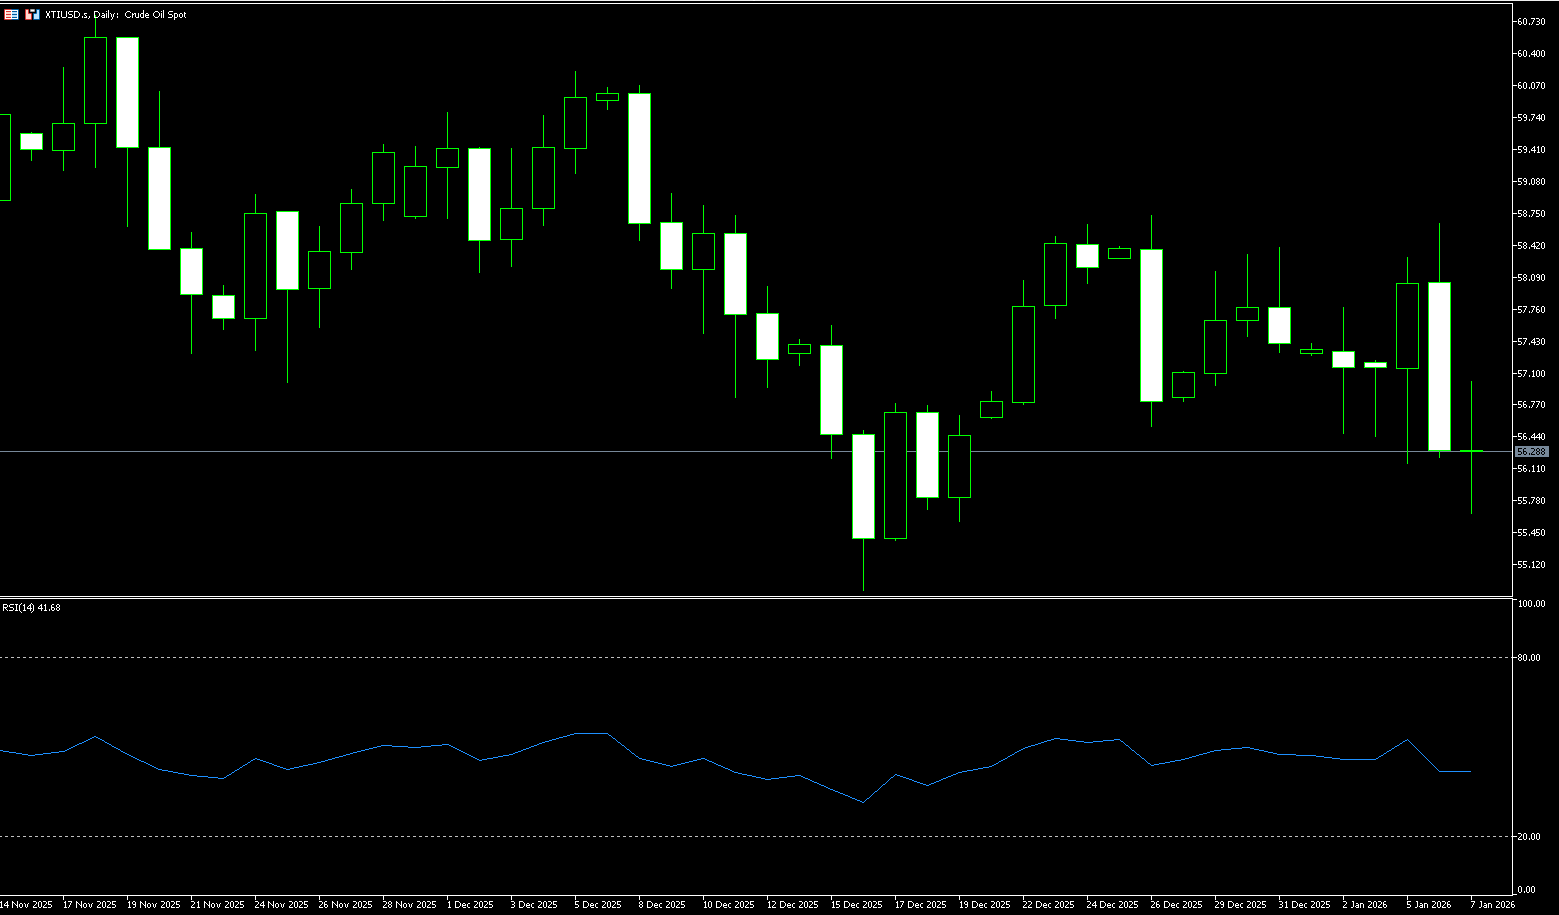
On Wednesday, US crude oil traded around $56.60 per barrel. Oil prices fell on Tuesday as the market weighed expectations of ample global supply in 2026 against uncertainty surrounding Venezuelan oil production following the arrest of leader Maduro. It is too early to assess the impact of Maduro's arrest on the oil supply-demand balance, but regardless of whether this OPEC member increases production, oil supply is expected to remain ample in 2026. Global oil demand grew by approximately 900,000 barrels per day last year, below the historical trend of 1.2 million barrels per day, while OPEC and non-OPEC supply are projected to increase by 1.6 million barrels per day and approximately 2.4 million barrels per day respectively during the fourth quarter of 2024 and the fourth quarter of 2025, potentially leading to a surplus of up to 3 million barrels per day in the first half of 2026. The US arrest of Maduro on Saturday could accelerate the end of the oil embargo on Venezuela, potentially boosting production and further exacerbating price pressures. The market is closely watching the future direction of Venezuelan oil supplies.
For the oil market, the current situation does not signify a shift in the global supply landscape. The situation in Venezuela is more likely to add a short-term geopolitical risk premium to oil prices, reflecting uncertainty rather than a fundamental change in crude oil availability. The daily chart shows that US crude oil prices are trading steadily within a long-term downward channel, and a long-term bearish bias is more likely to dominate. The 14-day Relative Strength Index (RSI) is trading near its midline at 42.85, indicating a lack of clear directional guidance for oil prices in the short term. On the upside, $57.22 (the 20-day simple moving average) presents significant initial resistance; a decisive break above this level could reverse the short-term bearish bias and push prices towards $58.51 (the 50-day simple moving average). On the downside, $55.14 (May 5th low) provides initial support; a break below this level would target $54.88 (December 16th low).
Consider going long on spot crude oil around $56.47 today; stop loss: $56.30; target: $58.00; $57.80
Spot Gold
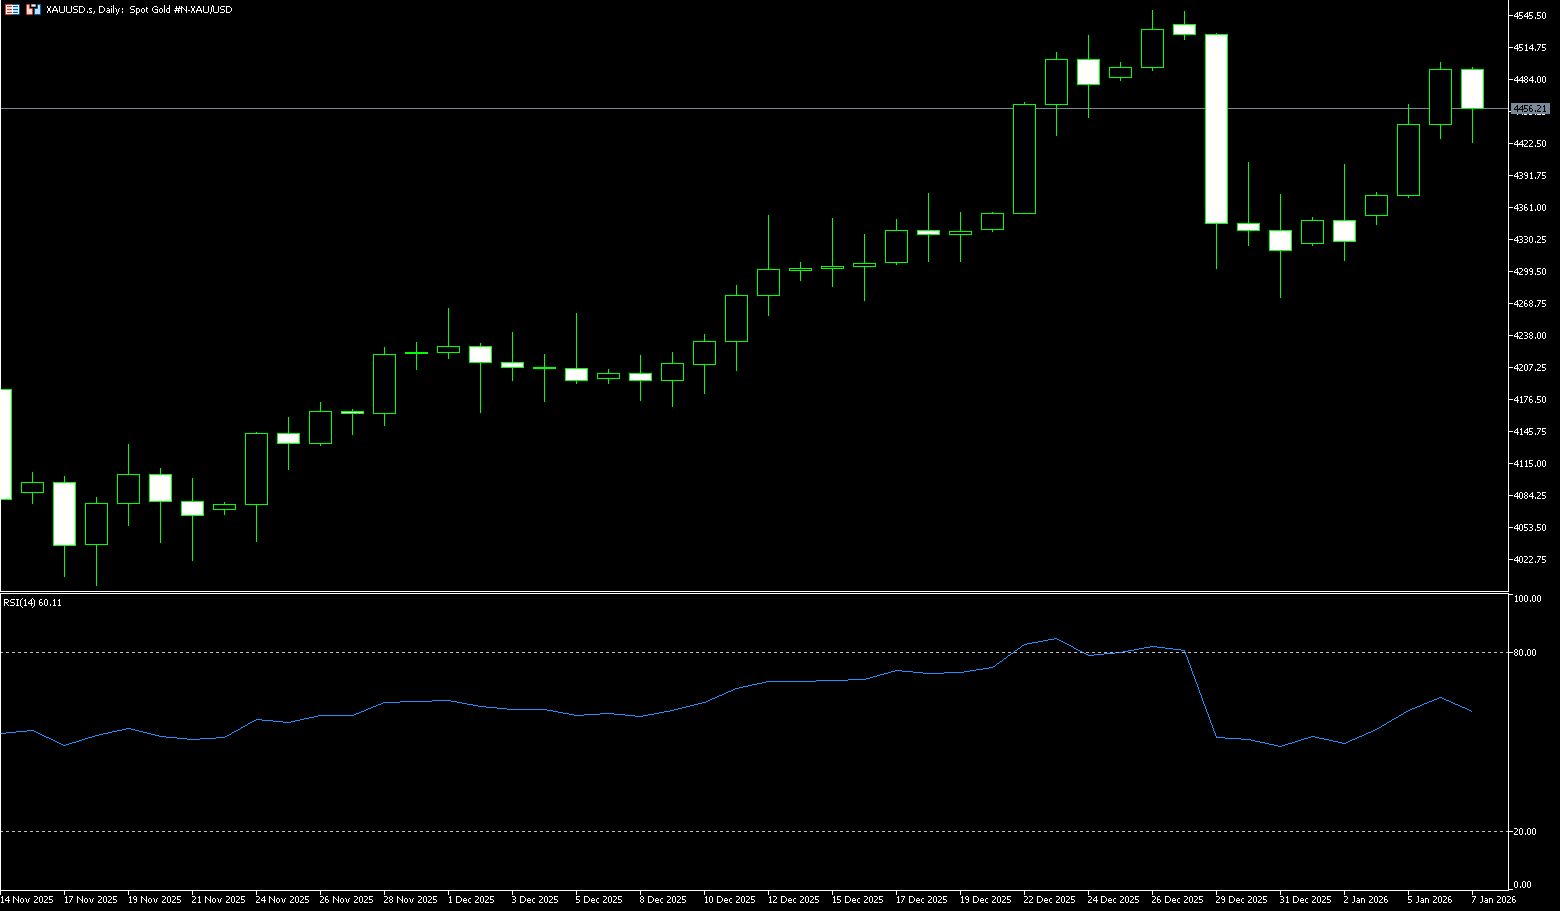
On Wednesday, spot gold continued to rise, approaching the $4,500/ounce mark, boosted by safe-haven demand due to escalating geopolitical tensions. The market is also focused on upcoming US employment data to gauge the direction of the Federal Reserve's interest rate policy. The US weekend's arrest of Venezuelan President Maduro exacerbated global tensions; the ousted Maduro denied drug charges on Monday, and precious metal traders currently see more risk than stock and bond traders. This event continues to stimulate safe-haven demand for gold and silver. On the other hand, gold is entering 2026 with its historic multi-year upward momentum. Despite continuously hitting record highs in 2024-2025 and often being labeled "overbought," market open interest remains within a reasonable range. One key reason is that during the precious metals sector's correction, gold has consistently experienced the smallest pullback. More importantly, institutional holdings still have significant room for expansion. This round of gains is not driven by short-term speculative funds, but rather by structural demand that has not yet peaked, making it more sustainable.
From a technical analysis perspective, the gold trend remains positive, with prices consistently moving in a clear upward pattern of rising highs and lows. Regarding support levels, the $4,350-$4,380 range needs close attention. This area acted as strong resistance last October, which gold only successfully broke through in December. At the beginning of this year, gold briefly broke below this range but quickly recovered. The next important support level will be around $4,250. As for resistance levels, $4,500 remains a key level. Looking at the price action on December 29th last year, gold prices experienced a sharp drop after reaching that level, indicating significant selling pressure above this level. If gold prices can break through and hold above $4,500, market focus will shift to the liquidity zone above the all-time high of $4,549.80 reached in December last year. Once this all-time high is broken, there will be no significant resistance levels on the chart, and subsequent targets could be the psychological levels of $4,600 and $4,700.
Today, consider going long on spot gold around 4,445; Stop loss: 4,440; Target: 4,480; 4,490
AUD/USD
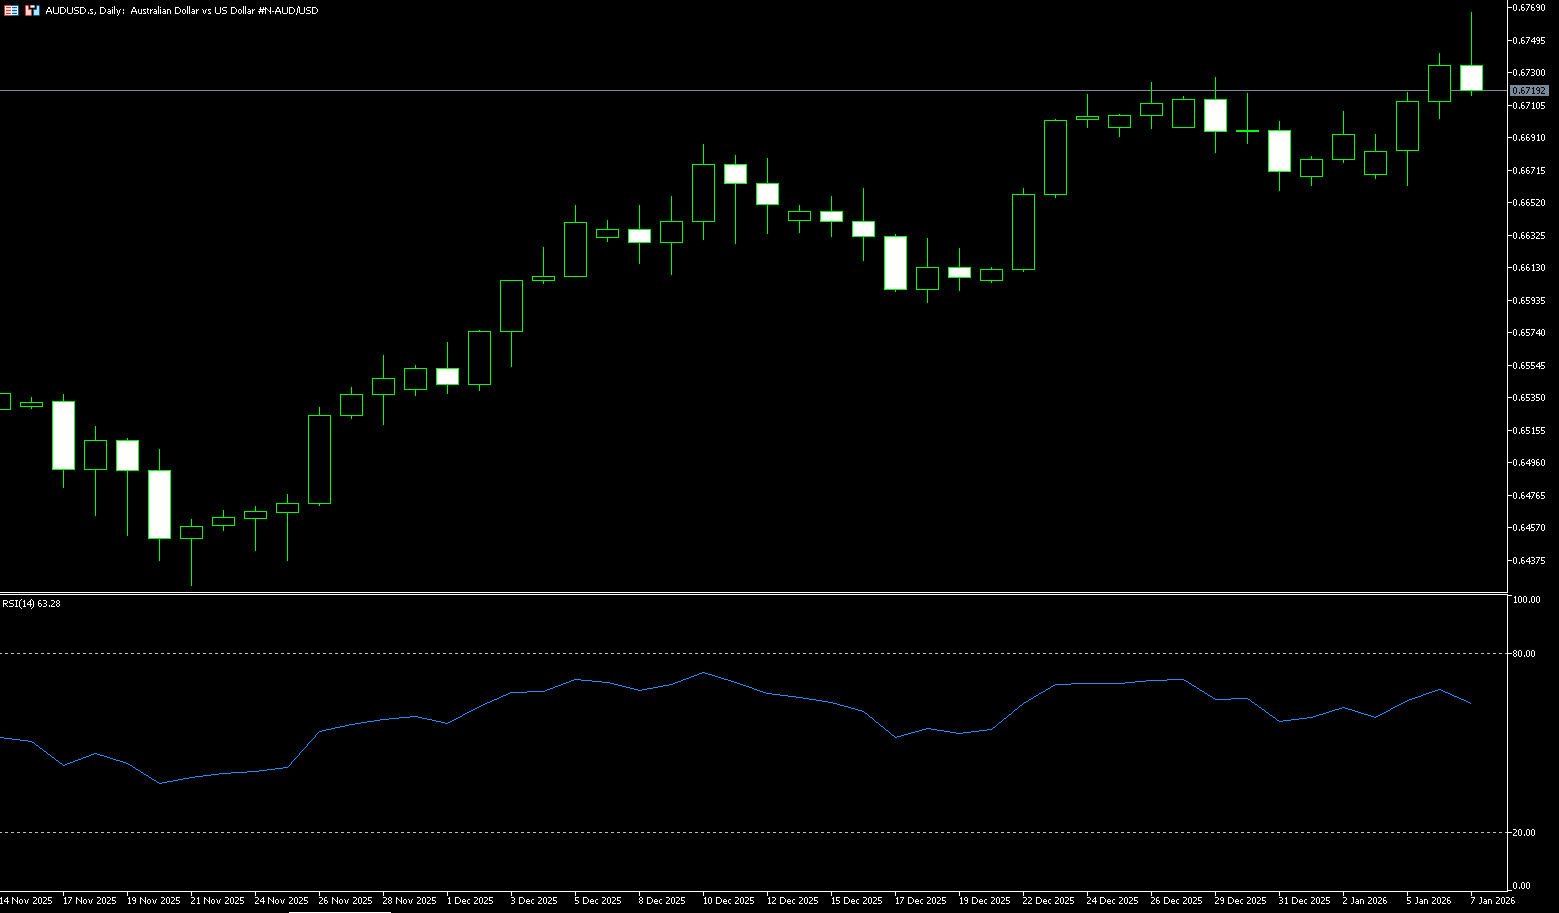
The Australian dollar rose to around US$0.6766 on Wednesday, reaching a 15-month high, despite a slight slowdown in the latest inflation report, while the near-term outlook for interest rate hikes remains firm. Data shows that the total CPI rose 3.4% year-on-year in November, down from 3.8% in October and below the forecast of 3.6%, while the closely watched revised average index fell from 3.3% to 3.2%. These figures remain well above the Reserve Bank of Australia's target range of 2% to 3%, keeping the possibility of an interest rate hike next month alive. Attention is now focused on the full fourth-quarter inflation report to be released later this month, with analysts warning that a core inflation rate of 0.9% or higher could prompt the RBA to tighten policy at its February meeting. The central bank has already hinted that the 3.6% cash rate may need to be raised if price pressures fail to ease.
From a daily chart perspective, the exchange rate has maintained an upward trend since rebounding from the previous low of around 0.6420, recently reaching a high of around 0.6766. However, resistance at 0.6770 (the high of October 8th last year) and the psychological level of 0.6800 was again demonstrated by a "touch and pullback" on the same day. On the chart, the 0.6675 and 0.6659 (last week's low) areas can be considered reference zones where recent bullish and bearish divergence is concentrated: repeated testing of resistance above suggests that bulls need new fundamental catalysts to upgrade the "rebound" into a "trend extension"; if a pullback occurs below, whether it can still find support near the previous breakout area will reflect the market's confidence in the RBA's hawkish pricing. In terms of momentum indicators, the RSI is around 70, showing short-term strength but approaching a more sensitive congestion zone; the MACD is still above the zero line with a small histogram amplitude, meaning the trend is still intact but the willingness to accelerate is limited. Considering these signals, a more accurate description of the current situation is "strong oscillation" rather than a smooth one-sided trend.
Consider going long on the Australian dollar around 0.6713 today; Stop loss: 0.6700; Target: 0.6760; 0.6770
GBP/USD
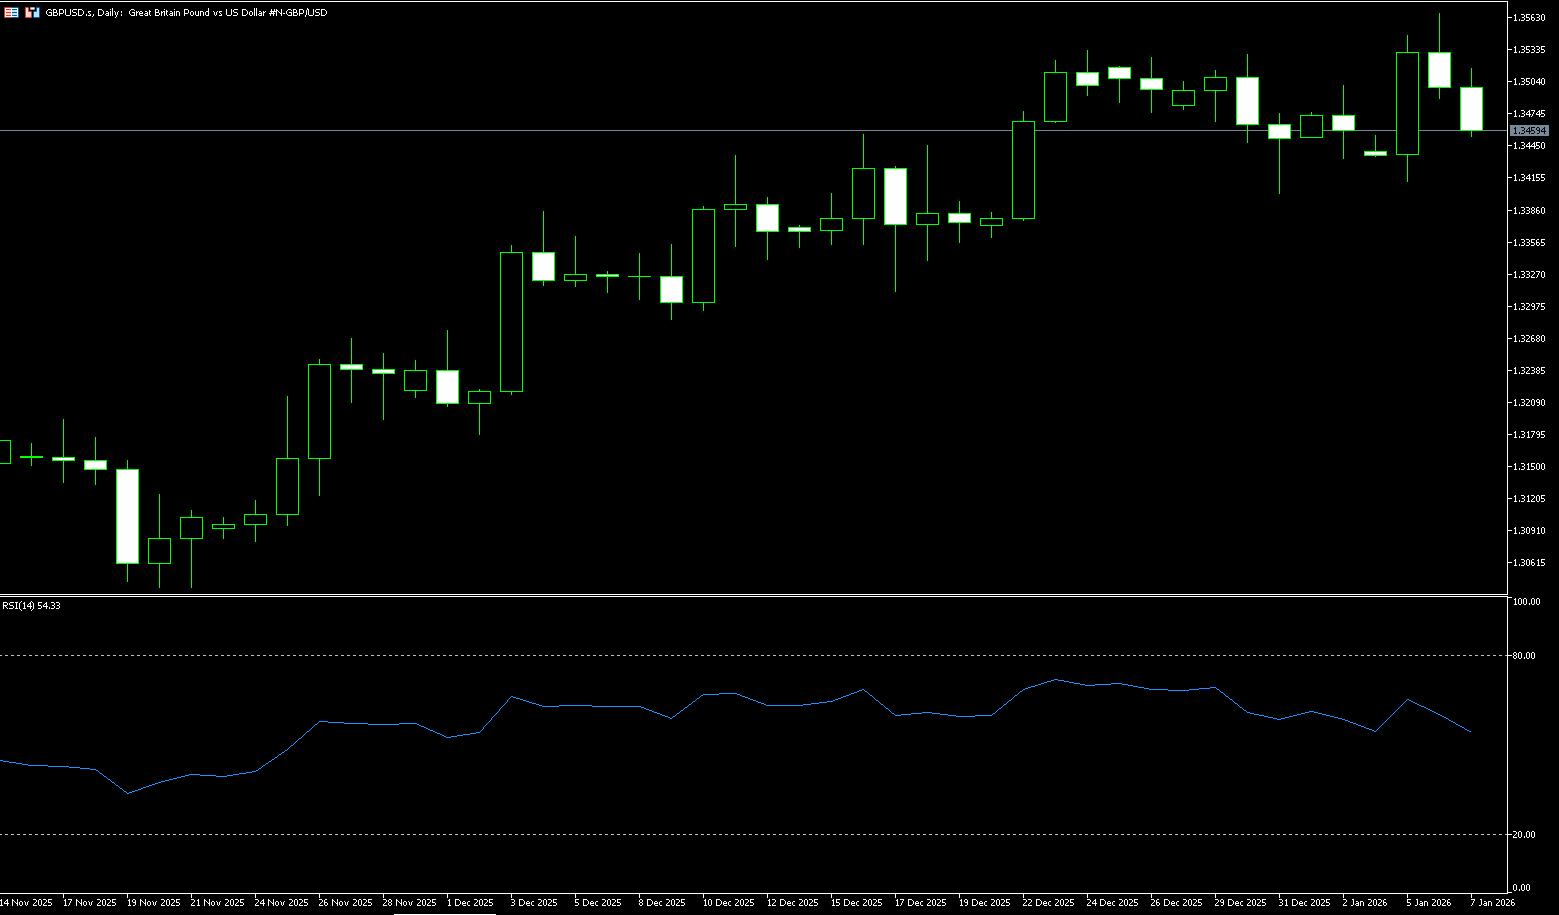
The GBP/USD pair traded in a narrow range around the psychological level of 1.3500 on Wednesday and now appears to have paused its decline from the previous day's pullback to its highest level since September 18. Furthermore, the fundamental backdrop seems to favor bullish traders, suggesting an upward path of least resistance for spot prices. The US dollar maintained its overnight gains despite a lack of bullish confidence ahead of dovish Fed expectations and a series of key macroeconomic indicators. In addition, the generally bullish sentiment in global equities has weakened demand for the safe-haven dollar, which in turn is seen as a key tailwind for the GBP/USD pair. On the other hand, the pound continues to be supported by easing concerns about the UK budget and a relatively hawkish Bank of England.
The daily chart technicals suggest that while momentum remains bullish, GBP/USD appears poised for a pullback. Buyers failed to break through 1.3567 (Tuesday's high) and the psychological level of 1.3600, exacerbating the pullback towards 1.3500. A break above this level would pave the way for a test of the key 20-day simple moving average support at 1.3453. Once broken, the next target would be the psychological level of 1.3400. Conversely, with the 14-day Relative Strength Index (RSI) strengthening, the daily technical chart for GBP/USD suggests that the pair's break above Tuesday's high of 1.3567 earlier in the week has opened up further upside potential. A break above 1.3567-1.3559 (the high from September 19th last year) would likely test the 1.3600 level in the near term.
Consider going long on GBP/USD around 1.3450 today; Stop loss: 1.3435; Target: 1.350; 1.3520
USD/JPY
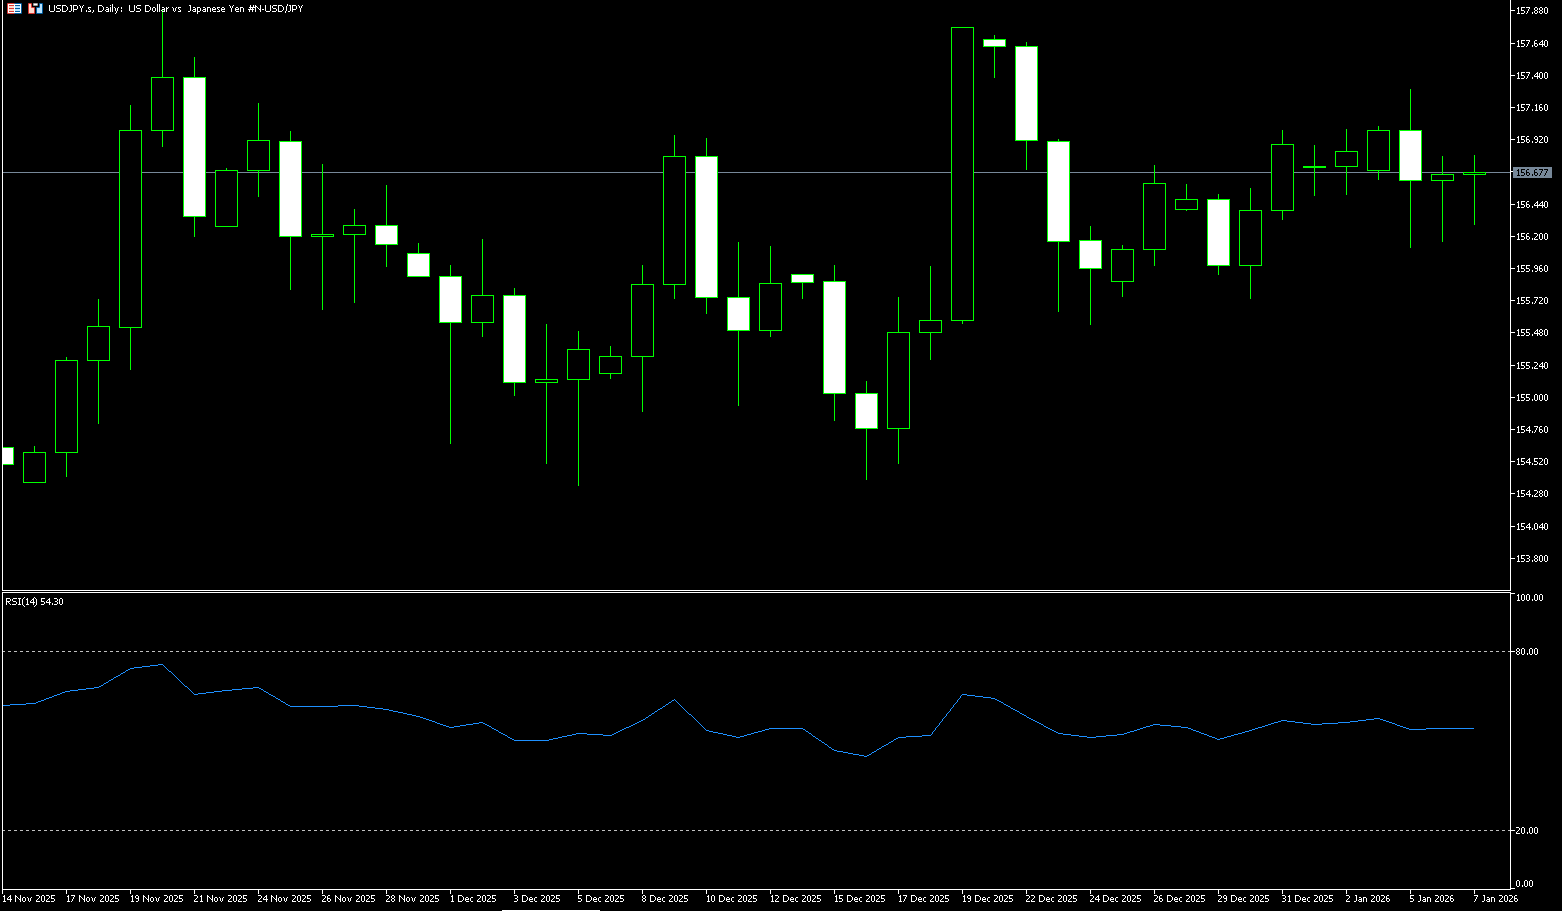
The yen fell below 156.60 per dollar on Wednesday, extending its losses for the second consecutive trading day, as escalating geopolitical tensions with China weighed on sentiment. Beijing imposed export controls on Japanese military-use products, following comments made by Japanese Prime Minister Sanae Takaichi last year regarding Taiwan. These measures cover a range of items, including electronics, sensors, and technologies used in shipping and aviation. Despite these developments, broader geopolitical risks, including recent US intervention in Venezuela, appear to have had a limited impact on currency markets. Domestically, investors continue to bet on further interest rate hikes by the Bank of Japan this year, as Governor Kazuo Ueda reiterated that policy adjustments will depend on economic and price developments, consistent with the central bank's forecasts. He also expressed confidence that the economy can maintain a virtuous cycle of wage and price increases.
Despite Bank of Japan Governor Kazuo Ueda's indication of further interest rate hikes in the near future, the yen has performed poorly overall. Governor Ueda stated on Monday, "If the economy and prices move in line with our forecasts, the BoJ expects to continue raising interest rates," adding that adjusting the degree of monetary support would help achieve "sustainable growth and stable inflation." The exchange rate is currently near the 4-hour Bollinger Band middle line (156.71), indicating short-term pressure. The MACD indicator shows a negative DIFF value (-0.008) and is below the DEA line (0.063), suggesting accumulating downward pressure. Strong resistance lies around 157.00-157.20 (the lower Bollinger Band) and 157.70 (the high of December 19th last year). If a surge in Japanese government bond yields triggers expectations of official intervention or a return of safe-haven funds to the yen, the exchange rate may test the support level of 155.80-156.00.
Today, consider shorting the US dollar around 157.00; Stop loss: 157.20; Target: 156.00; 155.80
EUR/USD
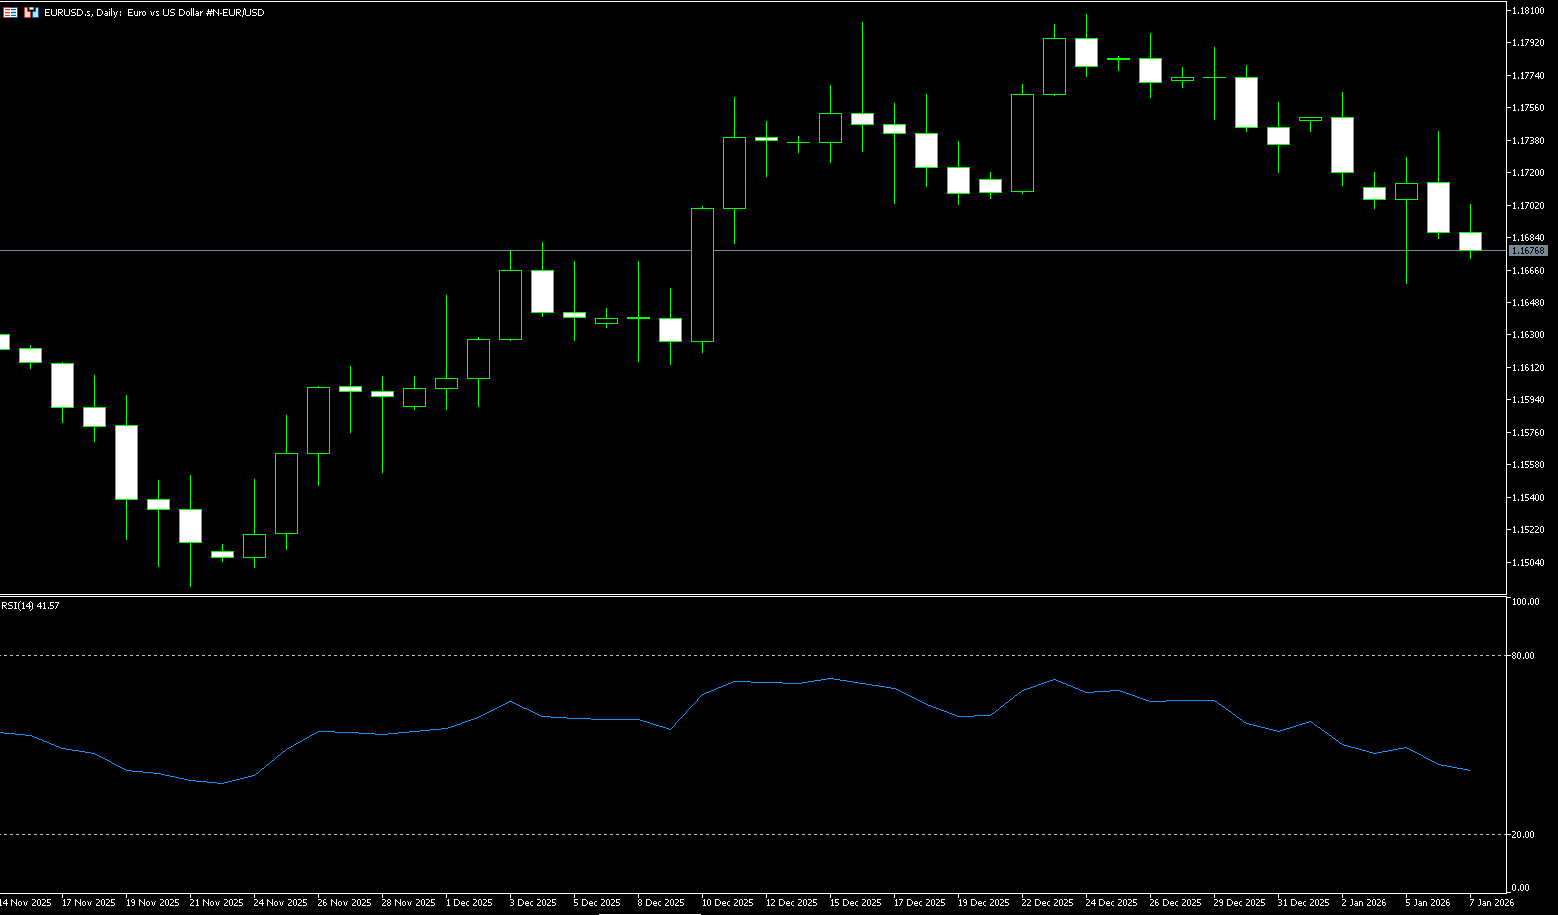
The euro fell below $1.1700, hitting its lowest level since December 9th, as slowing inflation in the eurozone dampened market expectations for a year-end rate hike by the European Central Bank. Eurostat data showed that consumer price inflation fell to 2% in December, the lowest level in four months, bringing inflation back to the ECB's intermediate target. Additionally, German retail sales fell 0.6% in November, the largest drop since May, well below the expected 0.2% growth. Meanwhile, the German labor market showed less growth momentum as the new year approached. Therefore, it is now almost impossible for the currency market to predict an ECB rate hike before December 2026, reinforcing expectations that interest rates are likely to remain unchanged for the foreseeable future.
The decline at the start of the week changed the technical picture for EUR/USD from neutral to slightly bullish to neutral. The failure to close above 1.1700 put downward pressure on the pair, which is now 30 pips away from the 100-day simple moving average at 1.1666. In this scenario, the next support level for EUR/USD is the 100-day simple moving average at 1.1666, followed by the 50-day simple moving average at 1.1646 and the psychological level of 1.1600. For a resumption of the bullish trend, bulls must break above the 20-day simple moving average at 1.1743, which would pave the way for the psychological target of 1.1800.
Consider going long on EUR/USD today near 1.1665; Stop loss: 1.1650; Target: 1.1710; 1.1720
Disclaimer: The information contained herein (1) is proprietary to BCR and/or its content providers; (2) may not be copied or distributed; (3) is not warranted to be accurate, complete or timely; and, (4) does not constitute advice or a recommendation by BCR or its content providers in respect of the investment in financial instruments. Neither BCR or its content providers are responsible for any damages or losses arising from any use of this information. Past performance is no guarantee of future results.
More Coverage


Risk Disclosure:Derivatives are traded over-the-counter on margin, which means they carry a high level of risk and there is a possibility you could lose all of your investment. These products are not suitable for all investors. Please ensure you fully understand the risks and carefully consider your financial situation and trading experience before trading. Seek independent financial advice if necessary before opening an account with BCR.
BCR Co Pty Ltd (Company No. 1975046) is a company incorporated under the laws of the British Virgin Islands, with its registered office at Trident Chambers, Wickham’s Cay 1, Road Town, Tortola, British Virgin Islands, and is licensed and regulated by the British Virgin Islands Financial Services Commission under License No. SIBA/L/19/1122.
Open Bridge Limited (Company No. 16701394) is a company incorporated under the Companies Act 2006 and registered in England and Wales, with its registered address at Kemp House, 160 City Road, London, City Road, London, England, EC1V 2NX. This entity acts solely as a payment processor and does not provide any trading or investment services.

 English
 简体中文
简体中文
 繁體中文
繁體中文
 Bahasa
Melayu
Bahasa
Melayu
 Tiếng
Việt
Tiếng
Việt
 ไทย
ไทย
 日本語
日本語
 한국어
한국어
 ភាសាខ្មែរ
 español