


0
US Dollar Index
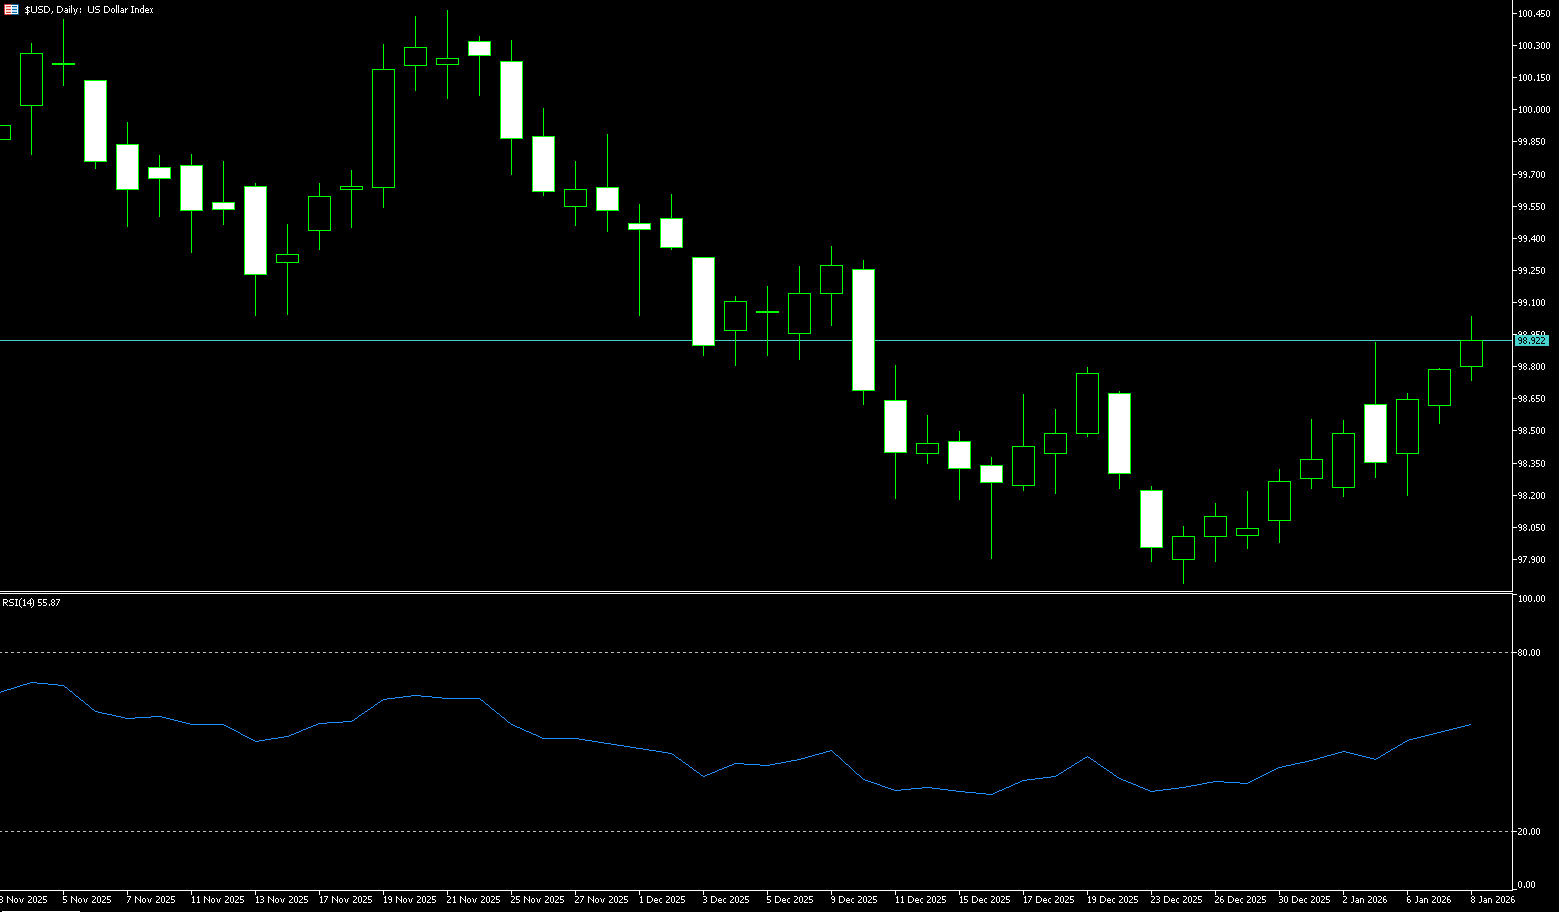
The US dollar index rose to 98.90 on Thursday, its highest level since December 9th, as investors weighed a mix of US economic data and reassessed the Federal Reserve's policy trajectory. Initial jobless claims rose slightly to 208,000 last week, while December's job cuts fell to 35,553, the lowest level since July 2024, indicating a strong labor market and easing concerns about an impending economic slowdown. The trade deficit narrowed sharply in October to $29.4 billion, the lowest level since June 2009, well below the forecast of $58.1 billion, as imports fell to a 21-month low while exports reached a record high amid tariff-driven volatility. Focus now shifts to Friday's December jobs report for further insight into labor market conditions. The market currently expects a near 90% probability that the Federal Reserve will keep interest rates unchanged, although traders still anticipate multiple rate cuts later this year.
The US dollar index saw limited fluctuations immediately after the data release, generally remaining within a narrow range near its relatively low levels this week. From a technical analysis perspective, the dollar index continues to face short-term pressure. The key short-term support zone is located in the 98.30-98.50 area. This zone is not only a technical level that has been tested multiple times recently, but also corresponds to a psychological support level formed as market disappointment with economic data intensifies. If subsequent data (especially non-farm payrolls) is further weak, or if global safe-haven demand weakens temporarily, the dollar index may test this zone. The first resistance zone is located in the 99.00-99.20 area, followed by the 99.50 level. This area represents a cluster of previous rebound highs and is a key threshold for the dollar index to shift from weakness to neutral. Unless future US economic data (such as inflation and retail sales) continues to exceed expectations, a significant breakout of this resistance level in the short term will be difficult.
Consider shorting the US Dollar Index around 99.00 today; Stop loss: 99.10; Target: 98.60; 98.50
WTI Crude Oil
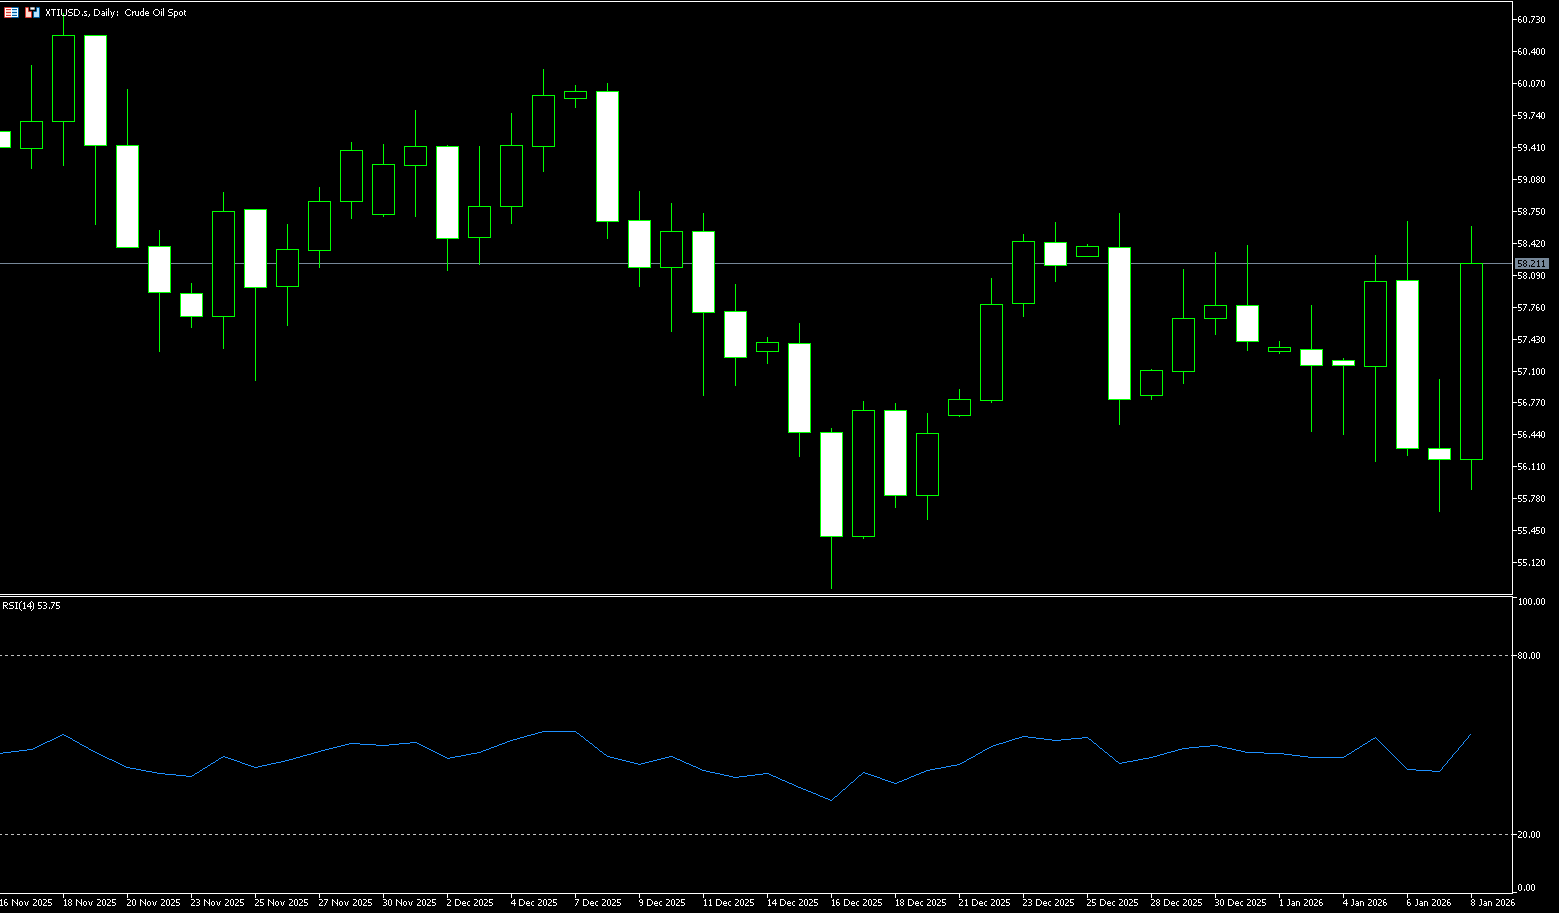
WTI crude oil rose more than 3.5% on Thursday to above $58.30 a barrel, rebounding from two days of declines as the market reassessed near-term supply risks and a stronger US physical balance. This move occurred after a surprise 3.8 million barrel drop in US crude inventories, contrary to expectations, offsetting concerns about ample global supply. Uncertainty surrounding Venezuelan oil shipments resurfaced after Washington outlined greater control over crude sales and strengthened sanctions enforcement by seizing tankers linked to Venezuela. While President Trump's comments about the potential diversion of Venezuelan crude to the US exacerbated long-term supply risks, enforcement and logistics limited downside pressure. Increased Cushing inventories and sharp rises in gasoline and distillate fuels limited gains, while demand expectations continued to be supported by a more inclusive Fed outlook, despite weak US labor data.
The technical pattern on the daily chart shows a slight improvement (strengthening positive momentum/golden cross of the 10-day and 20-day moving averages). The key resistance level is $58.72 (the 50% Fibonacci retracement of the $62.58–$54.88 decline), and it is being reinforced at $60.00 (a psychological level), currently under pressure but without a decisive breakout. A failure here would weaken the short-term outlook and increase downside risk, as oil prices remain within their recent consolidation range after repeated failed attempts to rally from the 2025 low ($54.88). However, as long as oil prices hold above $55.14 (the May 5th low), the short-term structure is expected to remain slightly bullish; a break below this level could trigger a deeper decline towards $54.88 (the December 16th low).
Today, consider going long on spot crude oil around 58.30; Stop loss: 58.10; Target: 59.80; 60.00
Spot Gold
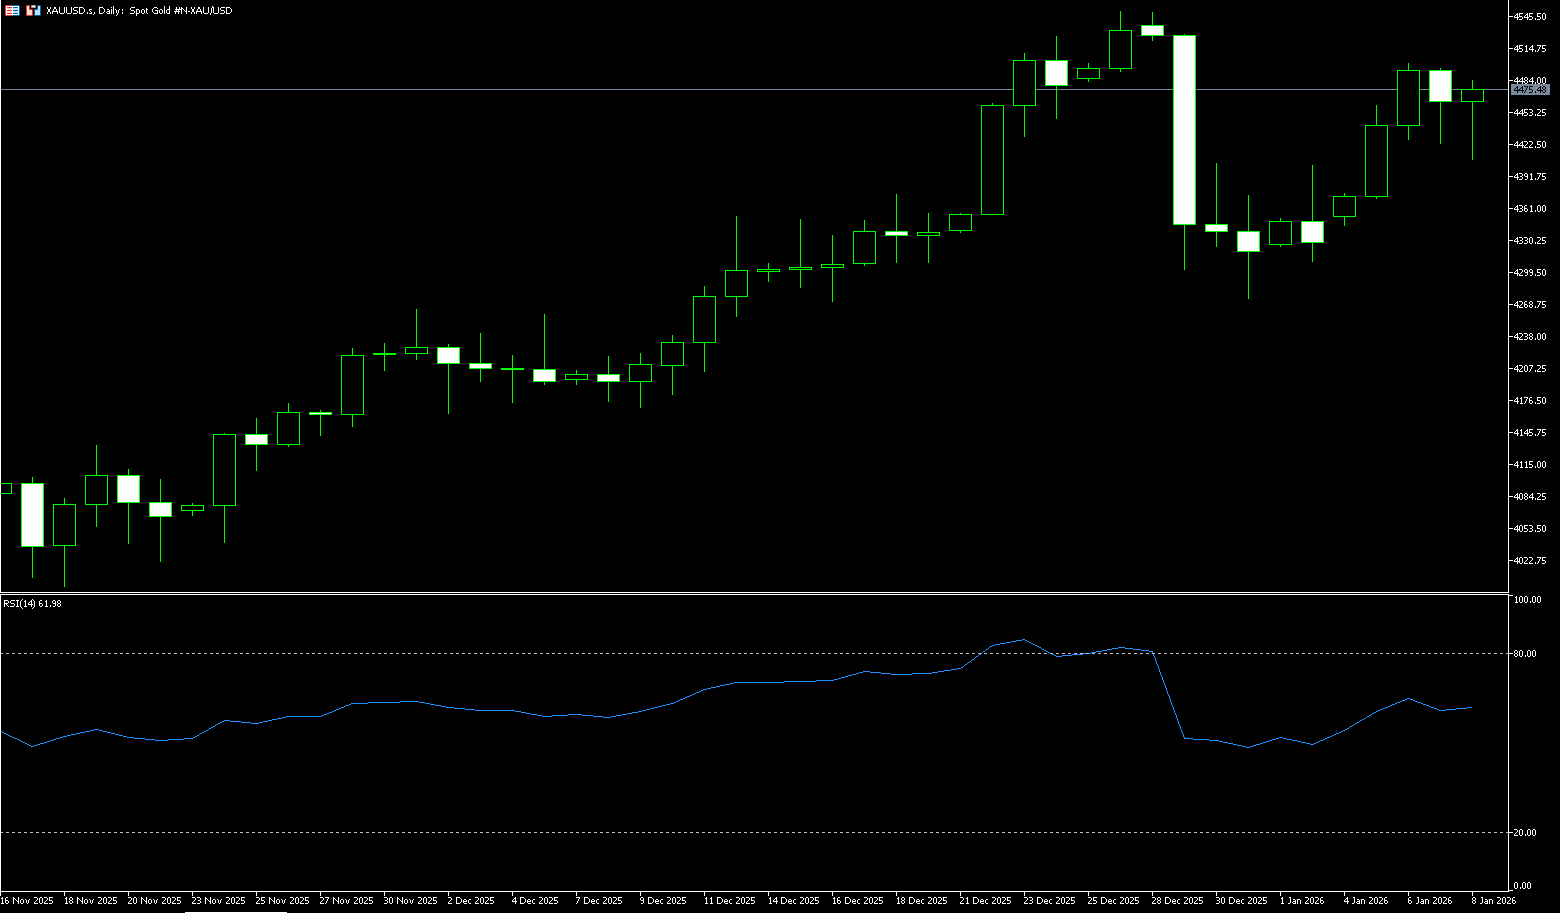
On Thursday, spot gold traded around $4,470 per ounce. Gold prices fell nearly 1% on Wednesday as investors took profits after recent gains. However, weaker-than-expected US jobs data supported expectations of a Fed rate cut, narrowing the losses before the close. This pullback was profit-taking after the recent surge, while the weak jobs data continued to support expectations of Fed easing, providing a bottom for gold prices. Data showed that US job openings fell more than expected in November, and December's ADP private sector job growth was also lower than expected. The market now expects a 61 basis point rate cut this year, and focus has shifted to Friday's non-farm payroll report. Geopolitical uncertainty persists. Following the arrest of Venezuelan President Maduro over the weekend, US President Trump announced plans on Tuesday to refine and sell Venezuelan crude oil. The White House also confirmed discussions on the option of acquiring Greenland, including potential military intervention. Furthermore, central banks of major Asian countries increased their gold holdings for the 14th consecutive month in December.
Overall, the current pullback in gold prices reflects more profit-taking at higher levels and a temporary correction in risk sentiment than a trend reversal. Technically, gold has entered a consolidation phase at higher levels. Gold prices remain above the 14-day simple moving average, which is located near the psychological levels of $4,412 and $4,400 and continues to rise, forming important dynamic support. Momentum indicators show that the MACD has fallen below the signal line and is below the zero line, indicating increased short-term downward pressure; the RSI has fallen to around 60, in the neutral range, reflecting a temporary balance between bullish and bearish forces. If the momentum stabilizes above the $4,400 level (a psychological key level) and strengthens again, gold prices are expected to retest $4,497 (the high of January 6th) and the previous all-time high of $4,549.80. Conversely, if prices break below $4,412 (the 14-day simple moving average) and $4,400 (the psychological key level), they may retest the support area of $4,381.30 (the 20-day simple moving average), but in the context of a medium-term bullish trend, this is more likely to be seen as a technical correction.
Consider going long on spot gold around 4,472 today; Stop loss: 4,467; Target: 4,495; 4,500
AUD/USD
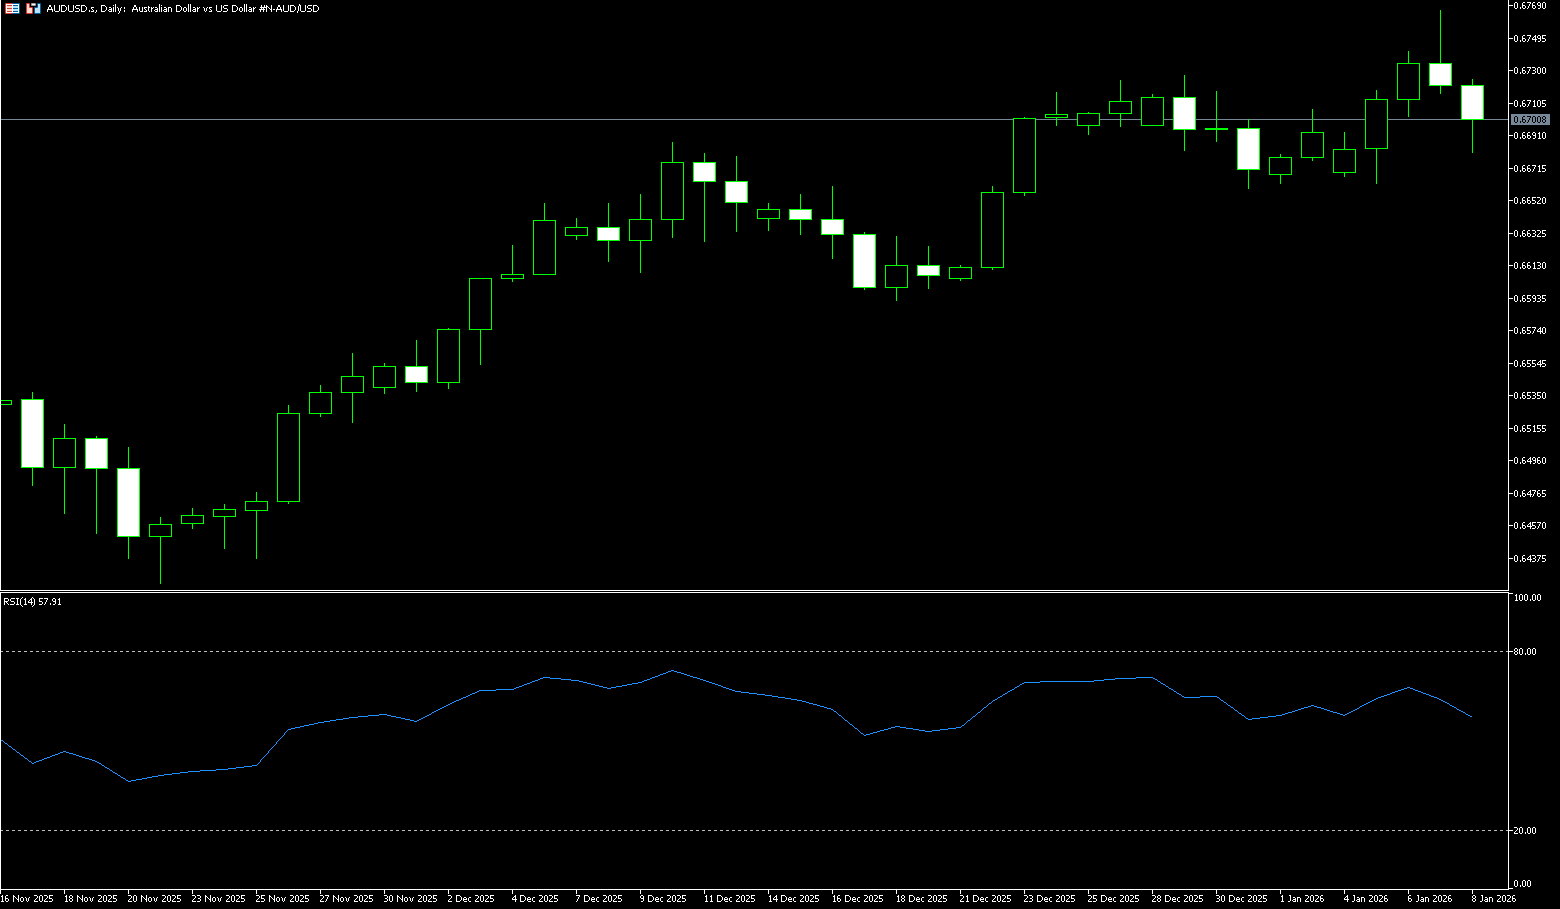
The Australian dollar edged lower against the US dollar on Thursday after Australian trade balance data showed the trade surplus narrowed to A$2.936 billion in November (down month-on-month), compared to A$4.353 billion previously (revised from A$4.385 billion). The Australian Bureau of Statistics (ABS) reported on Thursday that exports fell 2.9% month-on-month in November, compared to a 2.8% increase in the previous month (revised from 3.4%). Meanwhile, imports rose 0.2% month-on-month in November, compared to a 2.4% increase in October (revised from 2.0%). The mixed inflation data for November has made the Reserve Bank of Australia's (RBA) policy outlook uncertain. The focus now shifts to the upcoming quarterly CPI report at the end of this month, which is expected to provide clearer guidance for the RBA's next policy move. The Australian Bureau of Statistics (ABS) reported on Wednesday that Australia's Consumer Price Index (CPI) rose 3.4% year-on-year in November, down from 3.8% in October.
The Australian dollar/US dollar pair traded around 0.6700 on Thursday. Technical analysis on the daily chart shows the pair remains in an ascending channel pattern, suggesting a continued bullish bias. However, the 14-day Relative Strength Index (RSI) is at 62.12, indicating weak bullish momentum. The AUD/USD exchange rate may target 0.6766, the highest level since October 2024, followed by a move towards the psychological level of 0.6800. Initial support is located around 0.6680, followed by the 30-day simple moving average at 0.6655 and the 0.6659 area (last week's low). A break below this support area could put the AUD/USD pair at risk of falling to the 40-day simple moving average at 0.6614.
Consider going long on the Australian dollar around 0.6685 today; Stop loss: 0.6672; Target: 0.6730; 0.6740
GBP/USD
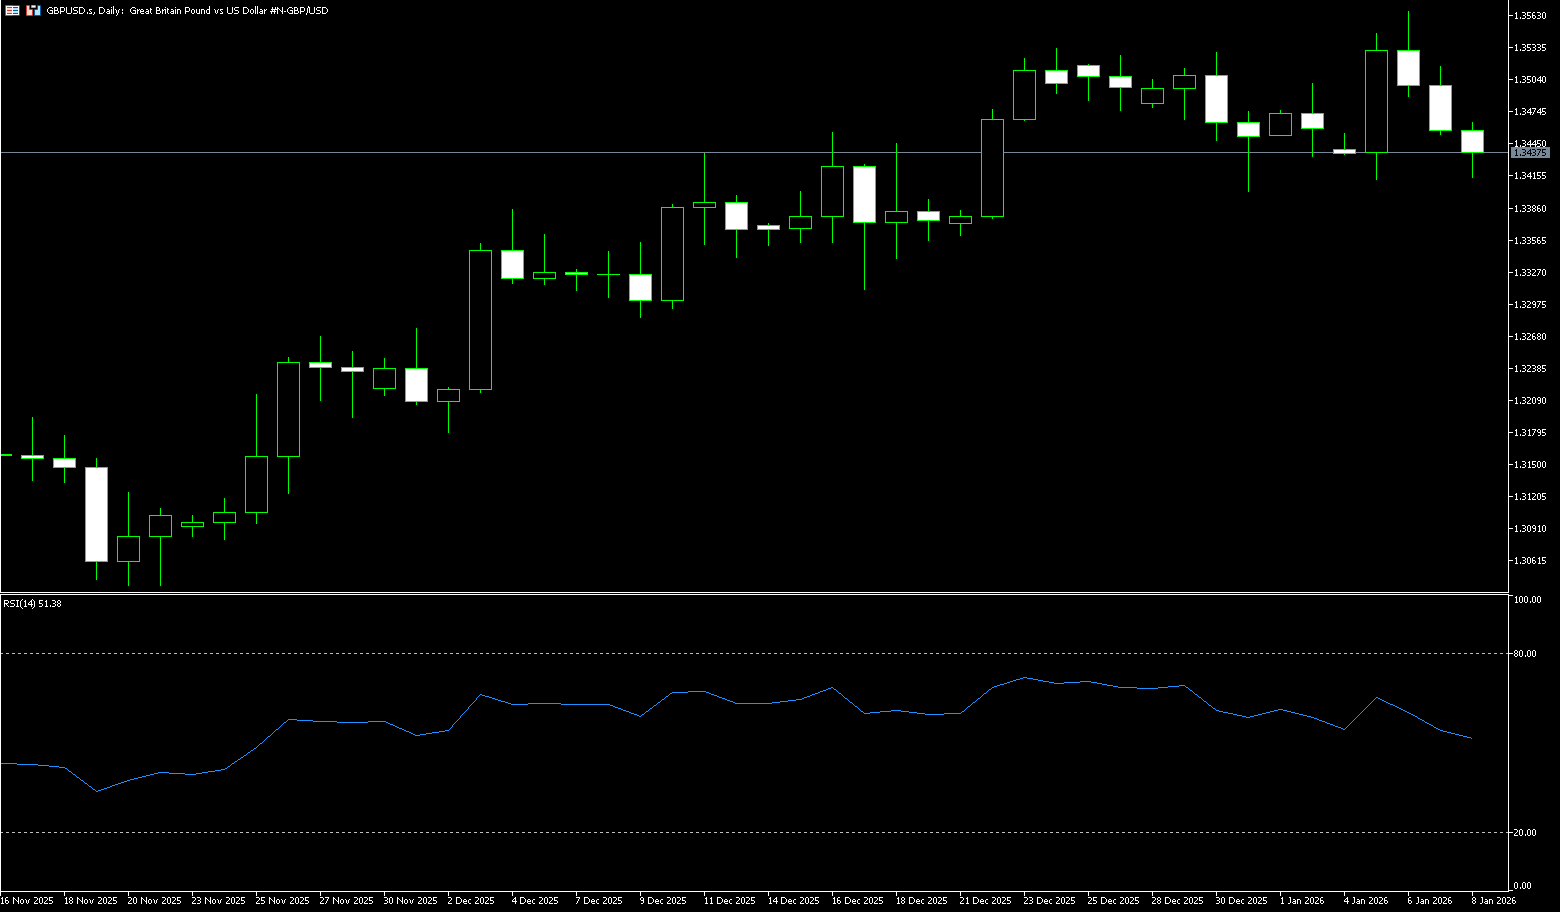
GBP/USD was seen consolidating significant losses from the past two days during Thursday's Asian session, trading in a narrow range around 1.3440. However, the fundamental backdrop offers some warning to bearish traders, suggesting caution before entering positions before a further pullback from the 1.3565-1.3570 area (the highest level since September 18 reached on Tuesday). A slight deterioration in global risk sentiment offset Wednesday's mixed US economic data, helping the safe-haven dollar maintain its weekly gains, which in turn limited the GBP/USD pair's gains. Furthermore, no relevant market-driving economic data will be released from the UK on Thursday, leaving spot prices influenced by dollar price dynamics. The focus will remain on Friday's US non-farm payrolls report, which will influence market expectations regarding the Fed's future rate cut path. This, in turn, will drive near-term demand for the US dollar and determine the next direction of the GBP/USD pair.
GBP/USD is poised for a continued bearish trend this week, indicating short-term dollar strength, but so far, the pair is far from turning bearish. The 14-day Relative Strength Index (RSI) on the daily chart measures momentum biased towards buyers, but recently broke below the latest low and is moving towards the neutral line. If GBP/USD breaks below 1.3400, watch for a test of the 200-day simple moving average at 1.3389. A break above this level could push the pair towards support at 1.3350 (lower Bollinger Band). Conversely, a daily close above 1.3500 (psychological level) would allow buyers to retest Tuesday's high of 1.3567, opening up further upside potential. A break above 1.3567-1.3559 (the high of September 19th last year) is expected to test the 1.3600 level in the near term.
Consider going long on GBP/USD around 1.3422 today; Stop loss: 1.3410; Target: 1.3480; 1.3490
USD/JPY
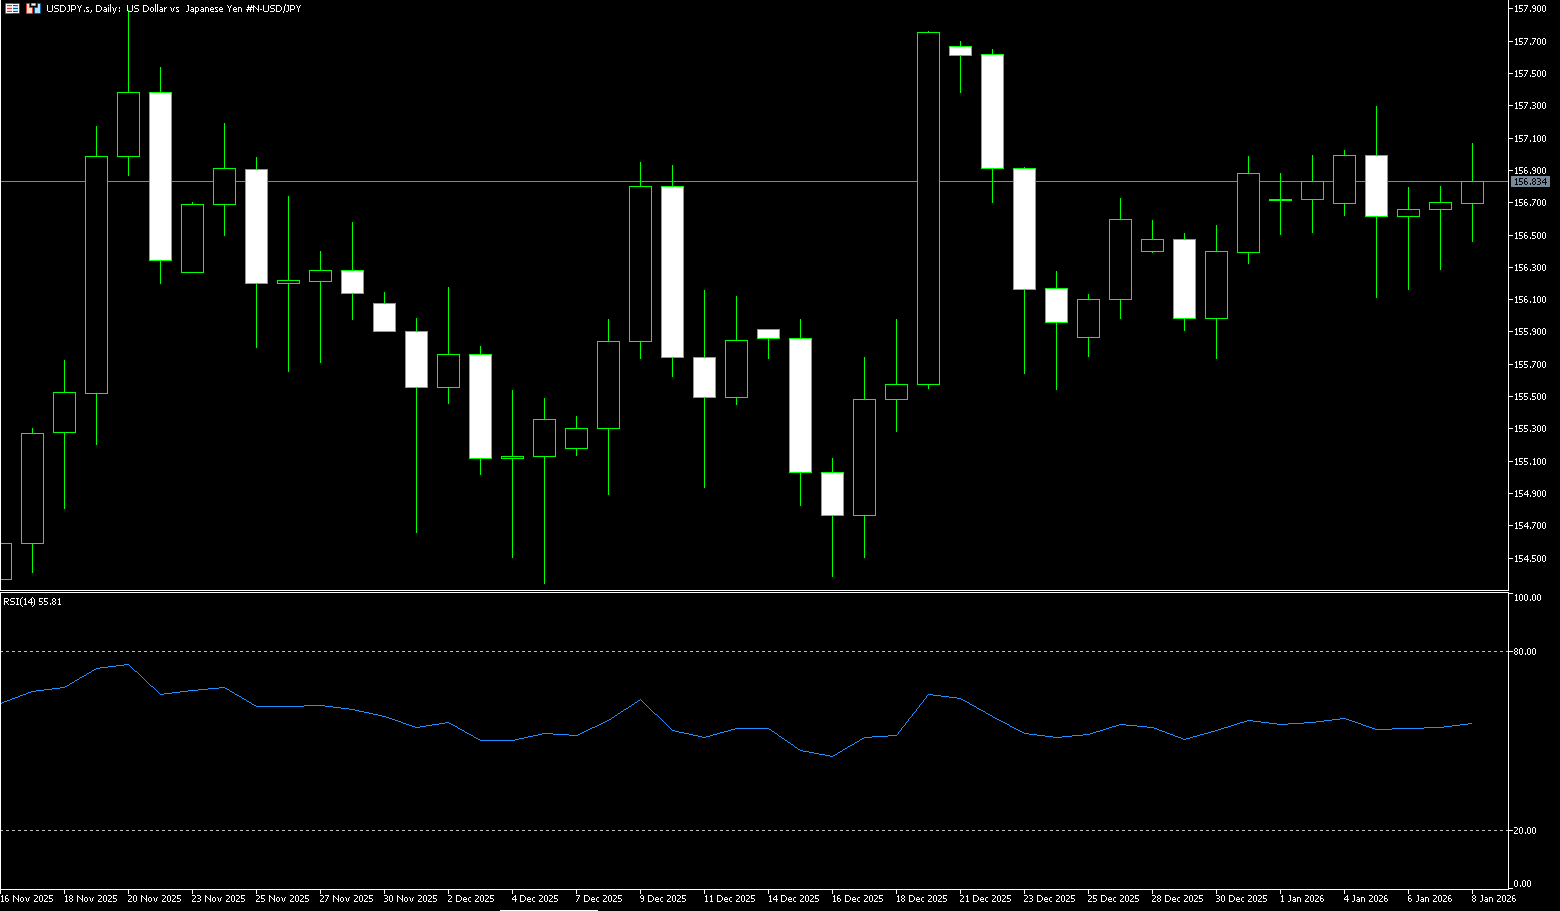
On Thursday, USD/JPY traded slightly below 157, marking its third consecutive day of gains, pressured by a stronger dollar and rising geopolitical risks. The dollar generally strengthened against major peer currencies, and mixed U.S. economic data provided little guidance for the Fed's policy outlook. Investors were also weighing the potential impact of escalating tensions between Japan and China after Beijing imposed export controls on military products to Japan. Domestically, real wages in Japan fell 2.8% in November as inflation far outpaced wage growth, posing a challenge to the Bank of Japan's plans for further policy tightening. Earlier this week, BOJ Governor Kazuo Ueda reiterated that the central bank would continue raising interest rates if economic and price developments met expectations.
USD/JPY is slightly above the 100-period simple moving average of 156.25 on the 4-hour chart, highlighting a stable bullish bias, with the pair holding above it. The current 100-period simple moving average (SMMA) at 156.25 provides nearby dynamic support. The MACD (Moving Average Convergence/Divergence) indicator has formed a bullish crossover, with the MACD line climbing above the signal line from near the zero level, while a moderately positive histogram suggests improving momentum. The Relative Strength Index (RSI) at 58, above the 55 midline, further reinforces the mildly bullish tone. The uptrend line from 155.30 is supporting the USD/JPY pair, with support near the 156.00 level. Holding above this benchmark will keep buyers in control and maintain the upward bias. If the USD/JPY pair holds above the trend line and the rising 100-period SMMA at 156.25, the path of least resistance points to 157.00 (the psychological level) and near 157.70 (the high from December 19th of last year).
Consider shorting the US dollar around 157.20 today; Stop loss: 157.40; Target: 156.20; 156.30
EUR/USD
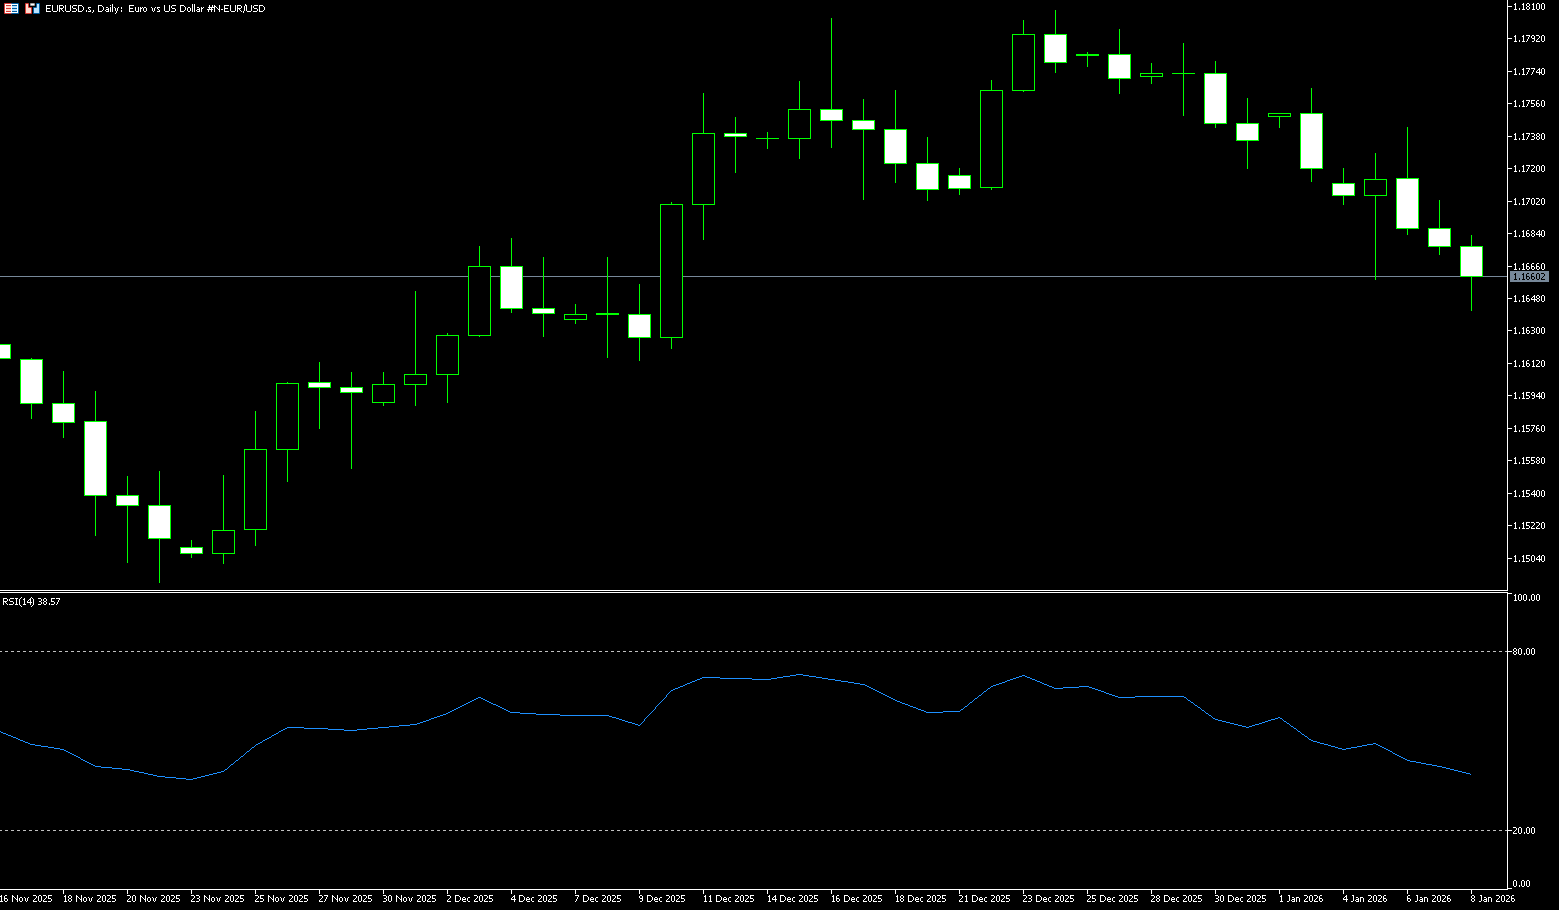
The continued bearish trend in EUR/USD appears to have encountered some initial resistance near the 1.170 level, with the market awaiting Friday's key non-farm payroll data. EUR/USD traded in volatile swings mid-week, continuing its bearish trend since the late December high slightly above 1.1800. The pair's volatile price action is mirroring the similar uncertainty surrounding the US dollar, which struggled to sustain a strong rebound near its December low of 97.75. Furthermore, the lack of direction in the pair is consistent with the broad decline in US Treasury yields and lower German 10-year bond yields, as market participants continue to digest weaker-than-expected Eurozone inflation data and the weak December ADP report (+41K), all ahead of Friday's key non-farm payroll data.
From a technical perspective, the risks for the EUR/USD pair are skewed to the downside. The daily chart shows EUR/USD trading below a bearish 20-day simple moving average at 1.1739, which slopes downward and provides resistance. Meanwhile, the pair is barely holding below the bullish 100-day simple moving average at 1.1667. At the same time, momentum indicators are slightly downward near their midline. The 14-day Relative Strength Index (RSI) is flat at 44, consistent with the overall negative trend. The next support level for EUR/USD is the 50-day simple moving average at 1.1648, followed by the psychological level of 1.1600. For a resumption of the bullish trend, bulls must break through the psychological level of 1.1700, followed by the 20-day simple moving average at 1.1739.
Consider going long on EUR/USD today near 1.1630; Stop loss: 1.1620; Target: 1.1680; 1.1690
Disclaimer: The information contained herein (1) is proprietary to BCR and/or its content providers; (2) may not be copied or distributed; (3) is not warranted to be accurate, complete or timely; and, (4) does not constitute advice or a recommendation by BCR or its content providers in respect of the investment in financial instruments. Neither BCR or its content providers are responsible for any damages or losses arising from any use of this information. Past performance is no guarantee of future results.
More Coverage


Risk Disclosure:Derivatives are traded over-the-counter on margin, which means they carry a high level of risk and there is a possibility you could lose all of your investment. These products are not suitable for all investors. Please ensure you fully understand the risks and carefully consider your financial situation and trading experience before trading. Seek independent financial advice if necessary before opening an account with BCR.
BCR Co Pty Ltd (Company No. 1975046) is a company incorporated under the laws of the British Virgin Islands, with its registered office at Trident Chambers, Wickham’s Cay 1, Road Town, Tortola, British Virgin Islands, and is licensed and regulated by the British Virgin Islands Financial Services Commission under License No. SIBA/L/19/1122.
Open Bridge Limited (Company No. 16701394) is a company incorporated under the Companies Act 2006 and registered in England and Wales, with its registered address at Kemp House, 160 City Road, London, City Road, London, England, EC1V 2NX. This entity acts solely as a payment processor and does not provide any trading or investment services.

 English
 简体中文
简体中文
 繁體中文
繁體中文
 Bahasa
Melayu
Bahasa
Melayu
 Tiếng
Việt
Tiếng
Việt
 ไทย
ไทย
 日本語
日本語
 한국어
한국어
 ភាសាខ្មែរ
 español